- 1Android进程间通讯——多进程共用SharedPreferences_android sharedpreferences多进程
- 2腾讯offer是什么样子_阿里员工求助:年包200+,拿到腾讯11级offer,跳不跳
- 3【Git】多个托管平台Git账户配置
- 4docker安装与配置docker镜像加速器_配置docker镜像家属器
- 5scanf设置精度、域宽易错点_若scanf域宽
- 6SprongBoot内置tomcat配置调优_springboot集成的tomcat配置优化
- 7JAVA数据库操作二(多个数据库操作+Spring data + jpa)_java实现同时修改两个数据库
- 800_Python—猜字游戏while-if基础版_#猜字游戏编写 #目的:掌握if分支(选择)结构、while循环结构的程序设计 #大部分源
- 9Midjourney的--seed 解释,并附有例子_midjourney seed
- 10密钥或者消息的CMAC计算_cmac_ctx_new
【五】空间域图像增强
赞
踩
1 空间域增强基础
空间域增强是对图像的一个邻域,用滤波、平滑、锐化等方法,从而增强图像。
2 空间域滤波
滤波就是将信号中特定波段频率滤除,常用傅里叶变换及其逆变换等实现。
具体过程就是取一个方形模板(一般多是3*3),逐点对图像进行乘积(模板上的点乘图像上对应的点再求和),对于边界上的点,有三种常用策略:(1)收缩处理范围;(2)使用常数填充;(3)使用复制像素。
卷积是一种特殊的滤波过程,区别在模板与对应的点相乘之前,需要先围绕中心点旋转180度。而相关就是最普通的滤波。
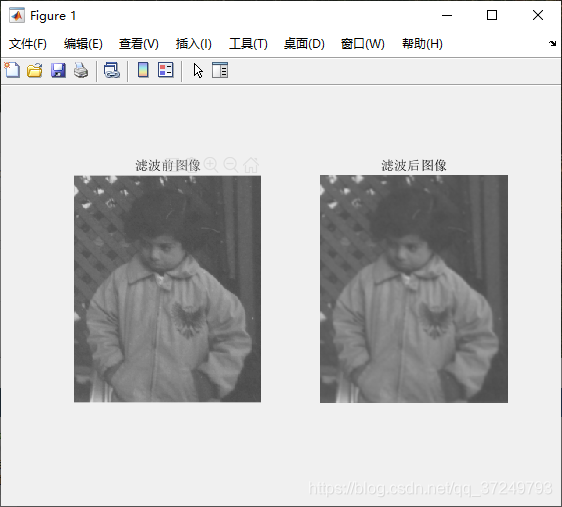
Matlab实现
f= imread('pout.tif');
w = [1 1 1; 1 1 1; 1 1 1] / 9;%滤波模板(3*3)
g = imfilter(f, w, 'corr', 'replicate');%相关滤波,边界采用最邻近填充
subplot(1,2,1),imshow(f);
title('滤波前图像');
subplot(1,2,2),imshow(g);
title('滤波后图像');
- 1
- 2
- 3
- 4
- 5
- 6
- 7

也可以用fspecial函数创建预定义的二维滤波器。
3 图像平滑
图像平滑可以用来减小和抑制噪声,一般可以用邻域平均达到平滑效果。
3.1 平均平滑
平滑的原理是用模板滤波时把单独噪点的值改为邻域的加权平均值,从而达到平滑的效果。
Matlab实现
I = imread('baby_noise.bmp');
figure,imshow(I);
h3 = fspecial('average',3);%3*3平均模板
I3 = imfilter(I,h3,'corr','replicate');
figure,imshow(I3);
h5 = fspecial('average',5);%5*5平均模板
I5 = imfilter(I,h5,'corr','replicate');
figure,imshow(I5);
h7 = fspecial('average',7);%7*7平均模板
I7 = imfilter(I,h7,'corr','replicate');
figure,imshow(I7);
- 1
- 2
- 3
- 4
- 5
- 6
- 7
- 8
- 9
- 10
- 11


3.2 高斯平滑
根据高斯函数,模板中心点对应的权重最大,离中心点远的权重变小。
Matlab实现
 I = imread('baby_noise.bmp');
 figure, imshow(I);

 h3_5 = fspecial('gaussian', 3, 0.5); % sigma=0.5的3*3高斯模板
 I3_5 = imfilter(I, h3_5); % 高斯平滑
 figure, imshow(I3_5);

 h3_8 = fspecial('gaussian', 3, 0.8); % sigma=0.8的3*3高斯模板
 I3_8 = imfilter(I, h3_8);
 figure, imshow(I3_8);

 h3_18 = fspecial('gaussian', 3, 1.8) % sigma=1.8的3*3高斯模板,接近于平均模板
 I3_18 = imfilter(I, h3_18);
 figure, imshow(I3_18);

 h5_8 = fspecial('gaussian', 5, 0.8);
 I5_8 = imfilter(I, h5_8);
 figure, imshow(I5_8);

 imwrite(I5_8, 'baby5_8.bmp');
 h7_12 = fspecial('gaussian', 7, 1.2);
 I7_12 = imfilter(I, h7_12);
 figure, imshow(I7_12);

 imwrite(I7_12, 'baby7_12.bmp');
- 1
- 2
- 3
- 4
- 5
- 6
- 7
- 8
- 9
- 10
- 11
- 12
- 13
- 14
- 15
- 16
- 17
- 18
- 19
- 20
- 21
- 22
- 23
- 24
- 25
- 26


3.3 自适应平滑滤波
对每一个像素求周围区域的信息,如果该点判断为噪声就进行平滑。
4 中值滤波
对像素邻域的值进行排序,取中值。重要用于消除椒盐噪声
Matlab实现
 I = imread('lena_salt.bmp');
 figure, imshow(I);

 J = imnoise(I,'salt & pepper');%添加椒盐噪声
 figure, imshow(J);

 w1 = [1 2 1;2 4 2;1 2 1] / 16;
 J1 = imfilter(J,w1,'corr','replicate'); % 高斯平滑
 figure, imshow(J1);

 w2 = [1 1 1;1 1 1;1 1 1] / 9;
 J2 = imfilter(J,w2,'corr','replicate'); % 平均平滑
 figure, imshow(J2);

 J3 = medfilt2(J,[3,3]); % 中值滤波
 figure, imshow(J3);
- 1
- 2
- 3
- 4
- 5
- 6
- 7
- 8
- 9
- 10
- 11
- 12
- 13
- 14
- 15
- 16

改进的中值滤波:通过判断是否是该像素邻域的极值,如果是就按一般中值滤波处理,如果不是就不处理。
5 图像锐化
图像锐化可以使模糊的图像变得清晰起来。
原理跟平滑类似,但却是通过其导数实现的。
5.1 基于一阶导数的梯度算子
5.1.1 Robert交叉梯度
这个用于增强接近+45°和-45°的部分。
Matlab实现
 I = imread('bacteria.bmp');
 figure, imshow(I);

 w1 = [-1 0;0 1];
 w2 = [0 -1;1 0];

 G1 = imfilter(I,w1,'corr','replicate');
 G2 = imfilter(I,w2,'corr','replicate');
 G = abs(G1) + abs(G2);%计算Robert梯度
 figure, imshow(G,[]);
 figure, imshow(abs(G1),[]);
 figure, imshow(abs(G2),[]);
- 1
- 2
- 3
- 4
- 5
- 6
- 7
- 8
- 9
- 10
- 11
- 12

5.1.2 Soble梯度
因为我们滤波常用奇数尺寸的模板,因而一种Sobel梯度常用于此。
Matlab实现
 I = imread('bacteria.bmp');
 w1 = fspecial('sobel');
 w2 = w1';
 G1 = imfilter(I,w1);
 G2 = imfilter(I,w2);
 G = abs(G1) + abs(G2);%计算Robert梯度
 figure, imshow(G1,[]);
 figure, imshow(G2,[]);
 figure, imshow(G,[]);
- 1
- 2
- 3
- 4
- 5
- 6
- 7
- 8
- 9

可以利用Matlab梯度函数gradient计算Sobel梯度。
5.2 基于二阶微分的拉普拉斯算子
有正负值相同结果的模板;有在旋转90°的条件下,这个模板对于图像先旋转后滤波还是先滤波后旋转都是同样的结果;也有旋转45°不变的模板;有根据中心点的距离给予不同权重的模板。
Matlab实现
 I = imread('bacteria.bmp');
 I = double(I);
 w1 = [0 -1 0;-1 4 -1;0 -1 0];      %w1模板
 L1 = imfilter(I,w1,'corr','replicate');
 w3 = [-1 -1 -1;-1 8 -1;-1 -1 -1];  %w3模板
 L3 = imfilter(I,w2,'corr','replicate');
 w5 = [1 4 1;4 -20 4;1 4 1];        %w5模板
 L5 = imfilter(I,w3,'corr','replicate');
 figure;
 subplot(1,4,1),imshow(I);
 title('原图像');
 subplot(1,4,2),imshow(abs(L1),[]);
 title('w1模板锐化');
 subplot(1,4,3),imshow(abs(L3),[]);
 title('w3模板锐化');
 subplot(1,4,4),imshow(abs(L5),[]);
 title('w5模板锐化');
- 1
- 2
- 3
- 4
- 5
- 6
- 7
- 8
- 9
- 10
- 11
- 12
- 13
- 14
- 15
- 16
- 17

5.3 一阶和二阶导数锐化对比
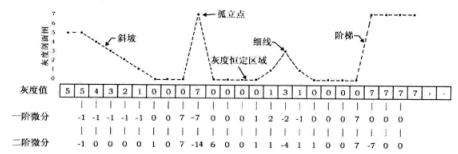
1.一阶导数通常会产生较宽的边缘。
2.二阶导数对于阶跃性边缘中心产生零交叉,二对于屋顶状边缘,二阶导数取极值。
3.二阶导数对细节有较强的响应,如细线和孤立噪声点。

5.4 高提升滤波
一阶和二阶滤波都会把原图像平滑区域的灰度信息丢失。高提升滤波的图像是把原图像和锐化图像按比例混合,达到理想效果。
5.5 高斯-拉普拉斯变换
锐化容易把噪声也增强了,所以可以先把有噪声的图像先平滑滤波,再进行锐化增强边缘和细节。
Matlab实现
 I = imread('babyNew.bmp');
 Id = double(I);%滤波前转化为双精度型
 h_lap = [-1 -1 -1; -1 8 -1; -1 -1 -1];%拉普拉斯算子
 I_lap = imfilter(Id,h_lap,'corr','replicate');%Laplacian锐化
 h_log = fspecial('log',5,0.5);%大小为5,sigma=0.5的LoG算子
 I_log = imfilter(Id,h_log,'corr','replicate');
 h_log2 = fspecial('log',5,2);%大小为5,sigma=0.5的LoG算子
 I_log2 = imfilter(Id,h_log2,'corr','replicate');
 figure;
 subplot(1,4,1),imshow(I);
 title('原图像');
 subplot(1,4,2),imshow(abs(L1),[]);
 title('Laplacian锐化图像');
 subplot(1,4,3),imshow(abs(L3),[]);
 title('LoG处理后图像,σ=0.5');
 subplot(1,4,4),imshow(abs(L5),[]);
 title('LoG处理后图像,σ=2');
- 1
- 2
- 3
- 4
- 5
- 6
- 7
- 8
- 9
- 10
- 11
- 12
- 13
- 14
- 15
- 16
- 17


