
热门标签
热门文章
- 1基于PPYOLOE+的水下生物目标检测_为什么要做水下显著目标检测
- 2vue2 百度地图点聚合_vue2 百度地图实现点聚合
- 3月入8.3k,新传文科生转行5G网络优化工程师,张雪峰:这专业,报考就打晕…
- 4信息安全人才这么受欢迎,为何从业者这么少?_信息安全从业者的低替代性
- 5Android Camera相机以及相机程序开发实例_android.hardware.camera 例程
- 6c#执行php,致PHP程序员:快速执行C#代码片段 快速运行C#代码 调试C# C#写人文件操作...
- 7ros源码分析(三)ros::spin( )背后发生的事_couldn't register subscriber on topic [/]
- 8数据库分页大全
- 9微信小程序登录后端
- 10小程序可以通过以下几种方式下发消息_小程序怎么给用户推送消息
当前位置: article > 正文
2024美赛数学建模C题思路&源码
作者:程序性能提升者 | 2024-02-02 14:40:40
赞
踩
2024美赛数学建模C题思路&源码
这题挺有意思,没具体看比赛情况,打过比赛的人应该都知道险胜局(第二局、第五局逆转局)最影响心态的,导致第3、5局输了
模型结果证明这样的现象,会更可靠
赛题目的
赛题目的:分析球员的表现
问题一.
问题分析
- excel数据:每个时间段有16场比赛,同一组有5个时间段的5场比赛
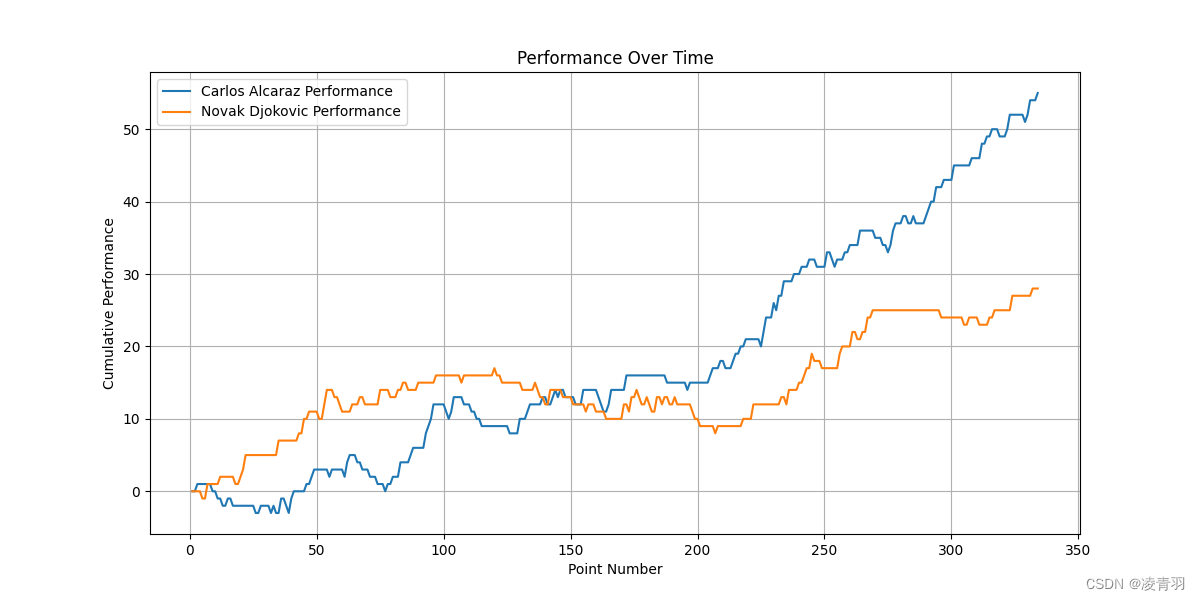
为了建立球员在比赛特定时间表现力的模型,我们需要根据提供的数据选择一些关键因素来评估球员表现。我们可以选择如下几个因素:
- 得分情况(p1_score, p2_score)
- 得分胜者(point_victor)
- 制胜分(p1_winner, p2_winner)
- 非受迫性失误(p1_unf_err, p2_unf_err)
- 发球得分(p1_ace, p2_ace)
- 上网得分(p1_net_pt_won, p2_net_pt_won)、
- 破发点和破发成功(p1_break_pt, p2_break_pt, p1_break_pt_won, p2_break_pt_won)等。
问题解答
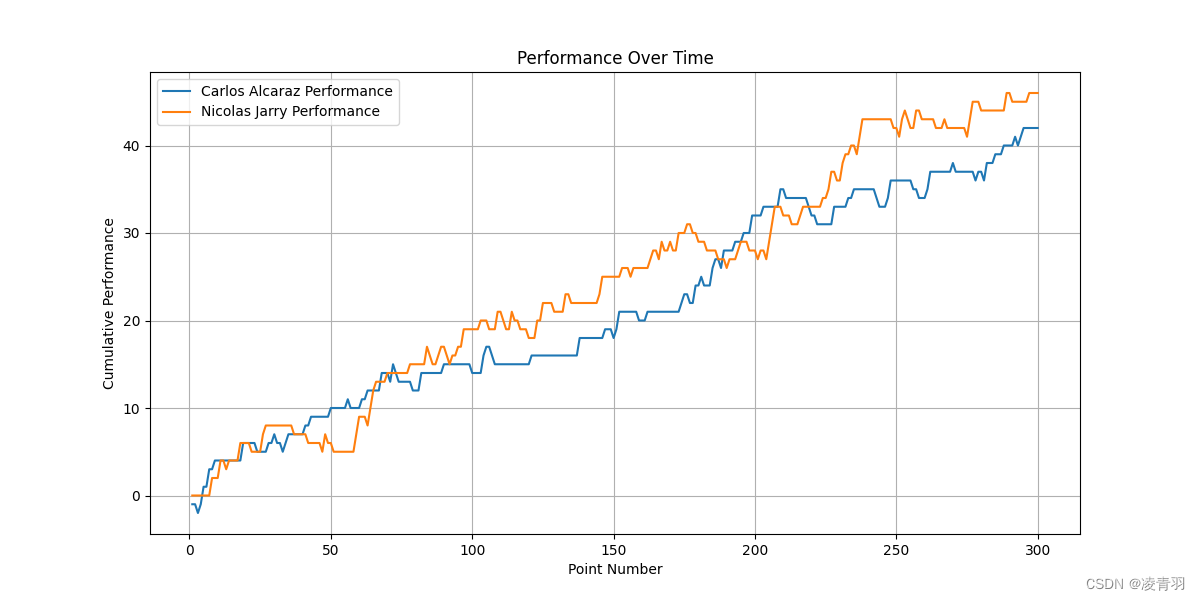
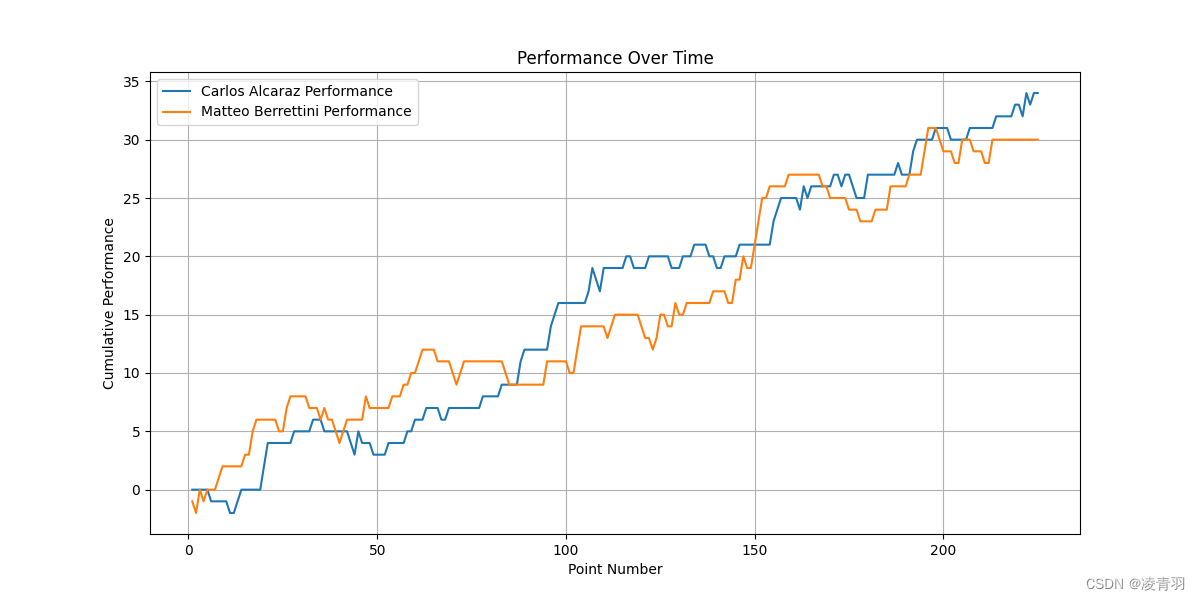
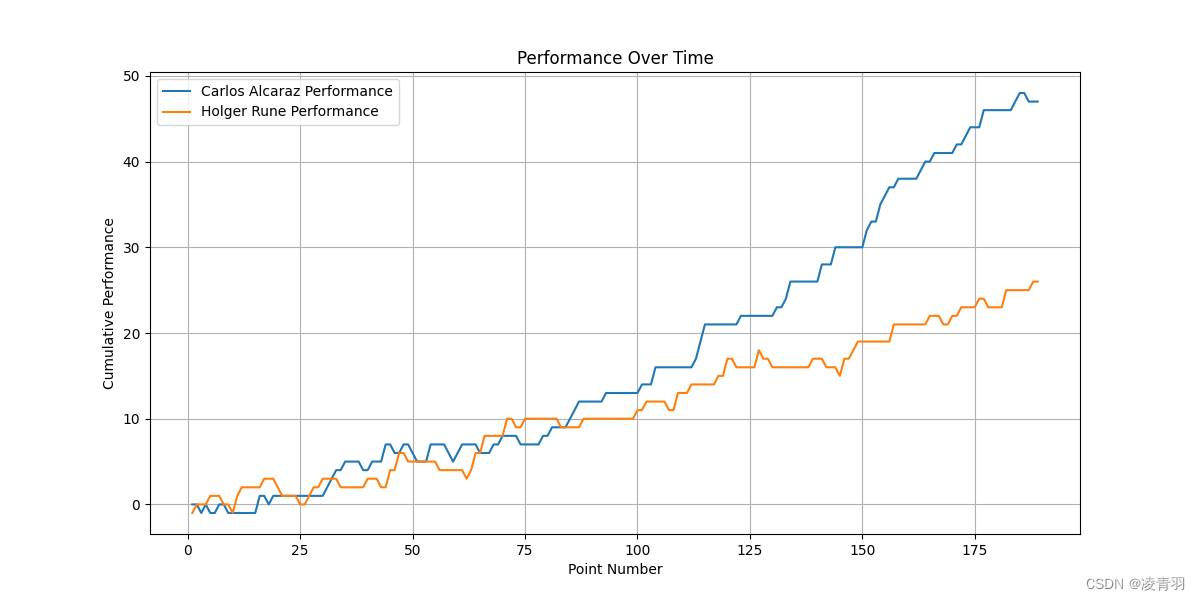
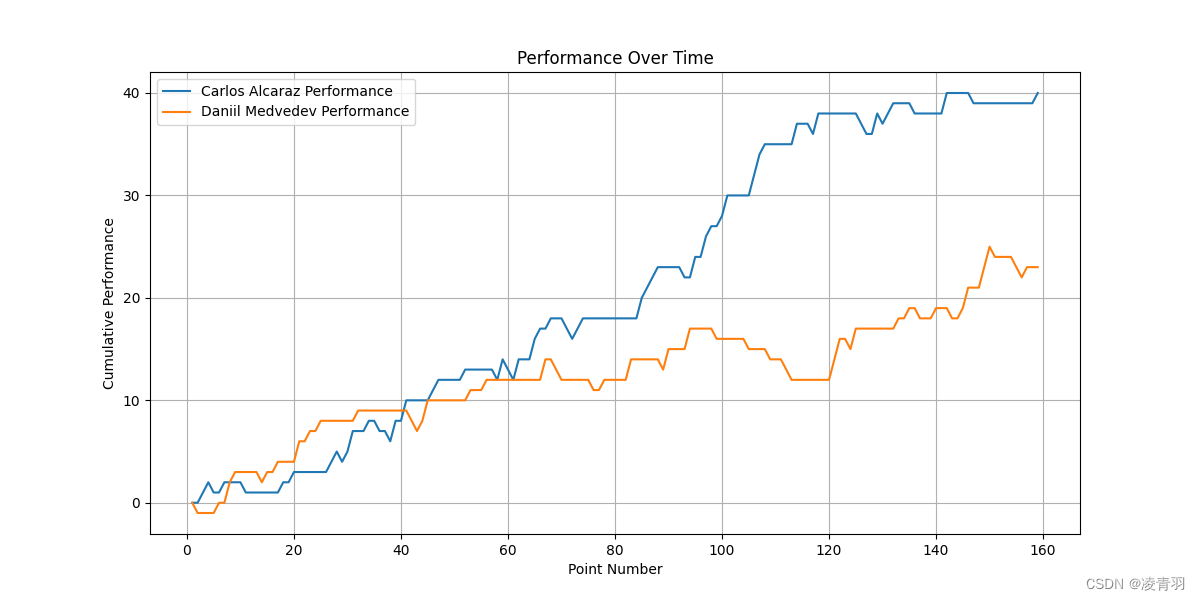
import pandas as pd
import matplotlib.pyplot as plt
import numpy as np

# 读取数据
df = pd.read_csv('Problem_C_Wimbledon_featured_matches.csv')


# # 筛选以 "2023-wimbledon-13" 开头的 match_id
# df_filtered = df[df['match_id'].str.startswith('2023-wimbledon-13')]
# # 获取唯一的 match_id 并转换为列表
# match_ids = df_filtered['match_id'].unique().tolist()


# for match_id in match_ids:
for match_id in ["2023-wimbledon-1301", "2023-wimbledon-1401", "2023-wimbledon-1501", "2023-wimbledon-1601", "2023-wimbledon-1701"]:
    # 选择特定的比赛
    df_match = df[df['match_id'] == match_id]
    # 计算每个球员的表现力
    df_match['p1_performance'] = df_match['p1_ace'] + df_match['p1_winner'] - df_match['p1_unf_err'] + df_match['p1_net_pt_won']
    df_match['p2_performance'] = df_match['p2_ace'] + df_match['p2_winner'] - df_match['p2_unf_err'] + df_match['p2_net_pt_won']
    # 累计表现力
    df_match['p1_performance_cum'] = df_match['p1_performance'].cumsum()
    df_match['p2_performance_cum'] = df_match['p2_performance'].cumsum()

    # 绘制球员表现力变化趋势图
    plt.figure(figsize=(12, 6))
    plt.plot(df_match['point_no'], df_match['p1_performance_cum'], label=df_match['player1'].iloc[0] + ' Performance')
    plt.plot(df_match['point_no'], df_match['p2_performance_cum'], label=df_match['player2'].iloc[0] + ' Performance')

    # 设置图表标题和标签
    plt.title('Performance Over Time')
    plt.xlabel('Point Number')
    plt.ylabel('Cumulative Performance')
    plt.legend()
    plt.grid(True)

    # 保存球员表现力变化趋势图
    plt.savefig('performance_over_time_{}.png'.format(match_id))

    # 绘制比赛得分情况图
    plt.figure(figsize=(12, 6))
    plt.plot(df_match['point_no'], df_match['p1_points_won'].cumsum(), label=df_match['player1'].iloc[0] + ' Points Won')
    plt.plot(df_match['point_no'], df_match['p2_points_won'].cumsum(), label=df_match['player2'].iloc[0] + ' Points Won')

    # 设置图表标题和标签
    plt.title('Points Won Over Time')
    plt.xlabel('Point Number')
    plt.ylabel('Cumulative Points Won')
    plt.legend()
    plt.grid(True)

    # 保存比赛得分情况图
    plt.savefig('points_won_over_time_{}.png'.format(match_id))
    plt.close()

- 1
- 2
- 3
- 4
- 5
- 6
- 7
- 8
- 9
- 10
- 11
- 12
- 13
- 14
- 15
- 16
- 17
- 18
- 19
- 20
- 21
- 22
- 23
- 24
- 25
- 26
- 27
- 28
- 29
- 30
- 31
- 32
- 33
- 34
- 35
- 36
- 37
- 38
- 39
- 40
- 41
- 42
- 43
- 44
- 45
- 46
- 47
- 48
- 49
- 50
- 51
- 52
- 53
- 54
- 55
- 56
- 1301
- 1401
- 1501
- 1601
- 1701
问题二.
问题分析
问题解答
问题三.
问题分析
问题解答
问题四.
问题分析
问题解答
问题五.
问题分析
问题解答
赛题翻译


声明:本文内容由网友自发贡献,不代表【wpsshop博客】立场,版权归原作者所有,本站不承担相应法律责任。如您发现有侵权的内容,请联系我们。转载请注明出处:https://www.wpsshop.cn/article/detail/55577
推荐阅读
相关标签

