
热门标签
热门文章
- 1[AIGC] Nginx:一个高性能的 Web 服务器和反向代理
- 2【Python小程序】红红火火过大年,(代码)巧手编织中国结,分分钟那惊艳你哦~_弘扬中华优秀传统文化编程
- 3【AI实战】开源可商用的中英文大语言模型baichuan-7B,从零开始搭建_baichuan-7b本地部署
- 4c++ Eigen矩阵-基础知识_eigen 转置
- 5人工智能助力药物研发(AI制药综述论文)_utilizing reinforcement learning for de novo drug
- 6Heat入门第一步_heat stack
- 7python 运行linux命令_python脚本内运行linux命令的方法
- 8pythonpath环境变量-python 环境变量设置PYTHONPATH
- 9Spring Security OAuth2.0(五)-----OAuth2实现自定义统一认证登录页/自定义授权页/基于mysql存储数据_oauth2 自定义授权页面
- 10codeforces的polygon平台使用指北_codeforces polygon
当前位置: article > 正文
leaflet基本使用_leaflet中文文档
作者:程序代码艺术家 | 2024-01-01 15:46:09
赞
踩
leaflet中文文档
leaflet:一个开源并且对移动端友好的交互式地图 JavaScript 库
中文文档:https://leafletjs.cn/reference.html
官网(英文):https://iclient.supermap.io/examples/leaflet/examples.html#iServer
该项目基于vue3+ts搭建
项目地址 gitee:https://gitee.com/philippines-kisses-snow/leaflet-map
项目预览:http://116.204.74.170/leaflet/
地图组成与名词解释
建议在学习之前先了解一些相关名词,以便理解:
高德官网的名词解释:https://lbs.amap.com/api/javascript-api/guide/abc/components
效果:
下载库:
npm i leaflet
- 1
引入css:
// main.ts
import "leaflet/dist/leaflet.css"
- 1
- 2
在组件中使用leaflet:
- 引入:
import L from 'leaflet'
- 1
若引入时leaflet没有类型文件报错,需在.d.ts文件中加入:
// shims-vue.d.ts
declare module 'leaflet';
- 1
- 2
- 添加HTML地图节点,节点需要有宽高
<div id="map"></div>
- 1
- 初始化:
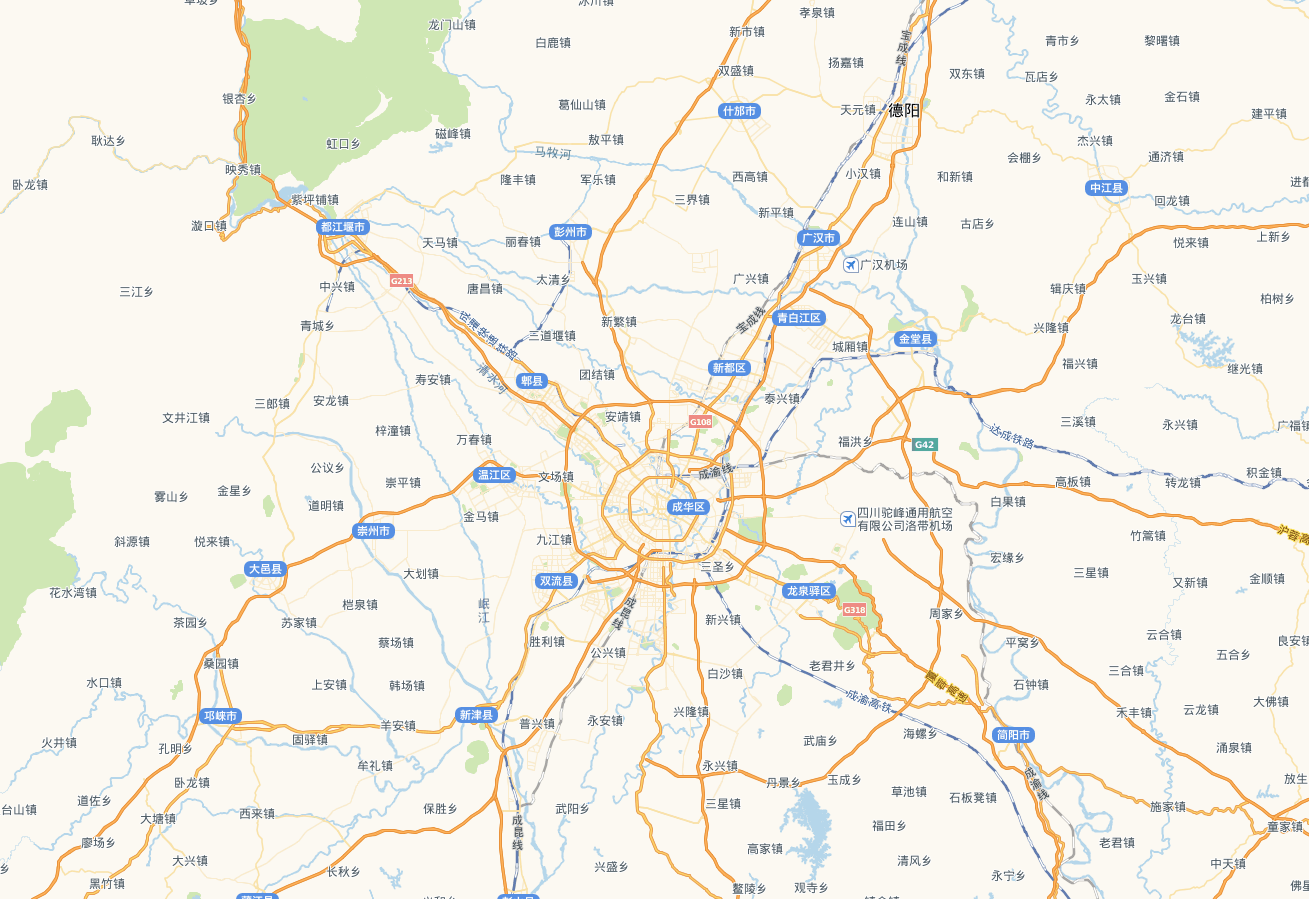
import { onMounted } from 'vue';

/*
 * layer: 地图切片地址,用于显示地图,该切片地址为高德地图使用的地址
 * 具体出处在高德官网并未找到,从相关博客推测可能是某个大佬抓包或其他方式获取到的
 * 相关博客:https://blog.csdn.net/fredricen/article/details/77189453
 */
const layer = L.tileLayer('http://webrd01.is.autonavi.com/appmaptile?lang=zh_cn&size=1&scale=1&style=7&x={x}&y={y}&z={z}')
let map: any = {}

onMounted(() => {
  // 'map'为HTML节点id
  map = L.map('map', {
    center: [30.745922638363268, 104.00415658374735],//中心坐标
    zoom: 10,//缩放级别
    zoomControl: true, //缩放组件
    attributionControl: false, //去掉右下角logol
    layers: [layer],//图层
  })
})

- 1
- 2
- 3
- 4
- 5
- 6
- 7
- 8
- 9
- 10
- 11
- 12
- 13
- 14
- 15
- 16
- 17
- 18
- 19
- 20
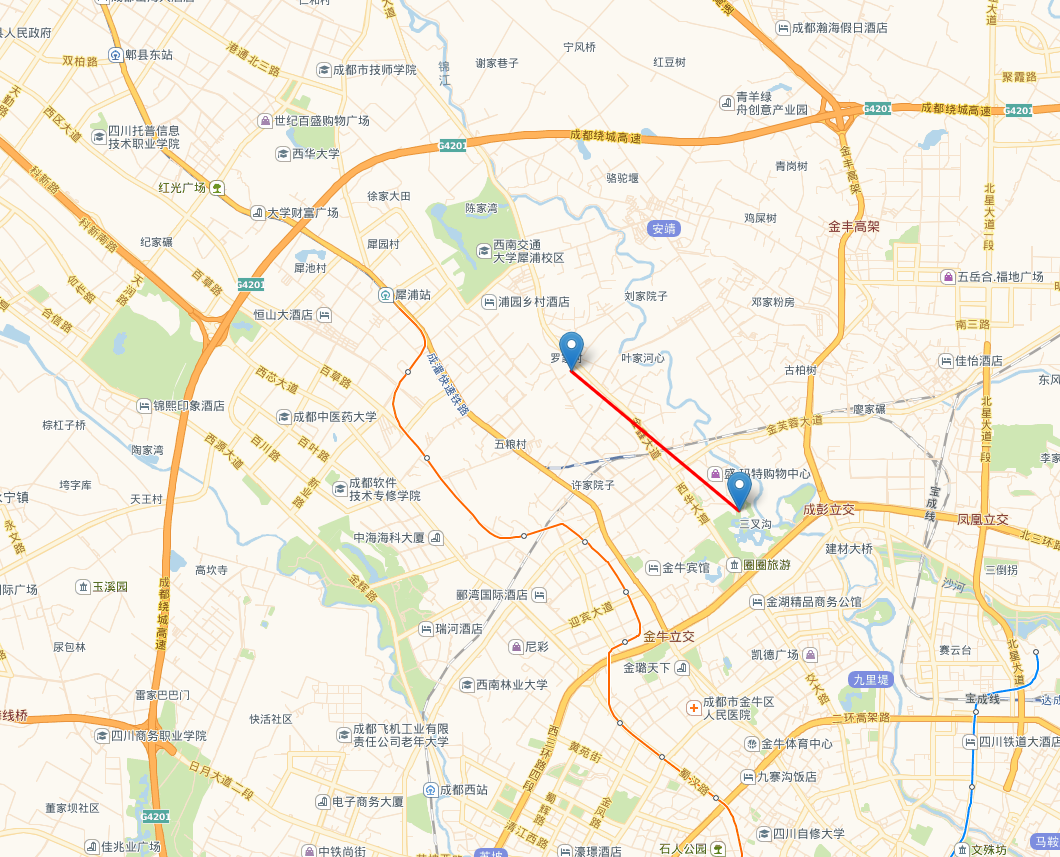
效果:
- 将地图点位到指定点,并放大16倍(可显示街道)
map.setView([30.745922638363268, 104.00415658374735], 16)
- 1
效果:
5. 添加标记
(1)直接添加,官网当中是直接建立一个标记,并添加到地图(不推荐,不好管理)
L.marker([50.5, 30.5]).addTo(map);
- 1
(2)添加一个要素组,将标记添加到要素组里面管理(推荐)
// 添加标记组
let featureGroup: any = {}
featureGroup = L.featureGroup().addTo(map)

// 设置标记点:[纬度, 经度]
const marker = L.marker([30.745922638363268, 104.00415658374735])
featureGroup.addLayer(marker)
- 1
- 2
- 3
- 4
- 5
- 6
- 7
若标记后报错:
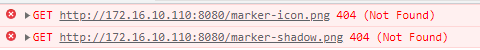
在引入时还需要独引入图片并更改默认Icon:
import L from 'leaflet'

// 图片
import _ICON from 'leaflet/dist/images/marker-icon.png';
import _ICONSHADOW from 'leaflet/dist/images/marker-shadow.png';
/*
 * 测试过几组数据,当使用自定义icon时,若不配置iconSize、iconAnchor,图标会在放大地图时位置发送偏移
 * iconAnchor:图标 "tip" 的坐标(相对于其左上角),该值大致为:[iconSize宽的一半,iconSize高]
 * iconAnchor需要在配置iconSize之后才会生效
 * popupAnchor:标记的弹出框的位置(使用默认弹出框时需要
 * popupAnchor若不配置,则默认为经纬度位置,会遮盖标记图标,-50表示将弹出框相对于经纬度位置向上移动50px
 */
let _L_DEFAULT_ICON = L.icon({
    iconUrl: _ICON,
    shadowUrl: _ICONSHADOW,
    iconSize: [25, 41],
    iconAnchor: [12, 40],
    popupAnchor: [0, -50]
});
L.Marker.prototype.options.icon = _L_DEFAULT_ICON
- 1
- 2
- 3
- 4
- 5
- 6
- 7
- 8
- 9
- 10
- 11
- 12
- 13
- 14
- 15
- 16
- 17
- 18
- 19
- 20
(3)给标记添加事件与弹出框-bindPopup(只支持简单添加)
// 给标记添加事件
marker.on('click', () => { })
// 给标记添加弹出框
marker.bindPopup('弹出内容').openPopup();
- 1
- 2
- 3
- 4
(4)给标记添加事件与弹出框-popup(高级用法)
marker.on('click', () => {
    // 可在点击标记后发起请求,请求成功后弹出框显示请求内容
    // 创建弹出框:弹出框默认从经纬度位置弹出,会遮盖图标,可使用offset设置偏移量:[x轴偏移量, y轴偏移量]
    L.popup({ offset: [0, -50] })
      .setLatLng(marker.getLatLng()) //设置弹出框弹出位置
      .setContent('请求内容')
      .openOn(map);
})
- 1
- 2
- 3
- 4
- 5
- 6
- 7
- 8
- 清除标记
if(featureGroup) featureGroup.clearLayers();
- 1
- 添加连线
// 再添加一个要素组,要素组可存在多个
let lineFeatureGroup: any = {}
lineFeatureGroup = L.featureGroup().addTo(map)
const locations = [
  [30.745922638363268, 104.00415658374735],
  [30.725309888823382, 104.03297424316408]
]

var polyline = L.polyline(locations, {color: 'red'}).addTo(map);
lineFeatureGroup.addLayer(polyline)
- 1
- 2
- 3
- 4
- 5
- 6
- 7
- 8
- 9
- 10
- 清除连线
if(lineFeatureGroup) lineFeatureGroup.clearLayers();
- 1
完整demo代码(代码已上传gitee)
<template>
  <div class="hello">
    <div id="map"></div>
    <div class="controls">
      <div class="fc">
        地图点击:
        <input type="radio" name="mapclick" :value="1" v-model="mapClick">开
        <input class="ml15" type="radio" name="mapclick" :value="0" v-model="mapClick">关
      </div>
    </div>
  </div>
</template>

<script setup lang="ts">
import L from 'leaflet'
import { onMounted, ref } from 'vue';

import _ICON from 'leaflet/dist/images/marker-icon.png';
import _ICONSHADOW from 'leaflet/dist/images/marker-shadow.png';
/*
 * 测试过几组数据,当使用自定义icon时,若不配置iconSize、iconAnchor,图标会在放大地图时位置发送偏移
 * iconAnchor:图标 "tip" 的坐标(相对于其左上角),该值大致为:[iconSize宽的一半,iconSize高]
 * iconAnchor需要在配置iconSize之后才会生效
 * popupAnchor:标记的弹出框的位置(使用默认弹出框时需要
 * popupAnchor若不配置,则默认为经纬度位置,会遮盖标记图标,-50表示将弹出框相对于经纬度位置向上移动50px
 */
let _L_DEFAULT_ICON = L.icon({
    iconUrl: _ICON,
    shadowUrl: _ICONSHADOW,
    iconSize: [25, 41],
    iconAnchor: [12, 40],
    popupAnchor: [0, -50]
});
L.Marker.prototype.options.icon = _L_DEFAULT_ICON

const locations = [[30.745922638363268, 104.00415658374735], [30.725309888823382, 104.03297424316408]]
const layer = L.tileLayer('http://webrd01.is.autonavi.com/appmaptile?lang=zh_cn&size=1&scale=1&style=7&x={x}&y={y}&z={z}')
const mapClick = ref(1)

let map: any = {}
let featureGroup: any = {}
let lineFeatureGroup: any = {}

onMounted(() => {
  // 初始化地图
  map = L.map('map', {
    center: [30.745922638363268, 104.00415658374735],//中心坐标
    zoom: 10,//缩放级别
    zoomControl: true, //缩放组件
    attributionControl: false, //去掉右下角logol
    layers: [layer],//图层
  })
  // 将视图点位到指定点,并放大16倍
  map.setView([30.745922638363268, 104.00415658374735], 16)
  // 地图点击
  map.on('click', (e: any) => {
    if(mapClick.value) {
      const latlng = e.latlng
      locations.push([latlng.lat, latlng.lng])
      // 清除要素
      if(featureGroup) featureGroup.clearLayers();
      locations.forEach(item => {
        point(item)
      })
    }
  })
  // 添加地图要素组
  featureGroup = L.featureGroup().addTo(map)
  lineFeatureGroup = L.featureGroup().addTo(map)
  // 设置初始打点
  locations.forEach(item => {
    point(item)
  })

  setPolyLine()
})

const point = (arr: number[]) => {
  // 设置点标记:[纬度, 经度]
  const marker = L.marker(arr)
  // 给标记添加事件
  marker.on('click', () => {
    // 创建弹出框:弹出框默认从经纬度位置弹出,会遮盖图标,可使用offset设置偏移量:[x轴偏移量, y轴偏移量]
    L.popup({ offset: [0, -50] })
      .setLatLng(marker.getLatLng())
      .setContent(arr[0] + ': ' + arr[1])
      .openOn(map);
  })
  // 将标记添加到要素组
  featureGroup.addLayer(marker)
}

const setPolyLine = () => {
  var polyline = L.polyline([locations[0], locations[1]], {color: 'red'}).addTo(map);
  lineFeatureGroup.addLayer(polyline)
}
</script>

<style scoped>
.hello, #map {
  height: 100%;
  width: 100%;
}

.hello {
  position: relative;
}

.controls {
  position: absolute;
  right: 0;
  top: 0;
  padding: 15px;
  z-index: 1000;

  font-size: 14px;
  background-color: #fff;
}

.fc {
  display: flex;
  align-items: center;
}

.ml15 {
  margin-left: 15px;
}

.mr15 {
  margin-right: 15px;
}
</style>
- 1
- 2
- 3
- 4
- 5
- 6
- 7
- 8
- 9
- 10
- 11
- 12
- 13
- 14
- 15
- 16
- 17
- 18
- 19
- 20
- 21
- 22
- 23
- 24
- 25
- 26
- 27
- 28
- 29
- 30
- 31
- 32
- 33
- 34
- 35
- 36
- 37
- 38
- 39
- 40
- 41
- 42
- 43
- 44
- 45
- 46
- 47
- 48
- 49
- 50
- 51
- 52
- 53
- 54
- 55
- 56
- 57
- 58
- 59
- 60
- 61
- 62
- 63
- 64
- 65
- 66
- 67
- 68
- 69
- 70
- 71
- 72
- 73
- 74
- 75
- 76
- 77
- 78
- 79
- 80
- 81
- 82
- 83
- 84
- 85
- 86
- 87
- 88
- 89
- 90
- 91
- 92
- 93
- 94
- 95
- 96
- 97
- 98
- 99
- 100
- 101
- 102
- 103
- 104
- 105
- 106
- 107
- 108
- 109
- 110
- 111
- 112
- 113
- 114
- 115
- 116
- 117
- 118
- 119
- 120
- 121
- 122
- 123
- 124
- 125
- 126
- 127
- 128
- 129
- 130
- 131
- 132
- 133
声明:本文内容由网友自发贡献,不代表【wpsshop博客】立场,版权归原作者所有,本站不承担相应法律责任。如您发现有侵权的内容,请联系我们。转载请注明出处:https://www.wpsshop.cn/blog/article/detail/37332
推荐阅读
- 文章浏览阅读7k次,点赞52次,收藏57次。通过前面的文章我们可以知道基于区块链开发一个DApp,而DApp结合了智能合约和用户界面(客户端),那客户端是如何与区块链进行连接交互的、如何调用智能合约的、如何发送一个交易到区块链、如何获取区块... [详细]
赞
踩
- 文章浏览阅读2.3k次,点赞32次,收藏29次。错误处理和调试是编程中的重要部分。通过理解和使用语句、函数、开发者工具和debugger语句,我们可以更有效地找到和修复代码中的错误。在接下来的章节中,我们将深入学习更多关于JavaScrip... [详细]
赞
踩
- article
[HTML]Web前端开发技术3(HTML5、CSS3、JavaScript )超链接,target,scrolling,marginwidth,frameborder,iframe——喵喵画网页
文章浏览阅读1.9k次,点赞128次,收藏115次。超链接标签超链接路径相对路径的用法超链接分类超链接的应用超链接的分类创建HTTP文件下载超链接创建FTP站点访问超链接创建图像链接创建电子邮件超链接创建页面书签链接浮动框架制作浮动框架页面... [详细]赞
踩
- 文章浏览阅读5.7k次,点赞121次,收藏103次。主要内容涵盖ES2015~ES2020中JavaScript的所有新特性以及下一版的预览。探索新的语法:空值合并、可选链、let和const、类语法、私有方法、私有字段、new.targe... [详细]
赞
踩
- 通过前面的文章我们可以知道基于区块链开发一个DApp,而DApp结合了智能合约和用户界面(客户端),那客户端是如何与区块链进行连接交互的、如何调用智能合约的、如何发送一个交易到区块链、如何获取区块链上的数据,这就是本文要介绍的web3.js... [详细]
赞
踩
相关标签

