
热门标签
热门文章
- 1【吴恩达deeplearning.ai】基于LangChain开发大语言应用模型(上)_openai.chatcompletion.create structured output par
- 2RC522(RFID模块)实践总结
- 3【Leetcode】1686. 石子游戏 VI
- 4使用Vue.js时,如何删除ESLint?_vue删除eslint
- 5关闭vscode打开的本地服务器端口_vscode总是使用代理的端口,怎么删除?
- 6PyCharm Community安装与配置
- 7undefined symbol: avio_protocol_get_class, version LIBAVFORMAT_58
- 8浏览器辅助神器:油猴脚本使用教程
- 9爱丁堡计算机专业硕士世界排名,爱丁堡大学计算机世界排名
- 10【uniapp】多端(H5和微信小程序)_uniapp区分小程序和h5
当前位置: article > 正文
十、Qt三维图表
作者:键盘狂人 | 2024-02-03 15:58:51
赞
踩
十、Qt三维图表
一、Data Visualization模块概述
Data Visualization的三维显示功能主要有三种三维图形来实现,三各类的父类都是QAbstract3DGraph,从QWindow继承而来。这三类分别是:
- 1
- 三维柱状图Q3DBar
- 三维空间散点Q3DScatter
- 三维曲面Q3DSurface
1、相关类的继承关系
(1)图形类
QWindow
	QAbstract3DGraph
		Q3DBar
		Q3DScatter
		Q3DSurface
- 1
- 2
- 3
- 4
- 5
(2)数据序列类
QAbstract3DSeries
	QBar3DSeries
	QScatter3DSeries
	QSurface3DSeries
- 1
- 2
- 3
- 4
(3)轴类
QAbstract3DAxis
	QCategory3DAxis
	QValue3DAxis
- 1
- 2
- 3
(4)数据代理类
数据代理类与序列对应,用于存储序列的数据的类。
- 1
QAbstractDataProxy
	QBarDataProxy
		QItemModelBarDataProxy
	QScatterDataProxy
		QItemModelScatterDataProxy
	QSurfaceDataProxy
		QHeightMapSurfaceDataProxy
		QItemModelSurfaceDataProxy
- 1
- 2
- 3
- 4
- 5
- 6
- 7
- 8
2、使用方法
(1)工程添加
QT += datavisualization
- 1
(2)代码中添加头文件与命名空间
#include <QtDataVisualization>
using namespace QtDataVisualization;
- 1
- 2
二、三维柱状图
1、实现程序
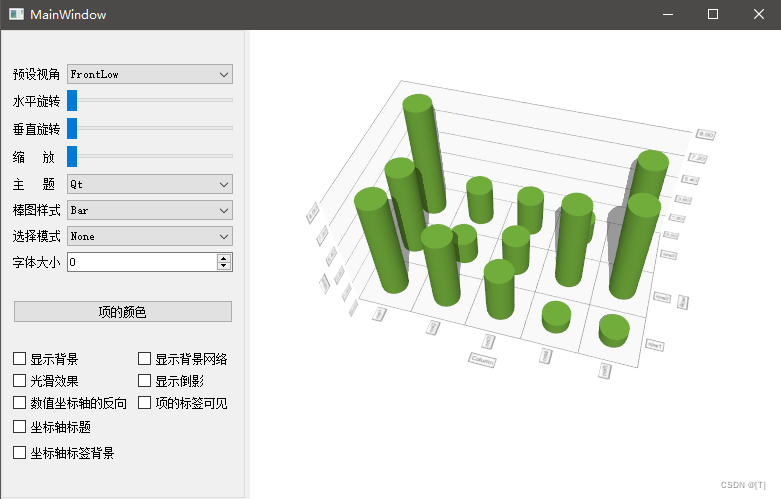
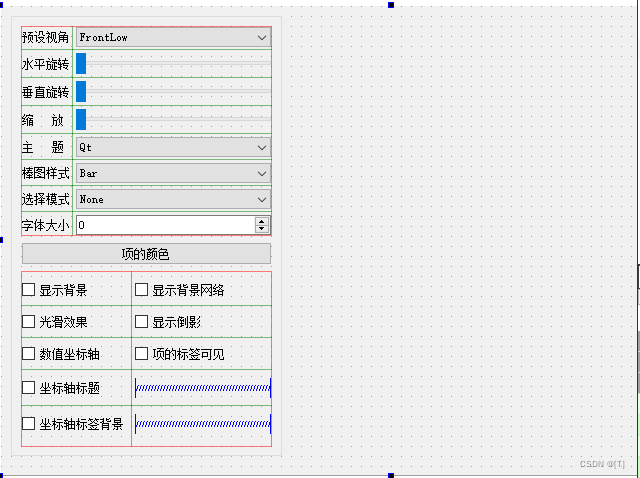
(1)创建项目,基于QMainWindow
(2)添加组件
(3)初始化
MainWindow::MainWindow(QWidget *parent) :
    QMainWindow(parent),
    ui(new Ui::MainWindow)
{
    ui->setupUi(this);

    QSplitter *splitter = new QSplitter(Qt::Horizontal);
    splitter->addWidget(ui->groupBox);


    initGraph3D();
    splitter->addWidget(createWindowContainer(graph3D));
    setCentralWidget(splitter);
}

MainWindow::~MainWindow()
{
    delete ui;
}

void MainWindow::initGraph3D()
{
    graph3D = new Q3DBars;

    // 创建坐标系统
    QStringList rowLabs, colLabs;
    rowLabs << "row1" << "row2" << "row3";
    colLabs << "col1" << "col2" << "col3" << "col4" << "col5";

    QValue3DAxis *axisV = new QValue3DAxis;
    axisV->setTitle("Value");
    axisV->setTitleVisible(true);

    QCategory3DAxis * axisCol = new QCategory3DAxis;
    axisCol->setTitle("Column");
    axisCol->setTitleVisible(true);
    axisCol->setLabels(colLabs);

    QCategory3DAxis * axisRow = new QCategory3DAxis;
    axisRow->setTitle("Row");
    axisRow->setTitleVisible(true);
    axisRow->setLabels(rowLabs);

    graph3D->setValueAxis(axisV);
    graph3D->setColumnAxis(axisCol);
    graph3D->setRowAxis(axisRow);

    // 创建数据序列
    QBar3DSeries *series = new QBar3DSeries;
    series->setMesh(QAbstract3DSeries::MeshCylinder); // 形状
    series->setItemLabelFormat("(@rowLabel,@colLabel):%.1f");

    // 添加数据
    QBarDataArray *dataArray = new QBarDataArray;
    dataArray->reserve(rowLabs.count()); // 三行数据

    qsrand(QTime::currentTime().second());

    for (int i = 0; i < rowLabs.count(); ++i)
    {
        QBarDataRow *dataRow = new QBarDataRow;

        for (int j = 0; j < 5; ++j)
        {
            (*dataRow) << (qrand() % 10);
        }

        dataArray->append(dataRow);
    }

    series->dataProxy()->resetArray(dataArray);
    graph3D->addSeries(series);
}
- 1
- 2
- 3
- 4
- 5
- 6
- 7
- 8
- 9
- 10
- 11
- 12
- 13
- 14
- 15
- 16
- 17
- 18
- 19
- 20
- 21
- 22
- 23
- 24
- 25
- 26
- 27
- 28
- 29
- 30
- 31
- 32
- 33
- 34
- 35
- 36
- 37
- 38
- 39
- 40
- 41
- 42
- 43
- 44
- 45
- 46
- 47
- 48
- 49
- 50
- 51
- 52
- 53
- 54
- 55
- 56
- 57
- 58
- 59
- 60
- 61
- 62
- 63
- 64
- 65
- 66
- 67
- 68
- 69
- 70
- 71
- 72
- 73
(4)实现功能
void MainWindow::on_cboxCarmera_currentIndexChanged(int index)
{
graph3D->scene()->activeCamera()->setCameraPreset(Q3DCamera::CameraPreset(index));
}
void MainWindow::on_hSliderLevel_valueChanged(int value)
{
Q_UNUSED(value);
int xRot = ui->hSliderLevel->value();
int yRot = ui->hSliderVertical->value();
int zoom = ui->hSliderScale->value();
graph3D->scene()->activeCamera()->setCameraPosition(xRot, yRot, zoom);
}
void MainWindow::on_hSliderVertical_valueChanged(int value)
{
Q_UNUSED(value);
int xRot = ui->hSliderLevel->value();
int yRot = ui->hSliderVertical->value();
int zoom = ui->hSliderScale->value();
graph3D->scene()->activeCamera()->setCameraPosition(xRot, yRot, zoom);
}
void MainWindow::on_hSliderScale_valueChanged(int value)
{
Q_UNUSED(value);
int xRot = ui->hSliderLevel->value();
int yRot = ui->hSliderVertical->value();
int zoom = ui->hSliderScale->value();
graph3D->scene()->activeCamera()->setCameraPosition(xRot, yRot, zoom);
}
void MainWindow::on_cboxTheme_currentIndexChanged(int index)
{
graph3D->activeTheme()->setType(Q3DTheme::Theme(index));
}
void MainWindow::on_cboxStyle_currentIndexChanged(int index)
{
QBar3DSeries *series = graph3D->seriesList().at(0);
series->setMesh(QAbstract3DSeries::Mesh(index));
}
void MainWindow::on_cboxMode_currentIndexChanged(int index)
{
graph3D->setSelectionMode(QAbstract3DGraph::SelectionFlags(index));
}
void MainWindow::on_spinBoxFontSize_valueChanged(int arg1)
{
QFont font = graph3D->activeTheme()->font();
font.setPointSize(arg1);
graph3D->activeTheme()->setFont(font);
}
#include <QColorDialog>
void MainWindow::on_btnItemColor_clicked()
{
QBar3DSeries *series = graph3D->seriesList().at(0);
QColor color = series->baseColor();
color = QColorDialog::getColor(color);
if(color.isValid())
{
series->setBaseColor(color);
}
}
void MainWindow::on_checkBoxBack_clicked(bool checked)
{
graph3D->activeTheme()->setBackgroundEnabled(checked);
}
void MainWindow::on_checkBoxBackNetwork_clicked(bool checked)
{
graph3D->activeTheme()->setGridEnabled(checked);
}
void MainWindow::on_checkBoxSmooth_clicked(bool checked)
{
QBar3DSeries *series = graph3D->seriesList().at(0);
series->setMeshSmooth(checked);
}
void MainWindow::on_checkBoxReflection_clicked(bool checked)
{
graph3D->setReflection(checked);
}
void MainWindow::on_checkBoxValueAxis_clicked(bool checked)
{
graph3D->valueAxis()->setReversed(checked);
}
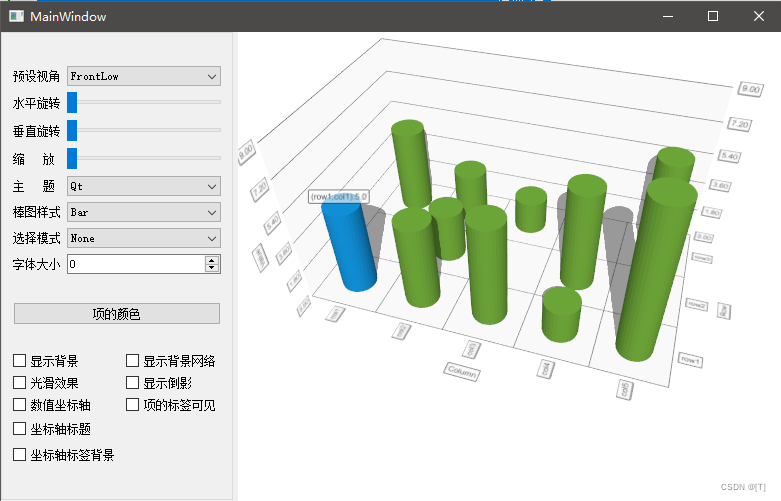
void MainWindow::on_checkBoxItemLabel_clicked(bool checked)
{
QBar3DSeries *series = graph3D->seriesList().at(0);
series->setItemLabelVisible(checked);
}
void MainWindow::on_checkBoxAxisBack_clicked(bool checked)
{
graph3D->valueAxis()->setTitleVisible(checked);
graph3D->rowAxis()->setTitleVisible(checked);
graph3D->columnAxis()->setTitleVisible(checked);
}
void MainWindow::on_checkBoxAxisLabelBack_clicked(bool checked)
{
graph3D->activeTheme()->setLabelBackgroundEnabled(checked);
}
- 1
- 2
- 3
- 4
- 5
- 6
- 7
- 8
- 9
- 10
- 11
- 12
- 13
- 14
- 15
- 16
- 17
- 18
- 19
- 20
- 21
- 22
- 23
- 24
- 25
- 26
- 27
- 28
- 29
- 30
- 31
- 32
- 33
- 34
- 35
- 36
- 37
- 38
- 39
- 40
- 41
- 42
- 43
- 44
- 45
- 46
- 47
- 48
- 49
- 50
- 51
- 52
- 53
- 54
- 55
- 56
- 57
- 58
- 59
- 60
- 61
- 62
- 63
- 64
- 65
- 66
- 67
- 68
- 69
- 70
- 71
- 72
- 73
- 74
- 75
- 76
- 77
- 78
- 79
- 80
- 81
- 82
- 83
- 84
- 85
- 86
- 87
- 88
- 89
- 90
- 91
- 92
- 93
- 94
- 95
- 96
- 97
- 98
- 99
- 100
- 101
- 102
- 103
- 104
- 105
- 106
- 107
- 108
- 109
- 110
- 111
三、三维散点图
1、实现程序
(1)创建项目,基于QMainWindow
(2)实现功能
#include "mainwindow.h"
#include "ui_mainwindow.h"

#include <QSplitter>

MainWindow::MainWindow(QWidget *parent) :
    QMainWindow(parent),
    ui(new Ui::MainWindow)
{
    ui->setupUi(this);

    QSplitter *splitter = new QSplitter(Qt::Horizontal);
    splitter->addWidget(ui->groupBox);


    initGraph3D();
    splitter->addWidget(createWindowContainer(graph3D));
    setCentralWidget(splitter);
}

MainWindow::~MainWindow()
{
    delete ui;
}

void MainWindow::initGraph3D()
{
    graph3D = new Q3DScatter;

    // 创建坐标系统
    graph3D->axisX()->setTitle("X轴");
    graph3D->axisX()->setTitleVisible(true);
    graph3D->axisY()->setTitle("Y轴");
    graph3D->axisY()->setTitleVisible(true);
    graph3D->axisZ()->setTitle("Z轴");
    graph3D->axisZ()->setTitleVisible(true);

    // 创建数据序列
    QScatterDataProxy *porxy = new QScatterDataProxy;
    QScatter3DSeries *series = new QScatter3DSeries(porxy);
    //    series->setMesh(QAbstract3DSeries::MeshCylinder); // 形状
    series->setItemLabelFormat("(@rowLabel,@colLabel):%.1f");
    series->setItemSize(0.2);
    graph3D->addSeries(series);

    // 添加数据
    int N = 41;
    QScatterDataArray *dataArray = new QScatterDataArray;
    dataArray->resize(N * N);
    QScatterDataItem *item = &dataArray->first();


    // 摩西跟草帽算法
    float x, y, z;
    x = -10;
    for (int i = 0; i < N; ++i)
    {
        y = -10;
        for (int j = 1; j <= N; ++j)
        {
            z = qSqrt(x * x + y * y);
            if(z != 0)
            {
                z = 10 * qSin(z) / z;
            }
            else
            {
                z = 10;
            }
            // 图形库的坐标系
            item->setPosition(QVector3D(x, z, y));
            item++;
            y += 0.5;
        }
        x += 0.5;
    }

    series->dataProxy()->resetArray(dataArray);
}

void MainWindow::on_cboxCarmera_currentIndexChanged(int index)
{
    graph3D->scene()->activeCamera()->setCameraPreset(Q3DCamera::CameraPreset(index));
}

void MainWindow::on_hSliderLevel_valueChanged(int value)
{
    Q_UNUSED(value);
    int xRot = ui->hSliderLevel->value();
    int yRot = ui->hSliderVertical->value();
    int zoom = ui->hSliderScale->value();
    graph3D->scene()->activeCamera()->setCameraPosition(xRot, yRot, zoom);
}

void MainWindow::on_hSliderVertical_valueChanged(int value)
{
    Q_UNUSED(value);
    int xRot = ui->hSliderLevel->value();
    int yRot = ui->hSliderVertical->value();
    int zoom = ui->hSliderScale->value();
    graph3D->scene()->activeCamera()->setCameraPosition(xRot, yRot, zoom);
}

void MainWindow::on_hSliderScale_valueChanged(int value)
{
    Q_UNUSED(value);
    int xRot = ui->hSliderLevel->value();
    int yRot = ui->hSliderVertical->value();
    int zoom = ui->hSliderScale->value();
    graph3D->scene()->activeCamera()->setCameraPosition(xRot, yRot, zoom);
}

void MainWindow::on_cboxTheme_currentIndexChanged(int index)
{
    graph3D->activeTheme()->setType(Q3DTheme::Theme(index));
}

void MainWindow::on_cboxStyle_currentIndexChanged(int index)
{
    QScatter3DSeries *series = graph3D->seriesList().at(0);
    series->setMesh(QAbstract3DSeries::Mesh(index));
}

void MainWindow::on_cboxMode_currentIndexChanged(int index)
{
    graph3D->setSelectionMode(QAbstract3DGraph::SelectionFlags(index));
}

void MainWindow::on_spinBoxFontSize_valueChanged(int arg1)
{
    QFont font = graph3D->activeTheme()->font();
    font.setPointSize(arg1);
    graph3D->activeTheme()->setFont(font);
}

#include <QColorDialog>
void MainWindow::on_btnItemColor_clicked()
{
    QScatter3DSeries *series = graph3D->seriesList().at(0);
    QColor color = series->baseColor();
    color = QColorDialog::getColor(color);
    if(color.isValid())
    {
        series->setBaseColor(color);
    }
}

void MainWindow::on_checkBoxBack_clicked(bool checked)
{
    graph3D->activeTheme()->setBackgroundEnabled(checked);
}

void MainWindow::on_checkBoxBackNetwork_clicked(bool checked)
{
    graph3D->activeTheme()->setGridEnabled(checked);
}

void MainWindow::on_checkBoxSmooth_clicked(bool checked)
{
    QScatter3DSeries *series = graph3D->seriesList().at(0);
    series->setMeshSmooth(checked);
}

void MainWindow::on_checkBoxReflection_clicked(bool checked)
{
    graph3D->setReflection(checked);
}

void MainWindow::on_checkBoxValueAxis_clicked(bool checked)
{
    graph3D->axisY()->setReversed(checked);
}

void MainWindow::on_checkBoxItemLabel_clicked(bool checked)
{
    QScatter3DSeries *series = graph3D->seriesList().at(0);
    series->setItemLabelVisible(checked);
}

void MainWindow::on_checkBoxAxisBack_clicked(bool checked)
{
    graph3D->axisY()->setTitleVisible(checked);
    graph3D->axisX()->setTitleVisible(checked);
    graph3D->axisZ()->setTitleVisible(checked);
}

void MainWindow::on_checkBoxAxisLabelBack_clicked(bool checked)
{
    graph3D->activeTheme()->setLabelBackgroundEnabled(checked);
}
- 1
- 2
- 3
- 4
- 5
- 6
- 7
- 8
- 9
- 10
- 11
- 12
- 13
- 14
- 15
- 16
- 17
- 18
- 19
- 20
- 21
- 22
- 23
- 24
- 25
- 26
- 27
- 28
- 29
- 30
- 31
- 32
- 33
- 34
- 35
- 36
- 37
- 38
- 39
- 40
- 41
- 42
- 43
- 44
- 45
- 46
- 47
- 48
- 49
- 50
- 51
- 52
- 53
- 54
- 55
- 56
- 57
- 58
- 59
- 60
- 61
- 62
- 63
- 64
- 65
- 66
- 67
- 68
- 69
- 70
- 71
- 72
- 73
- 74
- 75
- 76
- 77
- 78
- 79
- 80
- 81
- 82
- 83
- 84
- 85
- 86
- 87
- 88
- 89
- 90
- 91
- 92
- 93
- 94
- 95
- 96
- 97
- 98
- 99
- 100
- 101
- 102
- 103
- 104
- 105
- 106
- 107
- 108
- 109
- 110
- 111
- 112
- 113
- 114
- 115
- 116
- 117
- 118
- 119
- 120
- 121
- 122
- 123
- 124
- 125
- 126
- 127
- 128
- 129
- 130
- 131
- 132
- 133
- 134
- 135
- 136
- 137
- 138
- 139
- 140
- 141
- 142
- 143
- 144
- 145
- 146
- 147
- 148
- 149
- 150
- 151
- 152
- 153
- 154
- 155
- 156
- 157
- 158
- 159
- 160
- 161
- 162
- 163
- 164
- 165
- 166
- 167
- 168
- 169
- 170
- 171
- 172
- 173
- 174
- 175
- 176
- 177
- 178
- 179
- 180
- 181
- 182
- 183
- 184
- 185
- 186
- 187
- 188
- 189
- 190
四、三维曲面图
1、实现程序
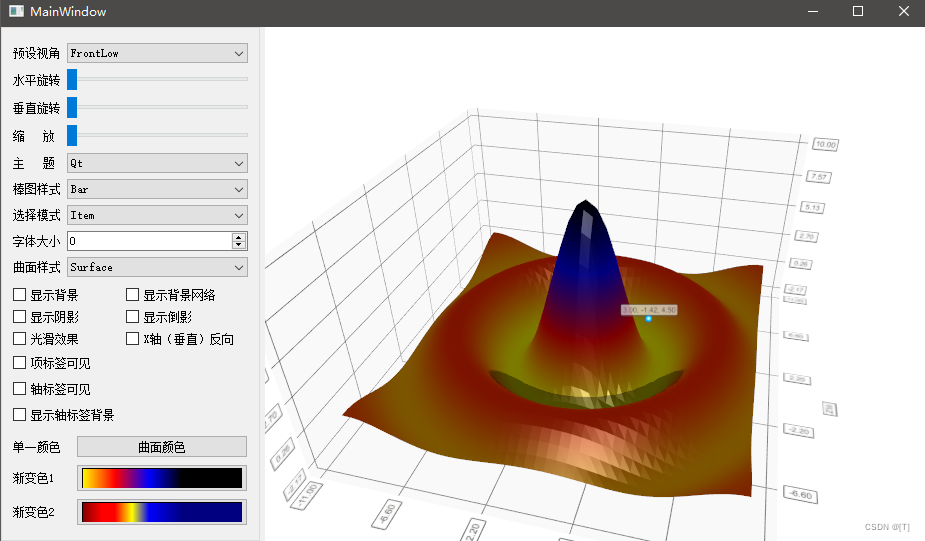
(1)创建项目,基于QMainWindow
(2)添加组件
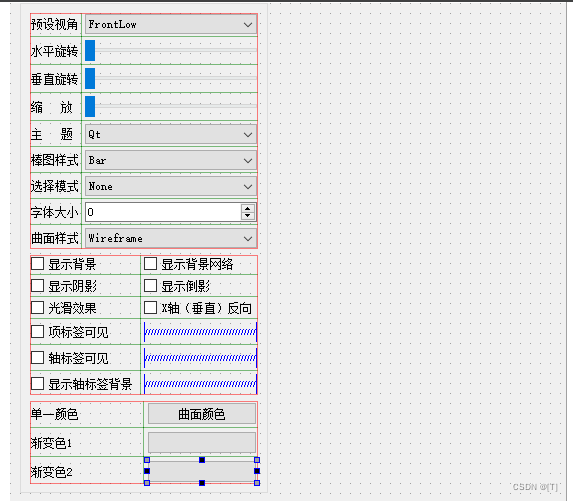
(3)初始化
MainWindow::MainWindow(QWidget *parent) :
    QMainWindow(parent),
    ui(new Ui::MainWindow)
{
    ui->setupUi(this);

    QSplitter *splitter = new QSplitter;
    splitter->addWidget(ui->groupBox);
    init3DGraph();
    splitter->addWidget(createWindowContainer(graph3D));
    setCentralWidget(splitter);

    // 设置按钮的渐变色
    QLinearGradient lgColor1(0, 0, 100, 0);
    lgColor1.setColorAt(1.0, Qt::black);
    lgColor1.setColorAt(0.67, Qt::blue);
    lgColor1.setColorAt(0.33, Qt::red);
    lgColor1.setColorAt(0, Qt::yellow);
    QPixmap mp(160, 20);
    QPainter painter(&mp);
    painter.setBrush(lgColor1);
    painter.drawRect(0, 0, 160, 20);
    ui->btnColors1->setIcon(QIcon(mp));
    ui->btnColors1->setIconSize(QSize(160, 20));

    lgColor1.setColorAt(1.0, Qt::darkBlue);
    lgColor1.setColorAt(0.5, Qt::yellow);
    lgColor1.setColorAt(0.2, Qt::red);
    lgColor1.setColorAt(0, Qt::darkRed);
    painter.setBrush(lgColor1);
    painter.drawRect(0, 0, 160, 20);
    ui->btnColors2->setIcon(QIcon(mp));
    ui->btnColors2->setIconSize(QSize(160, 20));
}

MainWindow::~MainWindow()
{
    delete ui;
}

void MainWindow::init3DGraph()
{
    graph3D = new Q3DSurface;

    graph3D->axisX()->setTitle("X轴");
    graph3D->axisX()->setTitleVisible(true);
    graph3D->axisX()->setRange(-11, 11);
    graph3D->axisY()->setTitle("Y轴");
    graph3D->axisY()->setTitleVisible(true);
    graph3D->axisZ()->setTitle("Z轴");
    graph3D->axisZ()->setTitleVisible(true);
    graph3D->axisZ()->setRange(-11, 11);


    QSurfaceDataProxy *proxy = new QSurfaceDataProxy;
    series = new QSurface3DSeries(proxy);
    series->setDrawMode(QSurface3DSeries::DrawSurface);
    series->setMeshSmooth(true); // 光滑曲面
    graph3D->addSeries(series);

    QSurfaceDataArray *dataArray = new QSurfaceDataArray;

    // 摩西跟草帽算法
    int N = 41;
    dataArray->reserve(N);
    float x, y, z;
    x = -10;
    for (int i = 0; i < N; ++i)
    {
        QSurfaceDataRow *newRow = new QSurfaceDataRow(N);

        y = -10;
        int index = 0;
        for (int j = 1; j <= N; ++j)
        {
            z = qSqrt(x * x + y * y);
            if(z != 0)
            {
                z = 10 * qSin(z) / z;
            }
            else
            {
                z = 10;
            }
            // 图形库的坐标系
            (*newRow)[index++].setPosition(QVector3D(x, z, y));
            y += 0.5;
        }
        x += 0.5;
        *dataArray << newRow;
    }

    series->dataProxy()->resetArray(dataArray);

}
- 1
- 2
- 3
- 4
- 5
- 6
- 7
- 8
- 9
- 10
- 11
- 12
- 13
- 14
- 15
- 16
- 17
- 18
- 19
- 20
- 21
- 22
- 23
- 24
- 25
- 26
- 27
- 28
- 29
- 30
- 31
- 32
- 33
- 34
- 35
- 36
- 37
- 38
- 39
- 40
- 41
- 42
- 43
- 44
- 45
- 46
- 47
- 48
- 49
- 50
- 51
- 52
- 53
- 54
- 55
- 56
- 57
- 58
- 59
- 60
- 61
- 62
- 63
- 64
- 65
- 66
- 67
- 68
- 69
- 70
- 71
- 72
- 73
- 74
- 75
- 76
- 77
- 78
- 79
- 80
- 81
- 82
- 83
- 84
- 85
- 86
- 87
- 88
- 89
- 90
- 91
- 92
- 93
- 94
- 95
(4)设置颜色
#include <QColorDialog>
void MainWindow::on_btnOneColor_clicked()
{
    QColor color = series->baseColor();
    color = QColorDialog::getColor(color);
    if(color.isValid())
    {
        series->setBaseColor(color);
        series->setColorStyle(Q3DTheme::ColorStyleUniform);
    }
}

void MainWindow::on_btnColors1_clicked()
{
    QLinearGradient lgColor1(0, 0, 100, 0);
    lgColor1.setColorAt(1.0, Qt::black);
    lgColor1.setColorAt(0.67, Qt::blue);
    lgColor1.setColorAt(0.33, Qt::red);
    lgColor1.setColorAt(0, Qt::yellow);
    series->setBaseGradient(lgColor1);
    series->setColorStyle(Q3DTheme::ColorStyleRangeGradient); //设置渐变色
}

void MainWindow::on_btnColors2_clicked()
{
    QLinearGradient lgColor1(0, 0, 100, 0);
    lgColor1.setColorAt(1.0, Qt::darkBlue);
    lgColor1.setColorAt(0.5, Qt::yellow);
    lgColor1.setColorAt(0.2, Qt::red);
    lgColor1.setColorAt(0, Qt::darkRed);
    series->setBaseGradient(lgColor1);
    series->setColorStyle(Q3DTheme::ColorStyleRangeGradient);
}
- 1
- 2
- 3
- 4
- 5
- 6
- 7
- 8
- 9
- 10
- 11
- 12
- 13
- 14
- 15
- 16
- 17
- 18
- 19
- 20
- 21
- 22
- 23
- 24
- 25
- 26
- 27
- 28
- 29
- 30
- 31
- 32
- 33
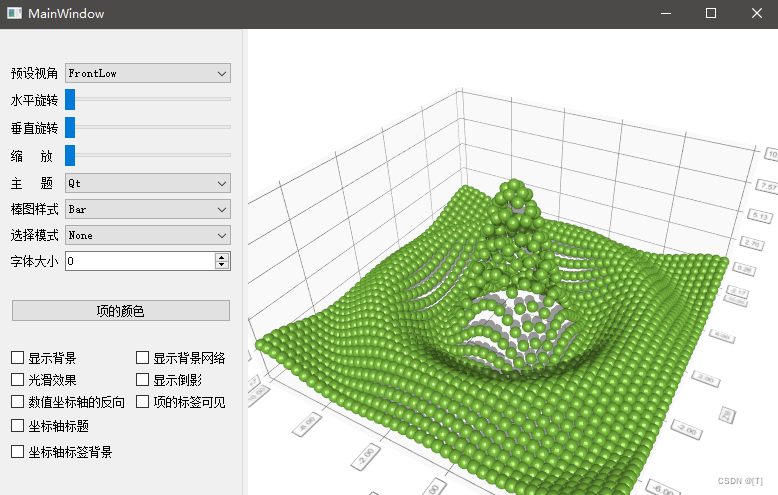
五、三维地形图
1、实现程序
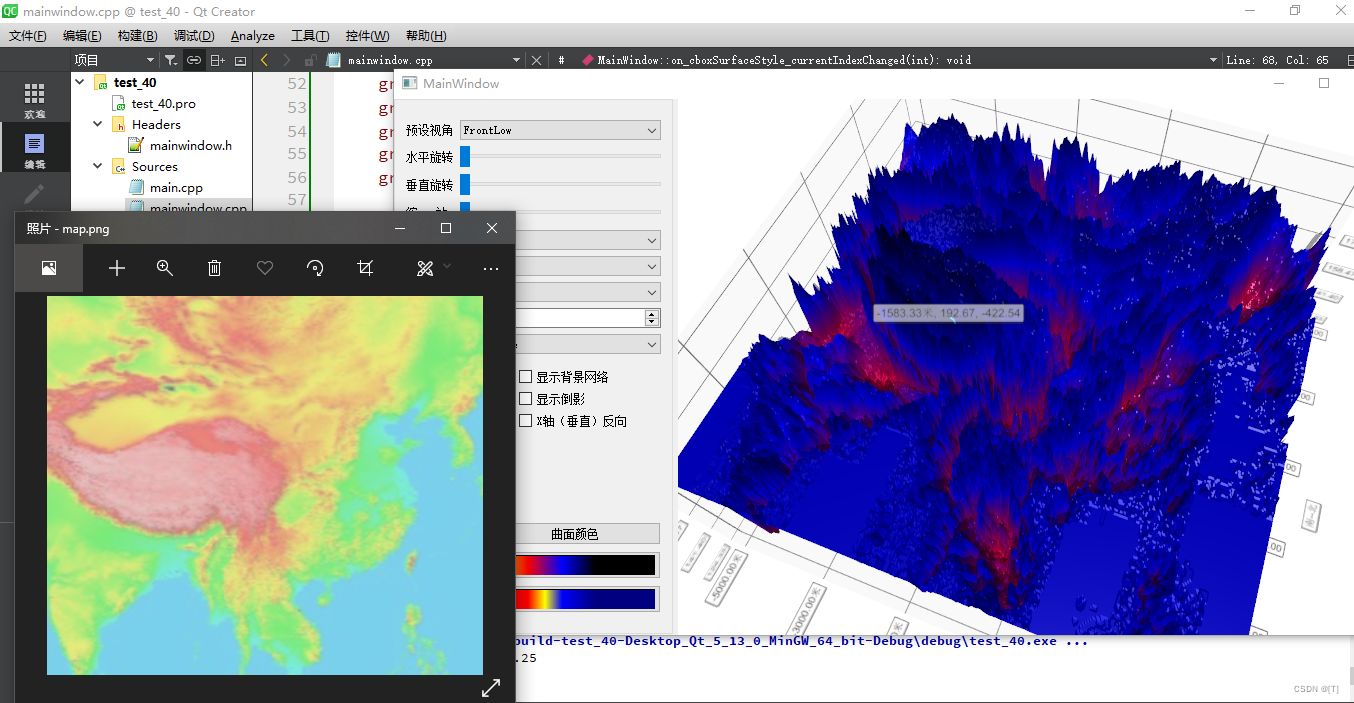
(1)拷贝上一个项目
(2)添加图片资源文件
(3)实现功能
#include "mainwindow.h"
#include "ui_mainwindow.h"

#include <QSplitter>

MainWindow::MainWindow(QWidget *parent) :
    QMainWindow(parent),
    ui(new Ui::MainWindow)
{
    ui->setupUi(this);

    QSplitter *splitter = new QSplitter;
    splitter->addWidget(ui->groupBox);
    init3DGraph();
    splitter->addWidget(createWindowContainer(graph3D));
    setCentralWidget(splitter);

    // 设置按钮的渐变色
    QLinearGradient lgColor1(0, 0, 100, 0);
    lgColor1.setColorAt(1.0, Qt::black);
    lgColor1.setColorAt(0.67, Qt::blue);
    lgColor1.setColorAt(0.33, Qt::red);
    lgColor1.setColorAt(0, Qt::yellow);
    QPixmap mp(160, 20);
    QPainter painter(&mp);
    painter.setBrush(lgColor1);
    painter.drawRect(0, 0, 160, 20);
    ui->btnColors1->setIcon(QIcon(mp));
    ui->btnColors1->setIconSize(QSize(160, 20));

    lgColor1.setColorAt(1.0, Qt::darkBlue);
    lgColor1.setColorAt(0.5, Qt::yellow);
    lgColor1.setColorAt(0.2, Qt::red);
    lgColor1.setColorAt(0, Qt::darkRed);
    painter.setBrush(lgColor1);
    painter.drawRect(0, 0, 160, 20);
    ui->btnColors2->setIcon(QIcon(mp));
    ui->btnColors2->setIconSize(QSize(160, 20));
}

MainWindow::~MainWindow()
{
    delete ui;
}

void MainWindow::init3DGraph()
{
    graph3D = new Q3DSurface;

    graph3D->axisX()->setTitle("东--西");
    graph3D->axisX()->setTitleVisible(true);
    graph3D->axisX()->setLabelFormat("%.2f米");
    graph3D->axisZ()->setTitle("南--北");
    graph3D->axisZ()->setTitleVisible(true);
    graph3D->axisY()->setTitle("海拔");
    graph3D->axisY()->setTitleVisible(true);

    QImage mapImage(":/images/images/map.png");
    QHeightMapSurfaceDataProxy *proxy = new QHeightMapSurfaceDataProxy(mapImage);
    proxy->setValueRanges(-5000, 5000, -5000, 5000);
    series = new QSurface3DSeries(proxy);
    series->setDrawMode(QSurface3DSeries::DrawSurface);
    graph3D->addSeries(series);
}

void MainWindow::on_cboxSurfaceStyle_currentIndexChanged(int index)
{
    series->setDrawMode(QSurface3DSeries::DrawFlags(index + 1));
}

#include <QColorDialog>
void MainWindow::on_btnOneColor_clicked()
{
    QColor color = series->baseColor();
    color = QColorDialog::getColor(color);
    if(color.isValid())
    {
        series->setBaseColor(color);
        series->setColorStyle(Q3DTheme::ColorStyleUniform);
    }
}

void MainWindow::on_btnColors1_clicked()
{
    QLinearGradient lgColor1(0, 0, 100, 0);
    lgColor1.setColorAt(1.0, Qt::black);
    lgColor1.setColorAt(0.67, Qt::blue);
    lgColor1.setColorAt(0.33, Qt::red);
    lgColor1.setColorAt(0, Qt::yellow);
    series->setBaseGradient(lgColor1);
    series->setColorStyle(Q3DTheme::ColorStyleRangeGradient); //设置渐变色
}

void MainWindow::on_btnColors2_clicked()
{
    QLinearGradient lgColor1(0, 0, 100, 0);
    lgColor1.setColorAt(1.0, Qt::darkBlue);
    lgColor1.setColorAt(0.5, Qt::yellow);
    lgColor1.setColorAt(0.2, Qt::red);
    lgColor1.setColorAt(0, Qt::darkRed);
    series->setBaseGradient(lgColor1);
    series->setColorStyle(Q3DTheme::ColorStyleRangeGradient);
}

void MainWindow::on_cboxMode_currentIndexChanged(int index)
{
    switch (index)
    {
    case 0:
        graph3D->setSelectionMode(QAbstract3DGraph::SelectionNone);
        break;
    case 1:
        graph3D->setSelectionMode(QAbstract3DGraph::SelectionItem);
        break;
    case 2:
        graph3D->setSelectionMode(QAbstract3DGraph::SelectionRow |
                                  QAbstract3DGraph::SelectionSlice);
        break;
    case 3:
        graph3D->setSelectionMode(QAbstract3DGraph::SelectionColumn |
                                  QAbstract3DGraph::SelectionSlice);
        break;
    default:
        break;
    }
}
- 1
- 2
- 3
- 4
- 5
- 6
- 7
- 8
- 9
- 10
- 11
- 12
- 13
- 14
- 15
- 16
- 17
- 18
- 19
- 20
- 21
- 22
- 23
- 24
- 25
- 26
- 27
- 28
- 29
- 30
- 31
- 32
- 33
- 34
- 35
- 36
- 37
- 38
- 39
- 40
- 41
- 42
- 43
- 44
- 45
- 46
- 47
- 48
- 49
- 50
- 51
- 52
- 53
- 54
- 55
- 56
- 57
- 58
- 59
- 60
- 61
- 62
- 63
- 64
- 65
- 66
- 67
- 68
- 69
- 70
- 71
- 72
- 73
- 74
- 75
- 76
- 77
- 78
- 79
- 80
- 81
- 82
- 83
- 84
- 85
- 86
- 87
- 88
- 89
- 90
- 91
- 92
- 93
- 94
- 95
- 96
- 97
- 98
- 99
- 100
- 101
- 102
- 103
- 104
- 105
- 106
- 107
- 108
- 109
- 110
- 111
- 112
- 113
- 114
- 115
- 116
- 117
- 118
- 119
- 120
- 121
- 122
- 123
- 124
- 125
- 126
声明:本文内容由网友自发贡献,不代表【wpsshop博客】立场,版权归原作者所有,本站不承担相应法律责任。如您发现有侵权的内容,请联系我们。转载请注明出处:https://www.wpsshop.cn/blog/article/detail/57272
推荐阅读
- article
【torch加速】python onnx to tensorRT报错NotImplementedError: Converting dtype(‘float16‘) to a ctypes type_onnx notimplementederror
onnx转tensorRT报错解决:NotImplementedError:Convertingdtype('float16')toactypestype_onnxnotimplementederroronnxnotimplementede... [详细]赞
踩
- article
【开题报告】springbootspringboot+vue的网上书店项目7yt91计算机毕业设计源码、研究背景、意义、目的、内容、方案和预期成果_开题报告基于springboot的图书商城设计与实现
研究背景:随着互联网的快速发展和电子商务的兴起,线上购物已经成为人们日常生活中不可或缺的一部分。同时,前端技术也在不断发展和创新,Vue作为一种流行的前端框架,具有简洁、高效、灵活等特点,被广泛应用于Web开发中。因此,设计并实现一个基于V... [详细]赞
踩
- Dockerfile中提供了两个非常相似的命令COPY和ADD,本文尝试解释这两个命令的基本功能,以及其异同点,然后总结其各自适合的应用场景。Build上下文的概念在使用dockerbuild命令通过Dockerfile创建镜像时,会产生一... [详细]
赞
踩
- CortexM4外设地址,SPI通信原理简介,SPI异常问题分析_spi地址spi地址笔者来聊聊碰到的一个SPI作为应用层通信协议的问题SPI通信异常问题分析1、CortexM4外设地址2、SPI通信原理简介3、SPI异常问题分析1、Cor... [详细]
赞
踩
- 一、下载进入官网(https://www.oracle.com/technetwork/java/javase/downloads/jdk8-downloads-2133151.html)下载所需版本安装包二、安装1、双击打开程序包2、点击... [详细]
赞
踩
- Mysql中自带性能分析工具Profile。注意:profile仅对当前会话有效。MySql调优(三)QuerySQL优化(2)profiler诊断工具Mysql中自带性能分析工具Profile。注意:profile仅对当前会话有效一、操作... [详细]
赞
踩
- 简单介绍使用vds.h中的类和方法操作修改硬件/盘符的一些常使用的结构和函数,包括获取格式、删除、创建分区,设置磁盘文件类型,格式化卷等Qt案例使用WINDOWSAPI的VDS.H库查询/修改WINDOWS系统中硬盘分区/盘符信息(二)简单... [详细]
赞
踩
- Halcon的基本概念是【图像,区域,轮廓线】,初学者务必要搞清三者区别和联系。以下介绍如何将一个图像的区域截取出来,保存成另外的图像。本文用来加强概念,并用以下案例去理解概念的用途。_halcon截取图像一部分halcon截取图像一部分一... [详细]
赞
踩
- 在循环中,这行将每对预测和标签以JSON格式转换为字符串,然后添加到结果列表中。-这行将结果列表连接成一个字符串,每个结果之间用换行符隔开,然后写入到文件中。-这行使用分词器解码标签,移除特殊符号,并删除前后的空白。-这行打开预测结果输出文... [详细]
赞
踩
- 上一此在介绍如何获取cookie时候已经说过,在网页开发者功能里面可以对网页进行抓包分析,详见:Python微博爬取实战(一)爬虫参数:如何获得cookie,实现爬虫登陆爬取1.那么问题来了,什么是json数据呢?先介绍一下历史:过去传统网... [详细]
赞
踩
- 前言本文的文字及图片来源于网络,仅供学习、交流使用,不具有任何商业用途,版权归原作者所有,如有问题请及时联系我们以作处理。作者:TM0831PS:如有需要Python学习资料的小伙伴可以加点击下方链接自行获取此次爬虫要实现的是爬取某个微博用... [详细]
赞
踩
- docker构建镜像_dockerdockerfile镜像名字dockerdockerfile镜像名字镜像存储位置:LinuxDocker主机本地镜像仓库通常位于/var/lib/docker/<storage--driver>... [详细]
赞
踩
- 它重写了on_log方法,在每次训练过程打log时,它会计算一些关于训练过程的信息,然后将这些信息写入到一个JSONL(JSONLines)格式的文件中,以便后续进行分析或可视化。:在输出目录下创建一个名为"trainer_log.json... [详细]
赞
踩
- 作为前端开发工程师,你有能力编写复杂的代码,但你真正需要的是你最喜爱的,可信赖的文本编辑器。你可以使用一个简单的,如微软的记事本,但往往比较有益的文字编辑器具有语法突出/高亮功能,支持多种语言,包含一..._前端文章编辑器前端文章编辑器作为... [详细]
赞
踩
- 软件工程专业是2002年国家教育部新增的热门专业,以计算机科学与技术学科为基础,培养适应计算机应用学科的发展,特别是软件产业的发展,毕业后可在IT行业、科研机构、企事业中从事计算机应用软件系统开发和研制的高级软件工程技术人才。这不仅是个人的... [详细]
赞
踩
- VSCodeVSCode这是由微软开发研制的一款免费、开源、跨平台的代码编辑器,支持几乎所有主流语言开发,常见的语法高亮、智能补全、语法检查、括号匹配,这个软件都支持,除此之外,还支持git功能,插件扩展丰富,下载配置相关插件后,可直接调试... [详细]
赞
踩
- 简介:云原生时代下软件的构建和部署离不开容器技术。提到容器,几乎大家下意识都会联想到Docker。而Docker中有两个非常重要的概念,一个是Image(镜像),一个是Container(容器)。前者是一个静态视图,打包了应用的目录结构、运... [详细]
赞
踩
- 实现:将一个服务,拆分为一个多模块的项目,将服务的接口与实现分离,放于专门的模块内,在接口上方加@FeignClient注解。的开发过程中,不同的微服务,通常都有自己的数据库,但是像Redis等组件是不同服务间所共享的,如果要在不同的微服务... [详细]
赞
踩
- 在成功登陆之后,我们可以进行下一波操作了~接下来,我们的目的是通过输入关键字,找到相关用户,并收集用户的一些基本信息环境tools1、chrome及其developertools2、python3.63、pycharmPython3.6中使... [详细]
赞
踩
- 匹配的子表达式以下的分组构造捕获匹配的子表达式:(子表达式)其中子表达式为任何有效正则表达式模式。使用括号的捕获按正则表达式中左括号的顺序从一开始从左到右自动编号。捕获元素编号为零的捕获是由整个正则表达式模式匹配的文本。命名匹配的子表达式以... [详细]
赞
踩
相关标签

