
热门标签
热门文章
- 1LAXCUS分布式操作系统各版本下载地址_laxcus下载
- 2飞速创软笔记
- 3尚硅谷-尚品汇项目开发总结(第二天)_2023尚硅谷尚品汇项目
- 4Java双端队列Deque用法_deque
- 5C#中Dictionary
- 6芋道 spring security oauth2 入门_SpringCloud Alibaba微服务实战十四 - Gateway集成Oauth2.0
- 706_openstack之创建云主机和常见错误_openstack创建云主机
- 8最优二叉查找树详解(算法导论学习笔记)_最优二叉搜索树问题最优值递归定义
- 9计算机视觉实战项目3(图像分类+目标检测+目标跟踪+姿态识别+车道线识别+车牌识别+无人机检测+A*路径规划+单目测距与测速+行人车辆计数等)_计算机视觉毕设项目实战
- 10STM32 7-8
当前位置: article > 正文
微信小程序实现Echarts,并根据不同点击事件重新渲染_微信小程序echarts二次渲染
作者:从前慢现在也慢 | 2024-02-16 14:30:49
赞
踩
微信小程序echarts二次渲染
引入文件
为了避免echarts过大,我只选取了部分图表,此过程较为繁琐,直接放我自己打包好的,或者自行搜索"微信小程序引入echarts"
链接:https://pan.quark.cn/s/9831bda4af95
提取码:FbqR
- 解压后移动到component文件夹下,没有就创建个
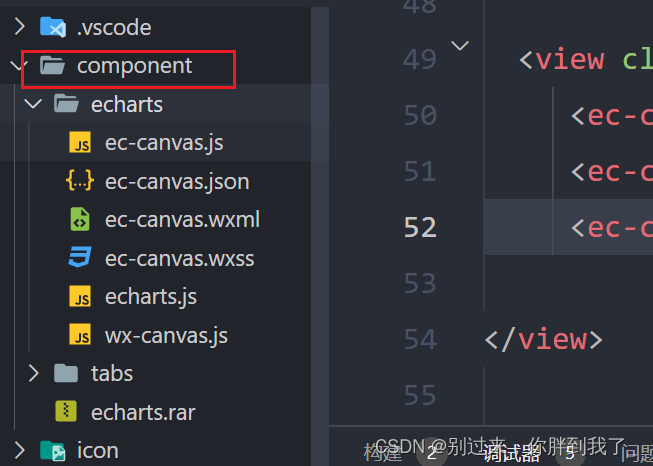
- 然后在需要用到的页面引用下
import * as echarts from "../../component/echarts/echarts"
- 1
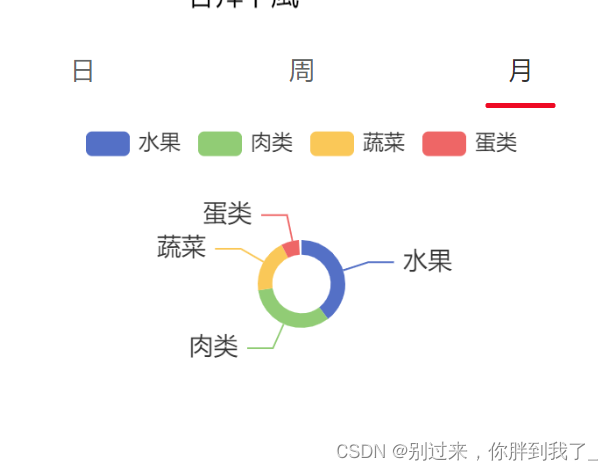
需求
- 饼图展示进餐种类级数量
- 需要按照每日、每周和每月来展示数据
前端代码
- wxml
 <van-tabs bind:click="onTabClick">
  <van-tab title="日">
    <van-u-calendar
      cal-type="day"
      bind:click="getDayDate"
    />
  </van-tab>
  <van-tab title="周">
    <van-u-calendar
      cal-type="week"
        bindtap="getWeekDate"
      data-type="2"
    />
  </van-tab>
  <van-tab title="月">
    <van-u-calendar
      cal-type="month"
      bind:click="getMonthDate"
    />
  </van-tab>
</van-tabs>

  <view class="ec-container">
     <ec-canvas wx:if="{{chartsIndex == 1}}" canvas-id="echart-pie" ec="{{ec}}" style="width: 750rpx; height: 378rpx; display: block; box-sizing: border-box"></ec-canvas>
     <ec-canvas wx:if="{{chartsIndex == 2}}" canvas-id="echart-pie" ec="{{ec}}" style="width: 750rpx; height: 378rpx; display: block; box-sizing: border-box"></ec-canvas>
     <ec-canvas wx:if="{{chartsIndex == 3}}" canvas-id="echart-pie" ec="{{ec}}" style="width: 750rpx; height: 378rpx; display: block; box-sizing: border-box"></ec-canvas>

</view>

- 1
- 2
- 3
- 4
- 5
- 6
- 7
- 8
- 9
- 10
- 11
- 12
- 13
- 14
- 15
- 16
- 17
- 18
- 19
- 20
- 21
- 22
- 23
- 24
- 25
- 26
- 27
- 28
三个wx:if是为了点击事件触发后重新渲染饼图
- wxss
 .ec-container {
    display: flex;
    flex-direction: column;
    align-items: center;
    justify-content: center;
    width: 100vw;
    height: 30vh;
  }

  ec-canvas {
    width: 100%;
    height: 100%;
  }
- 1
- 2
- 3
- 4
- 5
- 6
- 7
- 8
- 9
- 10
- 11
- 12
- 13
- js
var app = getApp();
const $api = require('../../utils/request').API;

import * as echarts from "../../component/echarts/echarts"

Page({

  /**
   * 页面的初始数据
   */
  data: {
    ec: {
        onInit: initChart
      },
    active: 0,
    chartsIndex: 1,
    emptyList:[{value:0,name:"暂无数据"}],
  },

  // 获取数据
  getDietaryEcharts(type){
    const userInfo = wx.getStorageSync('userInfo')
    const data = {
        userId: userInfo.id,
        type: this.data.dietaryType
    }
    if(type != '' && type != undefined && type != null){
        data.type = type
    }
    $api.getDietartEcharts(data).then(res=>{
        if (res.data.code === 10000) {
            console.log("echarts: " + JSON.stringify(res.data.data));
            if (res.data.data != null && res.data.data != '' && res.data.data != undefined && res.data.data.length > 0 ) {
                const result = res.data.data.reduce((acc, cur) => {
                    const types = cur.split(',');
                    for (let i = 0; i < types.length; i++) {
                      const type = types[i];
                      if (acc[type]) {
                        acc[type]++;
                      } else {
                        acc[type] = 1;
                      }
                    }
                    return acc;
                  }, {});
                  console.log(result);
                  let arr = []
                  for (const key in result) {
                      if (Object.hasOwnProperty.call(result, key)) {
                          arr.push({
                              name: key,
                              value: result[key]
                          })

                      }
                  }
                  app.globalData.dietaryChartData = arr;

            }else{
                app.globalData.dietaryChartData = this.data.emptyList
            }
        }
    })
  },
  /**
   * 生命周期函数--监听页面加载
   */
  onLoad: function (options) {
    this.getDietaryEcharts()
  },

})

// 初始化echarts
function initChart(canvas, width, height, dpr) {
    const chart = echarts.init(canvas, null, {
      width: width,
      height: height,
      devicePixelRatio: dpr
    });
    canvas.setChart(chart);

    var option = {
      backgroundColor: 'rgba(255,255,255,0.8)',
      tooltip: {
        trigger: 'item'
      },
      legend: {//显示图例
        show: true,
        top: '5%',
        left: 'center'
      },
      series: [{
        label: {
          normal: {
            fontSize: 14
          }
        },

        type: 'pie',
        center: ['50%', '60%'],//位置
        radius: ['20%', '30%'],//圈大小

        data: app.globalData.dietaryChartData
      }]
    };
    chart.setOption(option);
    return chart;
  }
- 1
- 2
- 3
- 4
- 5
- 6
- 7
- 8
- 9
- 10
- 11
- 12
- 13
- 14
- 15
- 16
- 17
- 18
- 19
- 20
- 21
- 22
- 23
- 24
- 25
- 26
- 27
- 28
- 29
- 30
- 31
- 32
- 33
- 34
- 35
- 36
- 37
- 38
- 39
- 40
- 41
- 42
- 43
- 44
- 45
- 46
- 47
- 48
- 49
- 50
- 51
- 52
- 53
- 54
- 55
- 56
- 57
- 58
- 59
- 60
- 61
- 62
- 63
- 64
- 65
- 66
- 67
- 68
- 69
- 70
- 71
- 72
- 73
- 74
- 75
- 76
- 77
- 78
- 79
- 80
- 81
- 82
- 83
- 84
- 85
- 86
- 87
- 88
- 89
- 90
- 91
- 92
- 93
- 94
- 95
- 96
- 97
- 98
- 99
- 100
- 101
- 102
- 103
- 104
- 105
- 106
- 107
- 108
- 109
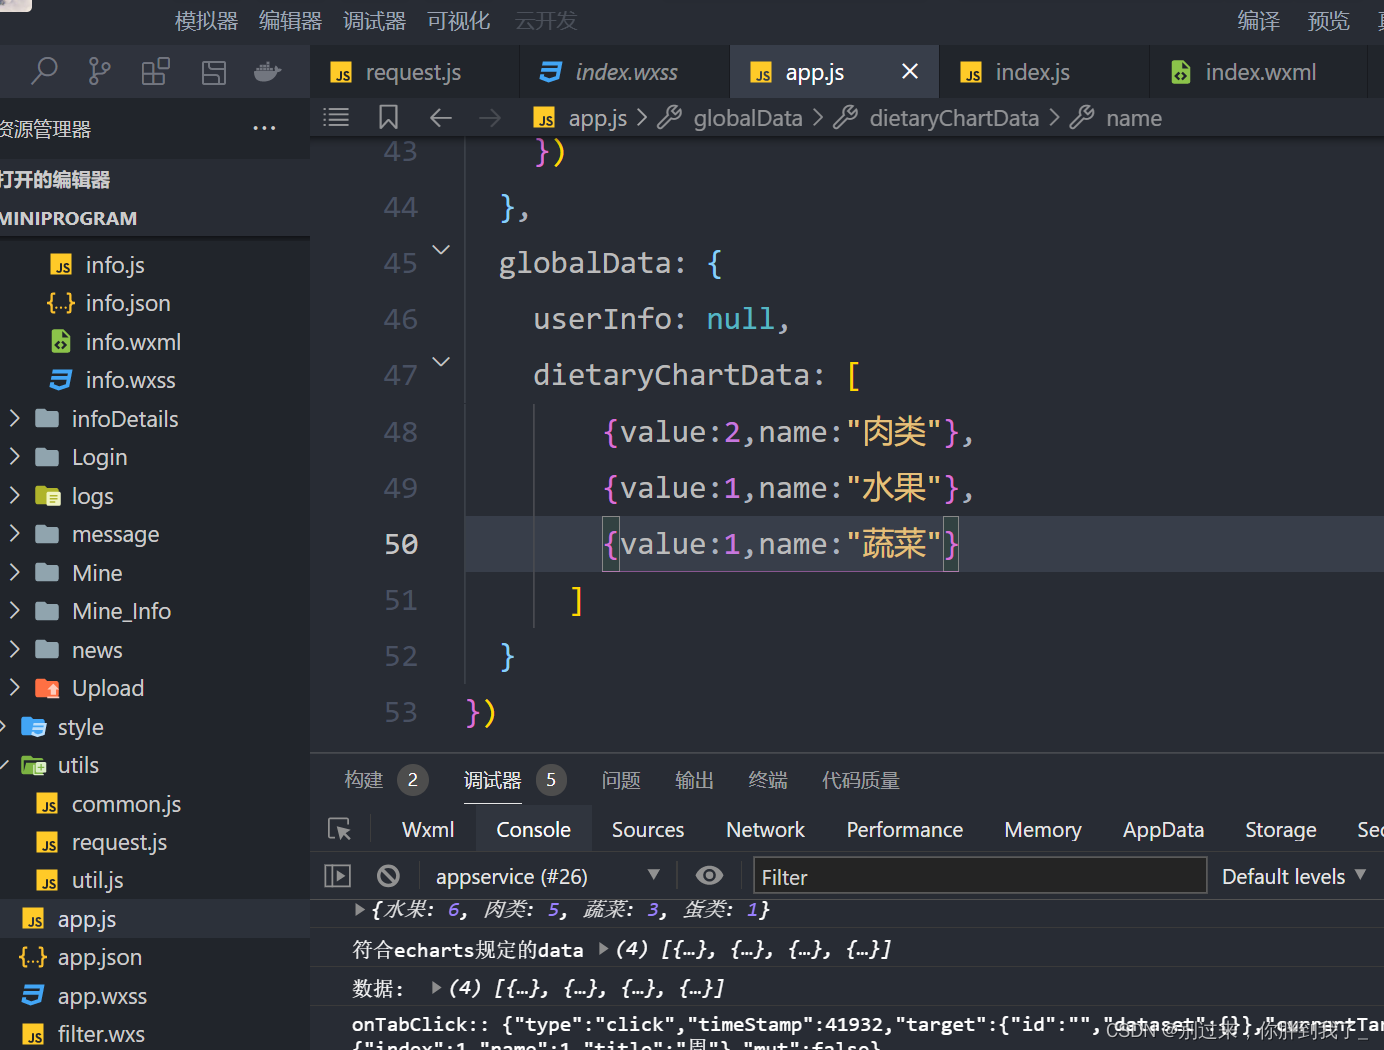
因为渲染图表的方法initChart在Page外面,我无法获取page内的data,所以走了个歪门
用了app.js中的全局变量来存取要渲染的数据
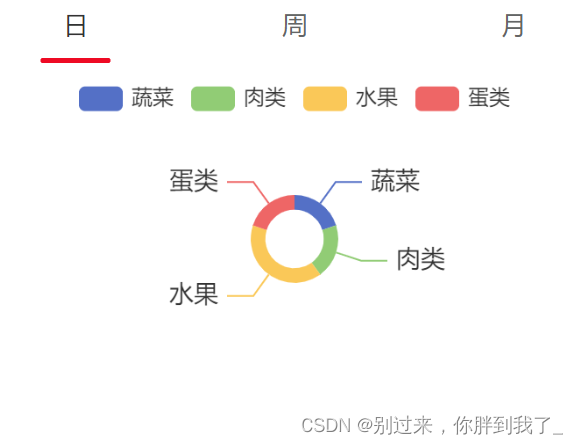
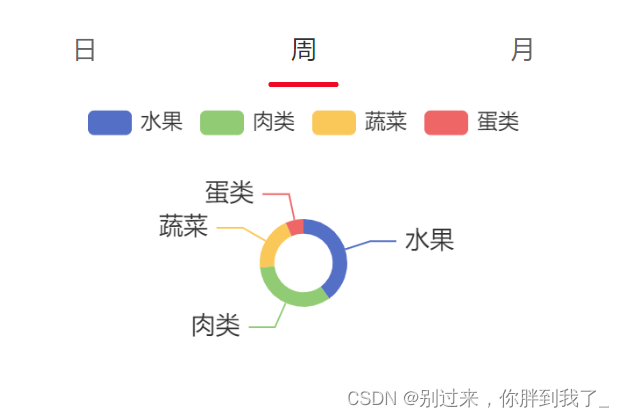
实现效果
- 日
- 周
- 月
声明:本文内容由网友自发贡献,转载请注明出处:【wpsshop博客】
推荐阅读
- article
【Spark+Hadoop+Hive+MySQL+Presto+SpringBoot+Echarts】基于大数据技术的用户日志数据分析及可视化平台搭建项目_spark用户行为日志数据分析项目源码
随着我国科学技术水平的不断发展,计算机网络技术的广泛应用,我国已经步入了大数据时代。在大数据背景下,各种繁杂的数据层出不穷,一时难以掌握其基本特征及一般规律,这也给企业的运营数据分析工作增添了不小的难度。在大数据的背景下,基于大数据前沿技术... [详细]赞
踩
- 3、js中引入echarts。1、安装echarts。_vue3echarts-glseries.pushvue3echarts-glseries.pushecharts与echarts-gl实现3D饼图实现效果:旋转效果缩放效果实现步骤1... [详细]
赞
踩
赞
踩
- <em>importem>'e<em>chartsem>-gl'//3d图表库。四、echat.js代码。_<em>importem>'e<em>chartsem>-gl'//3d图表库<em>importem>'e<em>chartsem>-gl'//3d图表库一、安装相应插件 "e<em>chartsem>": ... [详细]
赞
踩
- 【代码】vue3+ts+echarts3d饼图。_vue3echarts3d饼图vue3echarts3d饼图<template><divclass="water-eval-container"><divcla... [详细]
赞
踩
- echarts+echarts-glvue2制作3D地图+下钻功能+标记点功能,解决dblclick事件失效问题,解决地图下钻后边框不更新保留问题,但是也出现了一个问题,和我们预想的不太一样,下钻到省地图后,china地图的边框数据保留了,... [详细]
赞
踩
- 主要使用vue+echarts+echarts-gl实现3d地图效果,以及3d柱状图效果_echarts曲线图,echarts-gl绘制3d地图+3d柱状图,echarts-liquidfill实现水球图echarts曲线图,echarts... [详细]
赞
踩
- 记录一下大屏开发中使用到的echarts-gl大屏的页面根据需求前前后后改了几个版本了,地图的样式也改了又改这里记录一下,因为echarts属性用到的比较多也比较杂,防止以后需要用到忘记了。_echarts3d地图echarts3d地图记录... [详细]
赞
踩
- Vue环境下进行的代码编写echarts曲线图,echarts-gl绘制3d地图+3d柱状图,echarts-liquidfill实现水球图_echarts-gl3d地图echarts-gl3d地图Vue环境下进行的代码编写一、npm安装及... [详细]
赞
踩
- 使用EChartsGL实现基础的三维可视化EChartsGL(后面统一简称GL)为ApacheEChartsTM补充了丰富的三维可视化组件,这篇文章我们会简单介绍如何基于GL实现一些常见的三维可视化作品。实际上如果你对ECharts有一定了... [详细]
赞
踩
- 3d地图,有贴图材质_echarts-glecharts-glecharts+echarts-gl-使用geo3D+map3D+scatter3D做3d地图一、使用插件echarts@5.2.2、echarts-gl@2.0.8、jquer... [详细]
赞
踩
- echarts——实现3D地图+3D柱状图效果——粗糙代码记录——技能提升_echarts3d地图echarts3d地图vue+echarts——实现3D地图+3D柱状图效果——粗糙代码记录收费模板:¥29.9元购买,且必须是高级版+尊享版... [详细]
赞
踩
- 以这个为例子:https://www.makeapie.com/editor.html?c=x1-kIyaV6u记得要先下载echarts和echarts-glnpminstallechartsnpminstallecharts-gl然后就... [详细]
赞
踩
- 使用http://datav.aliyun.com/portal/school/atlas/area_selector这个工具获取要显示的地图数据。首先在项目中安装echarts与echartsgl(echersgl用于3d)npminst... [详细]
赞
踩
- 需求:实现如图所示的3D地图图表(1)原本使用的highcharts没有3d地图的功能,搜索插件也没有可替代的方案,选择echarts理由是在地图方面百度拥有毋庸置疑的实力https://blog.csdn.net/GRAY_KEY/art... [详细]
赞
踩
- 【代码】echarts实现3D饼图。_echarts3d饼图echarts3d饼图2023.6.30今天我学习了如何使用echarts渲染一个3d的饼图,效果如下:相关代码如下:<template><divref="pie... [详细]
赞
踩
相关标签

