
- 1使用docker部署Kafka(MAC Apple M2 Pro)
- 27 步精简 Docker 镜像几百MB(上)_docker 基础镜像几十兆构建出镜像几百兆
- 3oracle+12+c+udev+配置,oracle12c rac安装过程中udev配置不生效
- 4路由表(RIB表、FIB表)、ARP表、MAC表整理_路由表包含哪些内容
- 5springboot发布部署方式_sptingboot部署发布
- 6mysql mariadb不能启动原因_CentOS7安装mariaDB以及无法启动的问题
- 7深度学习框架之tensorflow_基于tensorflow开发算法框架
- 8SGX Enable_sgx disabled by bios
- 9js 数字类型的字符串自动加1_你不一定了解的js数据类型
- 10spring,springboot,springmvc底层原理解析_springboot mvc和spring mvc底层实现原理
【ScottPlot】使用ScottPlot创建实时动态图_scatterplotlist
赞
踩
首先:简单 介绍下Scottplot这个免费的开源图标组件库。
ScottPlot 是一个 .NET 图表组件, 主要有以下特点:
- 适用范围广:同时适用于 WinForms, WPF, Avalonia, Console, 支持 .NET Framework 4.6.1 及以上, NET Core 2.0 至 .NET 5。
- 上手简单:只需几行代码即可创建折线图、条形图、饼图、散点图等。
- 性能强悍:千万级数据处理无压力, 媲美 Python Matplotlib。
- 可交互:支持用户和图表数据进行交互, 注入灵魂。
- 开源免费:基于MIT开源协议, 已经开源近5年, 不存在版权和收费问题
- 组件丰富:图表组件非常全面,可满足各种场景下的展示需求。
其次:说一下使用的体验。
- 性能的确非常强悍,亲测百万数据非常流程。
- 重点是这个库是开源的,看官方介绍,说scottplot 5 的版本性能会比4更强劲,期待中。
- 图表种类非常丰富。重点是2D图表库。
- 代码下载下来后,可以使用VS2022进行编译,注意:如果使用VS2019的话,需要支持.net6.
- 【缺点1】:不支持MVVM模式
- 【缺点2】:在图表上标注每个点的数据,没有其他图表库方便。
- 【缺点3】:要绘实时折线图表没有其他图表库方便。
- 下面介绍使用个人认为比较简单的方法在Scottplot实现实时动态图表的方法。
介绍方法前,可以先看下效果,如下图:
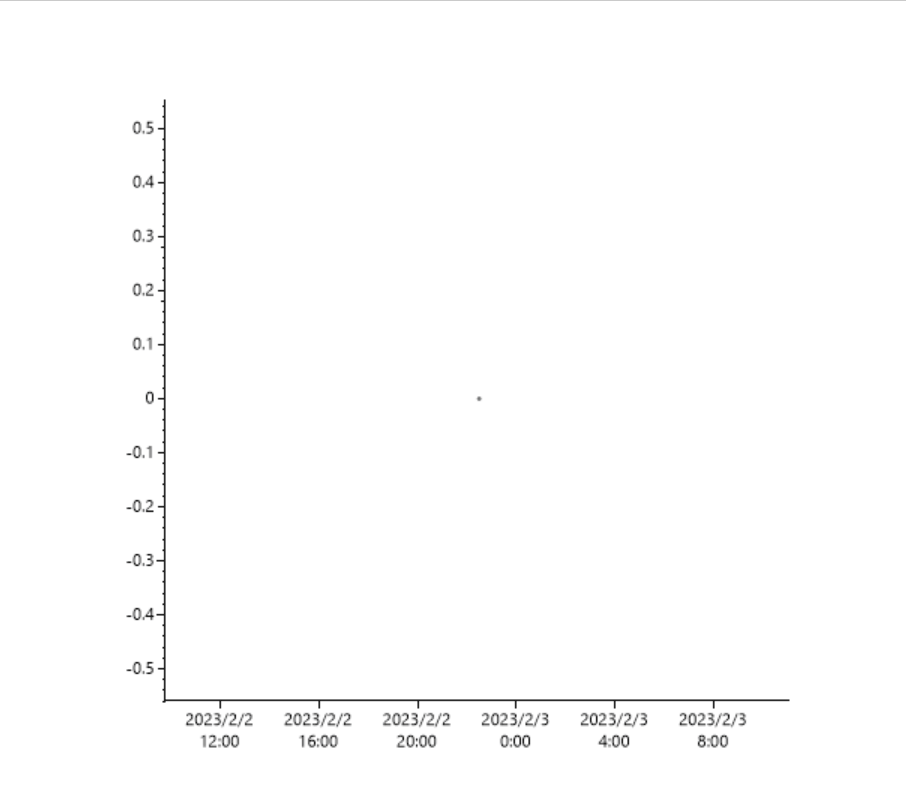
下图的数据来自于传感器,通过USB转RS232来读取传感器的值来进行实时显示。
再次:我们先看下官方给的几个方案:
Plot Live, Changing Data - ScottPlot FAQ
方案一:Changing Fixed-Length Data
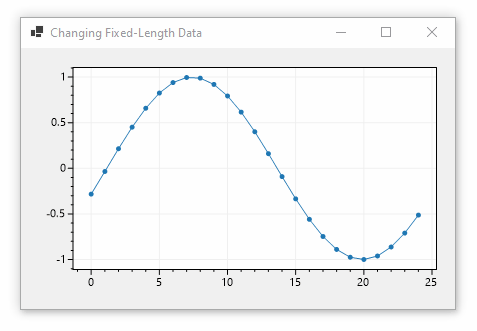
简介:通过一个定时器不断的更新一个固定大小的double数组,来完成实时刷新Y轴的值。
- readonly double[] Values = new double[25];
- readonly Stopwatch Stopwatch = Stopwatch.StartNew();
-
- public Form1()
- {
- InitializeComponent();
- UpdateValues();
- formsPlot1.Plot.AddSignal(Values);
- }
-
- public void UpdateValues()
- {
- double phase = Stopwatch.Elapsed.TotalSeconds;
- double multiplier = 2 * Math.PI / Values.Length;
- for (int i = 0; i < Values.Length; i++)
- Values[i] = Math.Sin(i * multiplier + phase);
- }
-
- private void timer1_Tick(object sender, EventArgs e)
- {
- UpdateValues();
- formsPlot1.Render();
- }
这个方案的缺点:
使用固定大小的数组的话,初始化的时候,在没有数据的时候,会显示一条和数组大小相等长度的直线,然后数据上来后,会从数组的最后开始更新数据。所以前面会看到一条直线。
如何解决这个问题:
1. 需要配合IPlottable具体实现类中的MaxRenderIndex来去掉那条线条,例如刚开始初始话的时候,设置:MaxRenderIndex = 0;
2. 然后在实时值上来时候,更新MaxRenderIndex,并更新Y轴中的值。
3. 如果MaxRenderIndex 的值大于数组的大小了,就让它等于数组的大小。注意这个大小不能超过数组的大小,否则会报数组越界异常。
- 部分代码:
-
- private static SignalPlot RealTimeSignalPlot;
-
- RealTimeSignalPlot = RealTimeContentPlot.Plot.AddSignal(LiveData);
-
- RealTimeSignalPlot.MaxRenderIndex = 0;
-
- public void UpdateDataDopplerRadar(object currentValue)
- {
- //要对这个方法进行扩展
- // 1. 这里面判断数组实时值的个数是否大于数组大小,如果小于数组大小,就从数组当前大小开始更新。
- // 对 RealTimeSignalPlot.MaxRenderIndex 赋值未实时值得个数。
- if (ApplicationContext.LiveDataCount < ApplicationContext.LiveDataLength)
- {
- ApplicationContext.LiveData[ApplicationContext.LiveDataCount] = (double)currentValue;
- RealTimeSignalPlot.MaxRenderIndex = ApplicationContext.LiveDataCount;
- ApplicationContext.LiveDataCount++;
- }
- else
- {
- // 2. 如果实时值的个数等于了数组大小,就执行下面这部分代码,然后对RealTimeSignalPlot.MaxRenderIndex 进行重新赋值。
-
- //"scroll" the whole chart to the left
- Array.Copy(ApplicationContext.LiveData, 1, ApplicationContext.LiveData, 0, ApplicationContext.LiveData.Length - 1);
- //place the newest data point at the end
- ApplicationContext.LiveData[ApplicationContext.LiveData.Length - 1] = (double)currentValue;
-
- }
- if (RealTimeSignalPlot.MaxRenderIndex >= ApplicationContext.LiveDataLength)
- {
- RealTimeSignalPlot.MaxRenderIndex = ApplicationContext.LiveDataLength - 1;
- }
-
- RealTimeContentPlot.Refresh();
- }
-
-
-
方案二:Growing Data with Partial Array Rendering
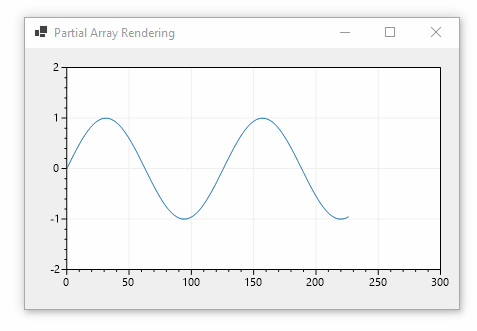
代码自己看,就不解释了。和方案一基本差不多。
- readonly double[] Values = new double[100_000];
- readonly ScottPlot.Plottable.SignalPlot SignalPlot;
- int NextPointIndex = 0;
-
- public Form1()
- {
- InitializeComponent();
- SignalPlot = formsPlot1.Plot.AddSignal(Values);
- formsPlot1.Plot.SetAxisLimits(0, 100, -2, 2);
- }
-
- // This timer adds data frequently (1000 times / second)
- private void timer1_Tick(object sender, EventArgs e)
- {
- Values[NextPointIndex] = Math.Sin(NextPointIndex * .05);
- SignalPlot.MaxRenderIndex = NextPointIndex;
- NextPointIndex += 1;
- }
-
- // This timer renders infrequently (10 times per second)
- private void timer2_Tick(object sender, EventArgs e)
- {
- // adjust the axis limits only when needed
- double currentRightEdge = formsPlot1.Plot.GetAxisLimits().XMax;
- if (NextPointIndex > currentRightEdge)
- formsPlot1.Plot.SetAxisLimits(xMax: currentRightEdge + 100);
-
- formsPlot1.Render();
- }
接下来我们重点来看基于官方代码进行扩展的方案三:
官方给的实时绘图都是基于double数组的。但是留意到官方最后说了一下 ScatterPlotList。
于是自己就去看了下 ScatterPlotList 这个类。
看下这个类的简介:
注意里面提到的 has Add() methods to easily add data.
然后看到类名有个List,那就说明它可以用类似List中Add的方法来给图上的曲线增加一个数据。
- /// <summary>
- /// A collection of X/Y coordinates that can be displayed as markers and/or connected lines.
- /// Unlike the regular ScatterPlot, this plot type has Add() methods to easily add data.
- /// </summary>
- public class ScatterPlotList<T> : IPlottable
看到这里,突然发现,如有有List的方法,那实现动态折线图不是很简单了吗?
接着继续看代码,发现这个类里面就有一个public void Add(T x, T y) 和 public void Clear()方法。
没有类似RemoveAt()和Remove的方法。什么意思?
问题一:不能动态Remove掉Xs里面值。
- /// <summary>
- /// Clear the list of points
- /// </summary>
- public void Clear()
- {
- Xs.Clear();
- Ys.Clear();
- }
-
- /// <summary>
- /// Add a single point to the list
- /// </summary>
- public void Add(T x, T y)
- {
- Xs.Add(x);
- Ys.Add(y);
- }
心不甘,继续看代码:
这个类里面的Xs,Ys都是一个List,而且是 protected的,
问题二:ScatterPlotList<T> 这个类没有提供访问的方法。怎么办?
既然不让我在父类直接访问,那我就直接继承这个类ScatterPlotList<T>来访问Xs和Ys.
不就可以解决了。
-
- protected readonly List<T> Xs = new();
- protected readonly List<T> Ys = new();
问题三:自己写的继承类,如何生成图表呢?
还得继续看代码:
看下 Plot.AddScatterList<double>() 这个方法怎么实现的。
源代码里面直接new一个ScatterPlotList对象,然后Add里面,就返回了这个对象。
- /// <summary>
- /// Scatter plot with Add() and Clear() methods for updating data
- /// </summary>
- public ScatterPlotList<double> AddScatterList(
- Color? color = null,
- float lineWidth = 1,
- float markerSize = 5,
- string label = null,
- MarkerShape markerShape = MarkerShape.filledCircle,
- LineStyle lineStyle = LineStyle.Solid)
- {
- var spl = new ScatterPlotList<double>()
- {
- Color = color ?? GetNextColor(),
- LineWidth = lineWidth,
- MarkerSize = markerSize,
- Label = label,
- MarkerShape = markerShape,
- LineStyle = lineStyle
- };
-
- Add(spl);
- return spl;
- }
问题四:这个Add方法做了什么呢?
源码如下:很简单,而且是个public的。
- /// <summary>
- /// Add a plottable to the plot
- /// </summary>
- /// <param name="plottable">a plottable the user created</param>
- public void Add(IPlottable plottable)
- {
- settings.Plottables.Add(plottable);
- }
看到这的话,那我想,我自己写个类,继承这个类:public class ScatterPlotList<T> : IPlottable
然后在使用的时候,我new一个自己的这个类,再通过Plot.Add 加进去,不就可以了。
于是有了下面这些代码,来实现文章开头的实时动态折线图的效果:
- public class ScatterPlotListDouble<T> : ScatterPlotList<T>
- {
- public List<T> GetXs()
- {
- return Xs;
- }
-
- public List<T> GetYs()
- {
- return Ys;
- }
- }
初始化的时候和串口有数据的时候,调用下面这部分代码:
- ApplicationContext定义的几个变量
- public static double[] LiveData = new double[] { };
- public static double[] xs = new double[] { };
- public static int LiveDataLength = 1000;
-
-
- public partial class DataView
- {
- private static ScatterPlotListDouble<double> RealTimeSignalPlot;
-
- public DataView()
- {
- RealTimeSignalPlot = RealTimeSignalPlot ?? new ScatterPlotListDouble<double>()
- {
- Color = Color.FromArgb(68, 114, 196),
- MarkerSize = 3,
- Smooth = false
- };
-
- if (RealTimeSignalPlot.Count != 0)
- {
- ApplicationContext.xs = RealTimeSignalPlot.GetXs().ToArray();
- ApplicationContext.LiveData = RealTimeSignalPlot.GetYs().ToArray();
- RealTimeSignalPlot.Clear();
- }
- else
- {
- RealTimeSignalPlot.Add(DateTime.Now.ToOADate(), 0);
- }
-
- RealTimeContentPlot.Plot.Add(RealTimeSignalPlot);
- RealTimeSignalPlot.AddRange(ApplicationContext.xs, ApplicationContext.LiveData);
-
- RealTimeContentPlot.Plot.XAxis.DateTimeFormat(true);
-
- RealTimeContentPlot.Plot.AxisAuto();
- RealTimeContentPlot.Refresh();
- }
-
-
- // 这个方法是外部接口,每次串口有数据了,就调用这个来更新数据。
- public void UpdateData(object currentValue, DateTime now)
- {
-
- RealTimeSignalPlot.Add(now.ToOADate(), (double)currentValue);
-
- if (RealTimeSignalPlot.GetXs().Count > ApplicationContext.LiveDataLength)
- {
- RealTimeSignalPlot.GetXs().RemoveAt(0);
- RealTimeSignalPlot.GetYs().RemoveAt(0);
- }
-
- Dispatcher.Invoke(() =>
- {
- RealTimeContentPlot.Plot.AxisAuto();
- RealTimeContentPlot.Refresh();
- });
- }
- }
完结,通过以上方法,来使用List实现一个实时的动态效果图,比较方便。
- yolov8-pose制作自制数据集_yolopose数据标注yolopose数据标注labelme标注工具1.环境配置condacreate-nlabelmesudoapt-getinstallpython3-pyqt5#PyQt5sud... [详细]
赞
踩
- Matplotlib是一个用于绘制二维图形的Python库,提供了一个pyplot模块,用于创建各种类型的图表。其中一种图表是散点图(ScatterPlots),用于展示两个变量之间的关系,以及数据的分布情况。_对角线散点图对角线散点图欢迎... [详细]
赞
踩
- 曲线拟合(转载:http://blog.sina.com.cn/s/blog_8e1548b80101c9iu.html)补:拟合多项式输出为str 1.poly2str([p],'x') 2. fn=sprintf('%.16f... [详细]
赞
踩
- 介绍两类可解释性机器学习模型SHAP和LIME,其工作原理和举例说明。_shap事后解释器shap事后解释器内容大纲1、SHAP解释器1.1案例:用于预测患者肺癌1.2案例中使用的shap解释器1.3SHAP工作原理1.4举例说明2、LIM... [详细]
赞
踩
- 日期范围选择器、弹窗框兼容移动端_移动端时间范围ui移动端时间范围ui1.DatePicker日期范围选择器<el-date-pickerv-model="timeScope"type="daterange"range-separat... [详细]
赞
踩
- mac安装Vue脚手架不成功,创建Vue项目报commandnotfound:cnpm1.输入node-v和npm-v检查是否安装成功,如出现版本号,证明安装成功2.在终端输入npminstall--globalvue-cli在此过程中可能... [详细]
赞
踩
- 将ChatGPT引入您的IDE,快速使用Bito——之——BitoVSCursor_bitochatgptbitochatgpt什么是Bito?官方解释:通过将ChatGPT引入您的IDE和CLI来帮助开发人员显著加速他们的影响。我们使用O... [详细]
赞
踩
- es6~es11学习笔记ES6~ES11学习笔记·课程地址ES6letlet不能重复声明变量(var可以)leta;letb,c,d;lete=100;letf=521,g="atguigu",h=[];1234let具有块级作用域,内层变... [详细]
赞
踩
- 在unity动画系统中,例如用trigger控制人物跳跃动画,当你快速按下相应按键时,可能trigger会触发多次,例如:解决方法如下:在ground状态下新增一个名为FSMClearSignals的脚本,代码如下usingSystem.C... [详细]
赞
踩
- 小伙伴们在日常浏览网站和网页的时候,时不时会看到有些网页会有圆效果的出现,例如:有的网站图片在一个圆的里面等等。那么,有的小伙伴们会想这个圆是怎么使用代码实现的呢,使用html还是css呢。在这里小编告知大家既不是使用html,也不是使用c... [详细]
赞
踩
- 在响应时间方面,Bing和Bard明显快于GPT-4,几乎可以立刻给出答案,而GPT-4需要等待一小段时间,而且有联网不稳定的问题。内容方面,Bing给出的信息比较简短,只是简单回答了问题,而GPT-4和Bard会有所拓展和总结。另外,Bi... [详细]
赞
踩
- 下载materialDesign在文件中引用头文件xmal文件中xmlns:materialDesign="http://materialdesigninxaml.net/winfx/xaml/themes"app.xmal中
[详细] 赞
踩
- 如有出入,敬请斧正XGBoost是一种强大的机器学习算法,在Kaggle等算法比赛中,一直都被誉为"刷分神器",经常能有出彩的准确率表现,甚至排行榜的前若干名都是XGBoost的刷屏.包括在实际应用中,XGBoost也是一大热门,在以腾讯为... [详细]
赞
踩
- sklearn接口的xgboost分类器:xgboost.XGBClaaifier()xgboost.fit(x,y)1.xgboost.predict(test_x)2.xgboost.predict_proba(test_x)3.xgb... [详细]
赞
踩
- 是Git中一个非常实用的命令,它允许你在不提交代码的情况下临时存储当前工作目录和暂存区(Index)中的所有更改。是Git中一个非常有用的命令,它用于将一个分支的提交移动到另一个分支的基础上重新应用。请注意,在修改分支名后,如果其他开发人员... [详细]
赞
踩
- 学习过程观看视频:[狂神说Java]https://www.bilibili.com/video/BV1B7411L7tE?p=13欢迎大家支持噢,很良心的老师了!三大方法,代码示例1、newSingleThreadExecutorpack... [详细]
赞
踩
- boosting和bagging都是集成学习(ensemblelearning)领域的基本算法[2]。集成学习是指将若干弱分类器组合之后产生一个强分类器。_当训练数据集较大时,可分为多个子集,分别训练分类器当训练数据集较大时,可分为多个子集... [详细]
赞
踩
- #深度学习还没开始就想放弃系列#环境:win7+python3.5+tensorflow1.9.0+keras2.2.4参考博客:U-net源码讲解(Keras)源码解析很棒很细!全卷积神经网络图像分割(U-net)-keras实现代码根本... [详细]
赞
踩
- article
《软件用户协议》微信小<em>程序</em> <em><em>navigato</em>r</em> 用来实现<em>页面</em>跳转功能_<<em><em>navigato</em>r</em> <em>open</em>-<em>type</em>="<em>navigate</em>">《软件用户协议》</<em>navigato</em>
在微信小<em>程序</em>开发中,<em><em>navigato</em>r</em>用来实现<em>页面</em>路由功能,比如A<em>页面</em>中点击<em>页面</em>打开B<em>页面</em>_《软件用户协议》<<em><em>navigato</em>r</em><em>open</em>-<em>type</em>="<em>navigate</em>">《软件用户协议》</<em><em>navigato</em>r</em>>也许你迷茫,但是我想说,在你迷... 《软件用户协议》[详细]赞
踩
- 原标题:微信小程序新增Webview,它是什么东西?今天刚刚给客户做完案子,正准备去睡觉。2017今天刚刚给客户做完案子,正准备去睡觉。2017年11月3日11:29看到了微信公众平台推送的小程序新动态,作为靠小程序吃饭的公司一员,马上就滚... [详细]
赞
踩

