- 1MySQL使用简单教程_mysql使用教程
- 2安装SDK MANAGER + Jetpack 4.5刷机_sdk软件没有jetpack4.5.1
- 3免费的开源低代码平台推荐
- 4etcd and consul_etcd consul
- 5ICLR Spotlight | 卷积网络上的首个BERT/MAE预训练,ResNet也能用_resnet做mae
- 6在 Windows 中搭建 Stable Diffusion,目前最简单的安装方式,自己的专属 AI_windows 安装stable diffusion
- 7毕业设计-基于深度学习的猕猴桃叶片病虫害识别系统 YOLO python 卷积神经网络 人工智能_猕猴桃深度学习数据集
- 8Python——为什么是当之无愧的第一编程语言?_做科学计算哪种编程语言最好
- 9opencv颜色处理与追踪_opencv.js 调色
- 10创建表的时候创建索引_建表语句建立索引
prometheus 监控mysql数据库_mysql promethes
赞
踩
prometheus 监控mysql数据库
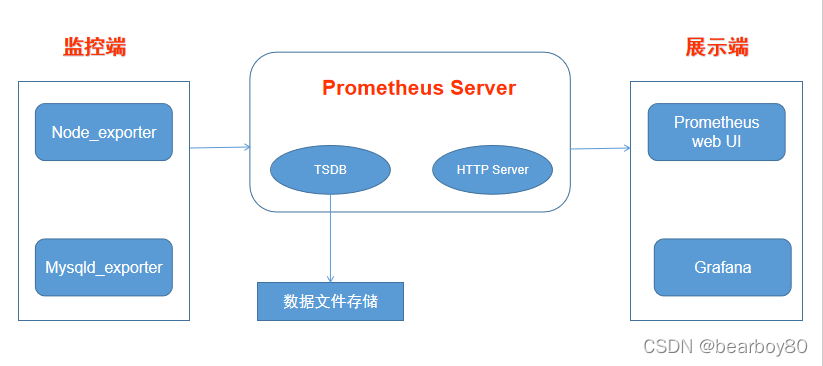
本文通过prometheus 来监控mysql数据库状态,主要利用mysqld_exporter来实现mysql状态上报。
主机信息如下:
主机IP
用途
192.168.192.57
mysql数据库
192.168.192.58
prometheus 监控主机
192.168.192.58

prometheus 安装
prometheus安装很简单,只要下载安装包,本文以prometheus-2.33.0-rc.1.linux-amd64.tar.gz版本为例进行说明,只需要解压就可以直接使用。
配置prometheus.yml配置job监控mysql
# my global config
global:
  scrape_interval: 15s # Set the scrape interval to every 15 seconds. Default is every 1 minute.
  evaluation_interval: 15s # Evaluate rules every 15 seconds. The default is every 1 minute.
  # scrape_timeout is set to the global default (10s).

# Alertmanager configuration
alerting:
  alertmanagers:
    - static_configs:
        - targets:
          # - alertmanager:9093

# Load rules once and periodically evaluate them according to the global 'evaluation_interval'.
rule_files:
  # - "first_rules.yml"
  # - "second_rules.yml"

# A scrape configuration containing exactly one endpoint to scrape:
# Here it's Prometheus itself.
scrape_configs:
  # The job name is added as a label `job=<job_name>` to any timeseries scraped from this config.
  #监控主机node信息,依赖插件node_exporter
  - job_name: "192.168.192.57-node-info"
    static_configs:
    - targets: ['192.168.192.57:9100']
  #监控主机node信息,依赖插件mysql_exporter
   - job_name: 'mysql_monitor'
    static_configs:
    - targets: ['192.168.192.57:9104'
- 1
- 2
- 3
- 4
- 5
- 6
- 7
- 8
- 9
- 10
- 11
- 12
- 13
- 14
- 15
- 16
- 17
- 18
- 19
- 20
- 21
- 22
- 23
- 24
- 25
- 26
- 27
- 28
- 29
- 30
运行prometheus
直接执行命令 prometheus
启动成功后,用浏览器打开192.168.192.58:9090界面

安装配置mysqld-exporter
下载mysqld插件,更多插件见promethues插件相关地址。下载完成后解压mysqld_exporter-0.13.0.linux-amd64.tar.gz
配置mysql-exporter
-
在mysqld-exporter安装路径下,创建.my.cnf文件。内容如下:
[client]
user=mysql_monitor
password=Mysql@123 -
创建mysql 用户并授权
CREATE USER ‘mysql_monitor’@‘localhost’ IDENTIFIED BY ‘Mysql@123’ WITH MAX_USER_CONNECTIONS 3;
GRANT PROCESS, REPLICATION CLIENT, SELECT ON . TO ‘mysql_monitor’@‘localhost’;
FLUSH PRIVILEGES;
EXIT -
启动mysqld_exporter
执行 mysqld_exporter

-
查看mysql 监控信息
浏览器运行 http://192.168.192.57:9104/metrics,查看是否metrics数据输出,如果有输出内容监控就正常

grafana 安装配置
安装
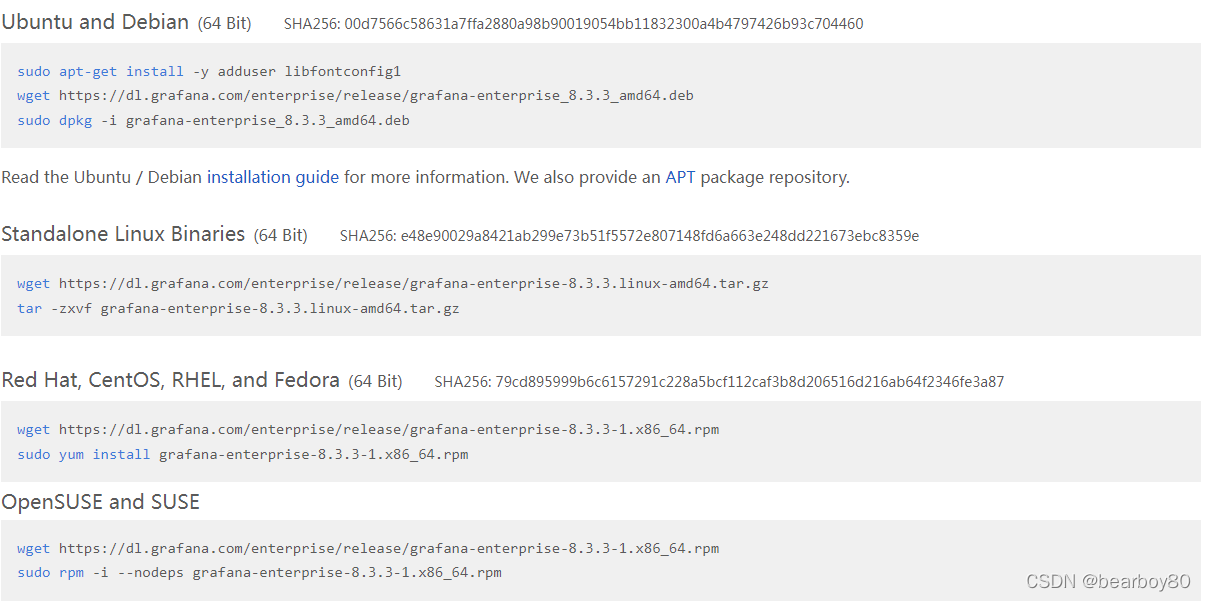
安装grafana-enterprise-8.3.3-1.x86_64.rpm,安装包下载地址,针对不同的系统版本安装命令如下:

配置
主要配置grafana data目录位置
[paths]
# Path to where grafana can store temp files, sessions, and the sqlite3 db (if that is used)
data = /opt/grafana/data

# Temporary files in `data` directory older than given duration will be removed
temp_data_lifetime = 240h

# Directory where grafana can store logs
logs = /opt/grafana/logs
- 1
- 2
- 3
- 4
- 5
- 6
- 7
- 8
- 9
database配置
[database]
# You can configure the database connection by specifying type, host, name, user and password
# as separate properties or as on string using the url properties.

# Either "mysql", "postgres" or "sqlite3", it's your choice
type = mysql
host = localhost:3306
name = grafana
user = root
# If the password contains # or ; you have to wrap it with triple quotes. Ex """#password;"""
password ="""xxxxxxx"""
- 1
- 2
- 3
- 4
- 5
- 6
- 7
- 8
- 9
- 10
- 11
smpt配置
[smtp]
enabled = true
host = xxxxx:25
user = xxxx@123.com
# If the password contains # or ; you have to wrap it with triple quotes. Ex """#password;"""
password = xxxxx
;cert_file =
;key_file =
;skip_verify = false
;from_address = admin@grafana.localhost
;from_name = Grafana
# EHLO identity in SMTP dialog (defaults to instance_name)
;ehlo_identity = dashboard.example.com
# SMTP startTLS policy (defaults to 'OpportunisticStartTLS')
;startTLS_policy = NoStartTLS
- 1
- 2
- 3
- 4
- 5
- 6
- 7
- 8
- 9
- 10
- 11
- 12
- 13
- 14
- 15
详细的配置说明,见官方文档
总配置文件如下:
##################### Grafana Configuration Example #####################
#
# Everything has defaults so you only need to uncomment things you want to
# change

# possible values : production, development
;app_mode = production

# instance name, defaults to HOSTNAME environment variable value or hostname if HOSTNAME var is empty
;instance_name = ${HOSTNAME}

#################################### Paths ####################################
[paths]
# Path to where grafana can store temp files, sessions, and the sqlite3 db (if that is used)
data = /opt/grafana/data

# Temporary files in `data` directory older than given duration will be removed
temp_data_lifetime = 240h

# Directory where grafana can store logs
logs = /opt/grafana/logs

# Directory where grafana will automatically scan and look for plugins
;plugins = /var/lib/grafana/plugins

# folder that contains provisioning config files that grafana will apply on startup and while running.
;provisioning = conf/provisioning

#################################### Server ####################################
[server]
# Protocol (http, https, h2, socket)
;protocol = http

# The ip address to bind to, empty will bind to all interfaces
;http_addr =

# The http port  to use
http_port = 3000

# The public facing domain name used to access grafana from a browser
domain = 192.168.192.58

# Redirect to correct domain if host header does not match domain
# Prevents DNS rebinding attacks
;enforce_domain = false

# The full public facing url you use in browser, used for redirects and emails
# If you use reverse proxy and sub path specify full url (with sub path)
;root_url = %(protocol)s://%(domain)s:%(http_port)s/

# Serve Grafana from subpath specified in `root_url` setting. By default it is set to `false` for compatibility reasons.
;serve_from_sub_path = false

# Log web requests
;router_logging = false

# the path relative working path
;static_root_path = public

# enable gzip
;enable_gzip = false

# https certs & key file
;cert_file =
;cert_key =

# Unix socket path
;socket =

# CDN Url
;cdn_url =

# Sets the maximum time using a duration format (5s/5m/5ms) before timing out read of an incoming request and closing idle connections.
# `0` means there is no timeout for reading the request.
;read_timeout = 0

#################################### Database ####################################
[database]
# You can configure the database connection by specifying type, host, name, user and password
# as separate properties or as on string using the url properties.

# Either "mysql", "postgres" or "sqlite3", it's your choice
type = mysql
host = localhost:3306
name = grafana
user = root
# If the password contains # or ; you have to wrap it with triple quotes. Ex """#password;"""
password ="""xxxxxxx"""

# Use either URL or the previous fields to configure the database
# Example: mysql://user:secret@host:port/database
;url =

# For "postgres" only, either "disable", "require" or "verify-full"
;ssl_mode = disable

# Database drivers may support different transaction isolation levels.
# Currently, only "mysql" driver supports isolation levels.
# If the value is empty - driver's default isolation level is applied.
# For "mysql" use "READ-UNCOMMITTED", "READ-COMMITTED", "REPEATABLE-READ" or "SERIALIZABLE".
;isolation_level =

;ca_cert_path =
;client_key_path =
;client_cert_path =
;server_cert_name =

# For "sqlite3" only, path relative to data_path setting
;path = grafana.db

# Max idle conn setting default is 2
max_idle_conn = 5

# Max conn setting default is 0 (mean not set)
max_open_conn = 10

# Connection Max Lifetime default is 14400 (means 14400 seconds or 4 hours)
;conn_max_lifetime = 14400

# Set to true to log the sql calls and execution times.
;log_queries =

# For "sqlite3" only. cache mode setting used for connecting to the database. (private, shared)
;cache_mode = private

################################### Data sources #########################
[datasources]
# Upper limit of data sources that Grafana will return. This limit is a temporary configuration and it will be deprecated when pagination will be introduced on the list data sources API.
;datasource_limit = 5000

#################################### Cache server #############################
[remote_cache]
# Either "redis", "memcached" or "database" default is "database"
;type = database

# cache connectionstring options
# database: will use Grafana primary database.
# redis: config like redis server e.g. `addr=127.0.0.1:6379,pool_size=100,db=0,ssl=false`. Only addr is required. ssl may be 'true', 'false', or 'insecure'.
# memcache: 127.0.0.1:11211
;connstr =

#################################### Data proxy ###########################
[dataproxy]

# This enables data proxy logging, default is false
;logging = false

# How long the data proxy waits to read the headers of the response before timing out, default is 30 seconds.
# This setting also applies to core backend HTTP data sources where query requests use an HTTP client with timeout set.
;timeout = 30

# How long the data proxy waits to establish a TCP connection before timing out, default is 10 seconds.
;dialTimeout = 10

# How many seconds the data proxy waits before sending a keepalive probe request.
;keep_alive_seconds = 30

# How many seconds the data proxy waits for a successful TLS Handshake before timing out.
;tls_handshake_timeout_seconds = 10

# How many seconds the data proxy will wait for a server's first response headers after
# fully writing the request headers if the request has an "Expect: 100-continue"
# header. A value of 0 will result in the body being sent immediately, without
# waiting for the server to approve.
;expect_continue_timeout_seconds = 1

# Optionally limits the total number of connections per host, including connections in the dialing,
# active, and idle states. On limit violation, dials will block.
# A value of zero (0) means no limit.
;max_conns_per_host = 0

# The maximum number of idle connections that Grafana will keep alive.
;max_idle_connections = 100

# How many seconds the data proxy keeps an idle connection open before timing out.
;idle_conn_timeout_seconds = 90

# If enabled and user is not anonymous, data proxy will add X-Grafana-User header with username into the request, default is false.
;send_user_header = false

# Limit the amount of bytes that will be read/accepted from responses of outgoing HTTP requests.
;response_limit = 0

# Limits the number of rows that Grafana will process from SQL data sources.
;row_limit = 1000000

#################################### Analytics ####################################
[analytics]
# Server reporting, sends usage counters to stats.grafana.org every 24 hours.
# No ip addresses are being tracked, only simple counters to track
# running instances, dashboard and error
- 1
- 2
- 3
- 4
- 5
- 6
- 7
- 8
- 9
- 10
- 11
- 12
- 13
- 14
- 15
- 16
- 17
- 18
- 19
- 20
- 21
- 22
- 23
- 24
- 25
- 26
- 27
- 28
- 29
- 30
- 31
- 32
- 33
- 34
- 35
- 36
- 37
- 38
- 39
- 40
- 41
- 42
- 43
- 44
- 45
- 46
- 47
- 48
- 49
- 50
- 51
- 52
- 53
- 54
- 55
- 56
- 57
- 58
- 59
- 60
- 61
- 62
- 63
- 64
- 65
- 66
- 67
- 68
- 69
- 70
- 71
- 72
- 73
- 74
- 75
- 76
- 77
- 78
- 79
- 80
- 81
- 82
- 83
- 84
- 85
- 86
- 87
- 88
- 89
- 90
- 91
- 92
- 93
- 94
- 95
- 96
- 97
- 98
- 99
- 100
- 101
- 102
- 103
- 104
- 105
- 106
- 107
- 108
- 109
- 110
- 111
- 112
- 113
- 114
- 115
- 116
- 117
- 118
- 119
- 120
- 121
- 122
- 123
- 124
- 125
- 126
- 127
- 128
- 129
- 130
- 131
- 132
- 133
- 134
- 135
- 136
- 137
- 138
- 139
- 140
- 141
- 142
- 143
- 144
- 145
- 146
- 147
- 148
- 149
- 150
- 151
- 152
- 153
- 154
- 155
- 156
- 157
- 158
- 159
- 160
- 161
- 162
- 163
- 164
- 165
- 166
- 167
- 168
- 169
- 170
- 171
- 172
- 173
- 174
- 175
- 176
- 177
- 178
- 179
- 180
- 181
- 182
- 183
- 184
- 185
- 186
- 187
- 188
- 189
- 190


