sklearn实战-乳腺癌细胞数据挖掘(博主亲自录制视频)

项目合作QQ:231469242
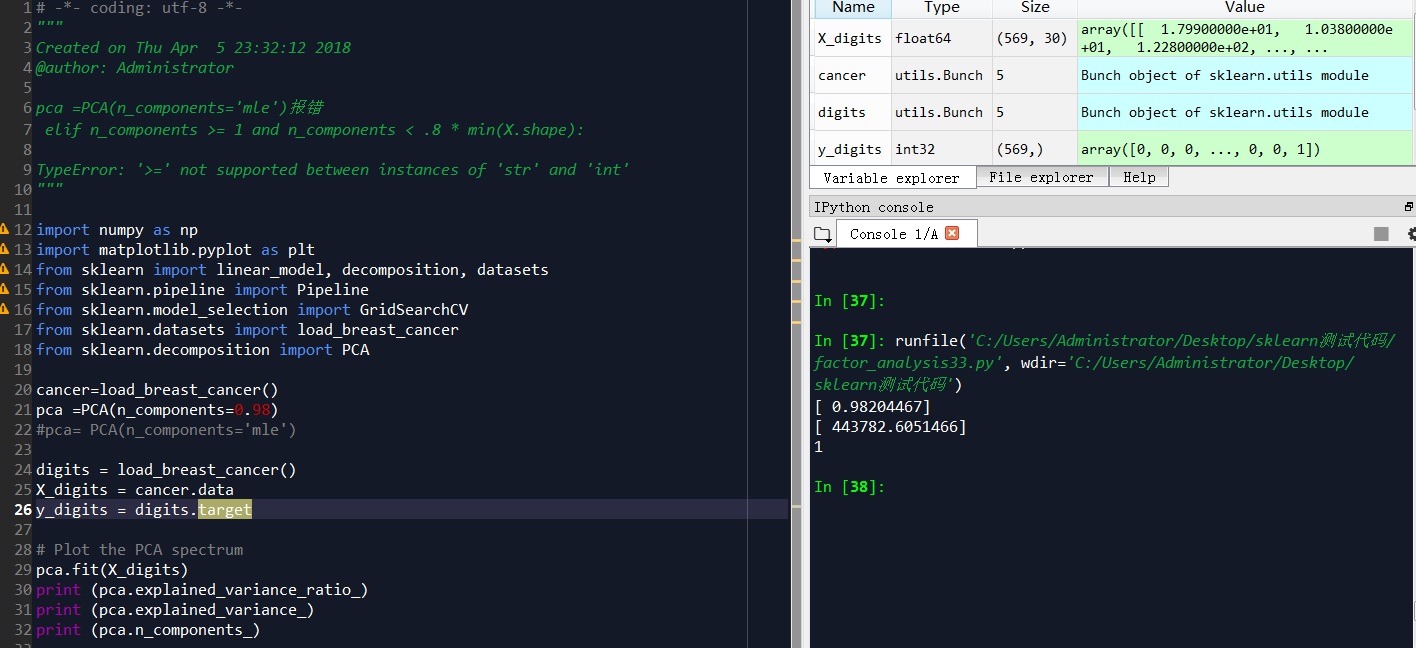
乳腺癌细胞数据,下面脚本解释了一个主成分就解释了0.98以上癌细胞方差,这和随机森林效果类似,spss和python统计结果相差较大。spss提供因子解读效果好,python计算的值更加准确,乳腺癌细胞,一个特征因子就可以解释0.98成分。
因子分析基础概念
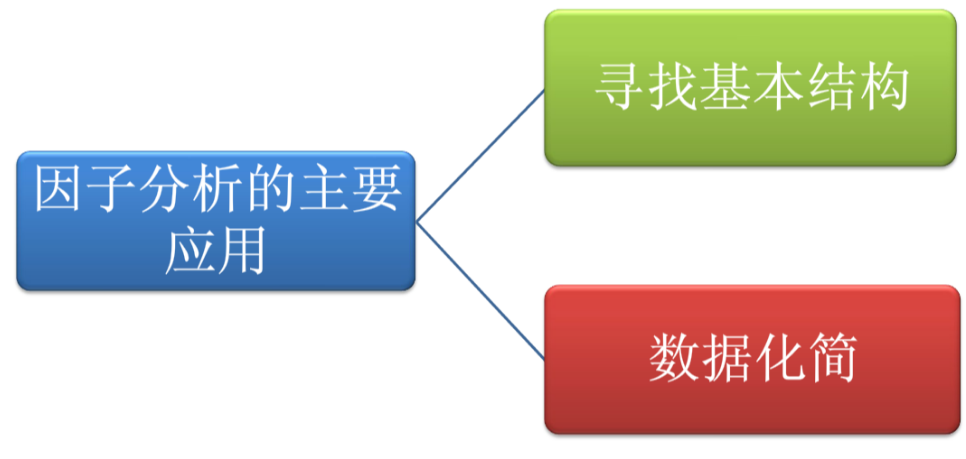
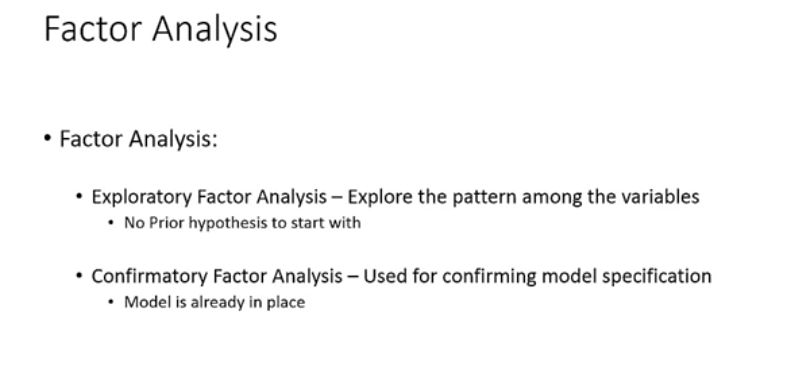
因子分析分为两类
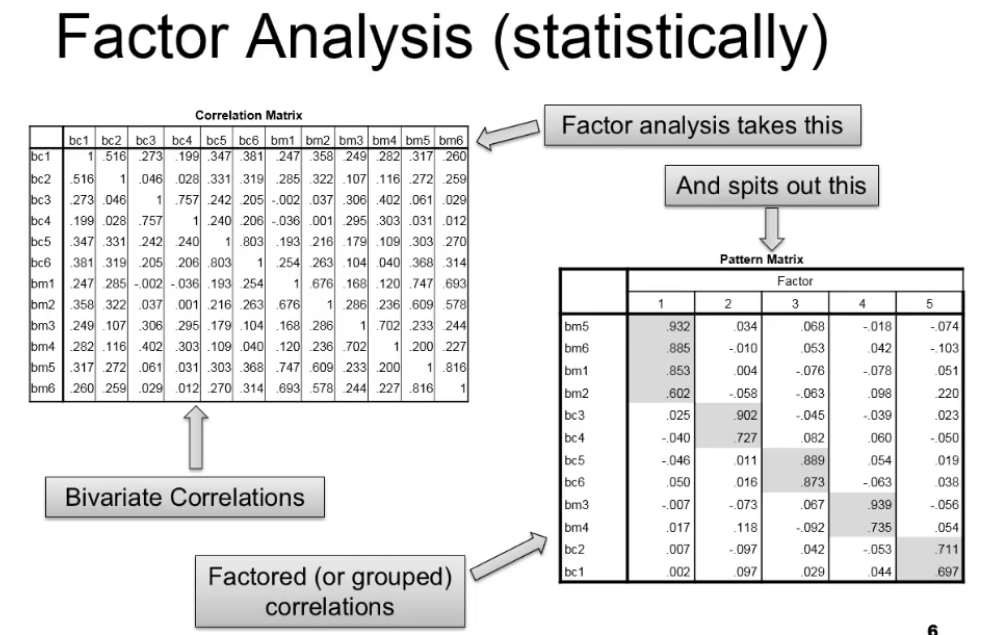
因子分析重要部分是二变量共线性矩阵和因子的共线性
pattern matrix中灰色部分就是变量值高的,灰色变量具有代表性
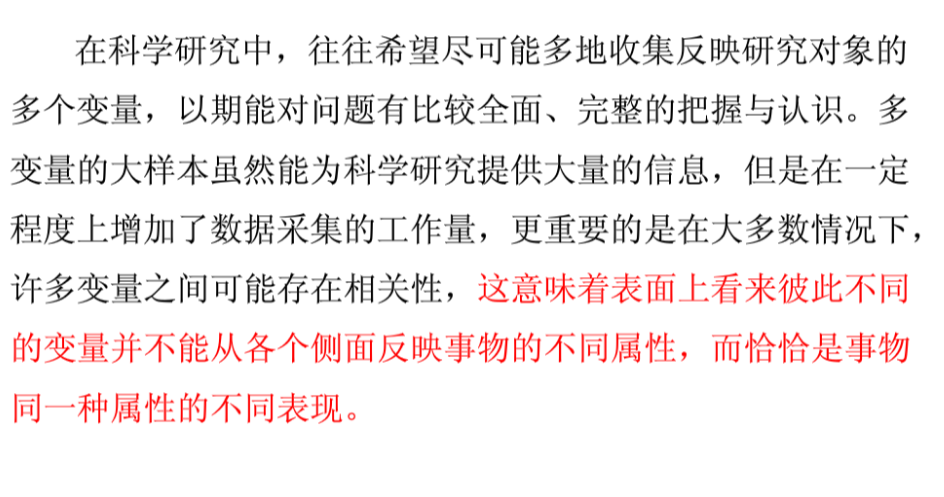
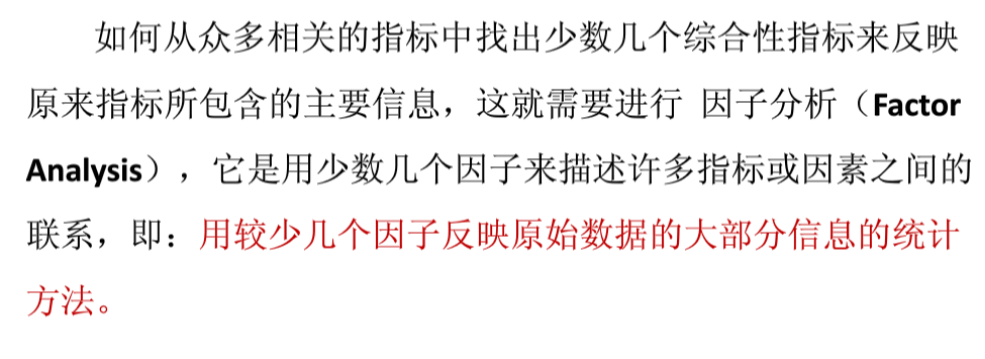
因子分析算法步骤
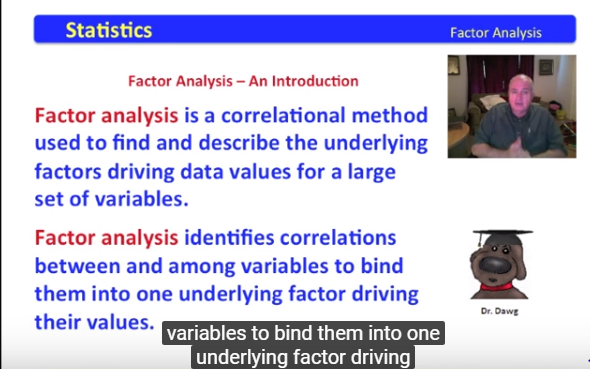
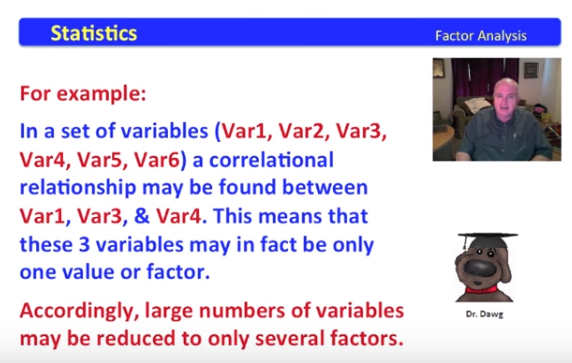
因子分析是一种共线性分析方法,用于在大量变量中寻找和描述潜在因子
因子分析确认变量的共线性,把共线性强的变量归类为一个潜在因子
最早因子分析应用于二战后IQ测试。科学家试图把测试的所有变量综合为一个因子,IQ得分
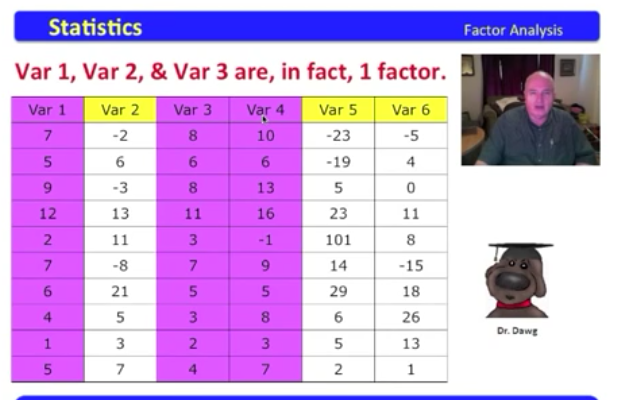
下面表格数据,变量有1-6,其中变量1,3,4有共线性,它们可以融合为一个因子
一般来说,大量变量可以降维到少数几个因子。
紫色的变量1,3,4有共线性,可以归为一个因子
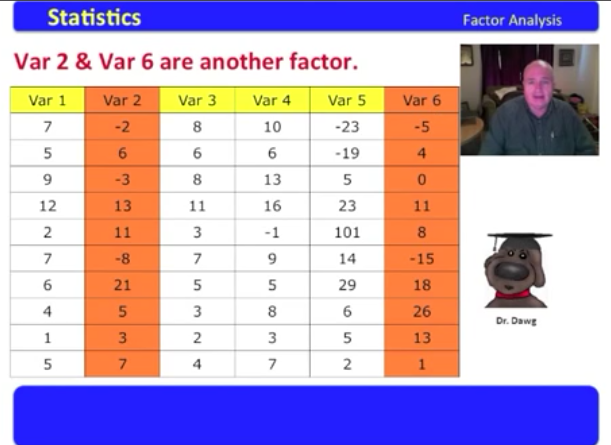
橙色变量2,6有共线性可以归为一个因子
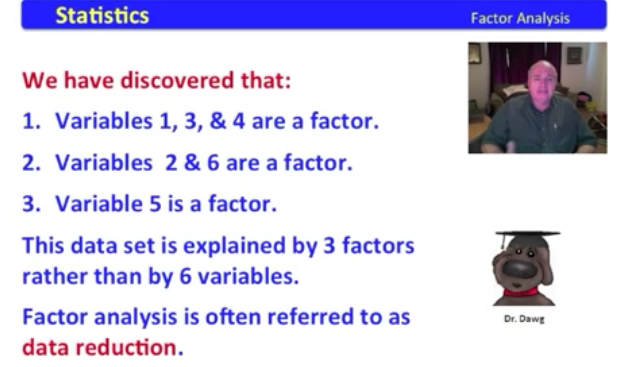
综合上述,变量1,3,4归为一个因子
变量2,6,归为一个因子
变量5归为一个因子
这个数据集的6个变量降低维度到3个因子。
因子分析步骤:
1.因子分析假设条件
2.找到因子的方法
3.决定因子是否重要
4.检验因子里变量的交互性
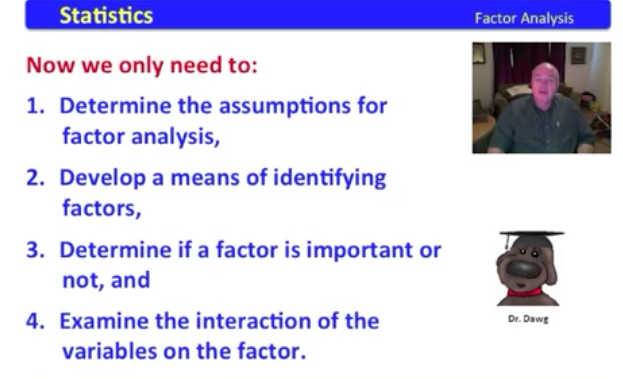
因子分析假设
假设很重要,如果不符合假设条件,则报告可行性很差
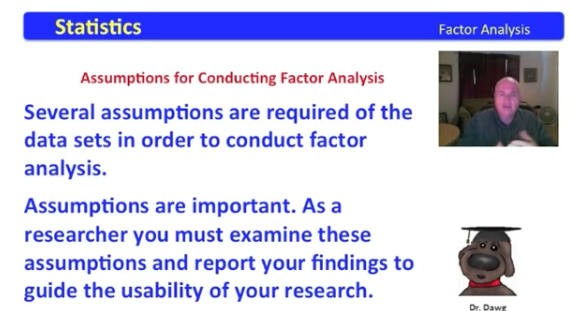
因子分析有6个假设条件
1.没有异常值
2.足够样本量
3.没有完美多重共线性
4.不需要符合方差齐性
5.变量符合线性
6.数据符合间隔性
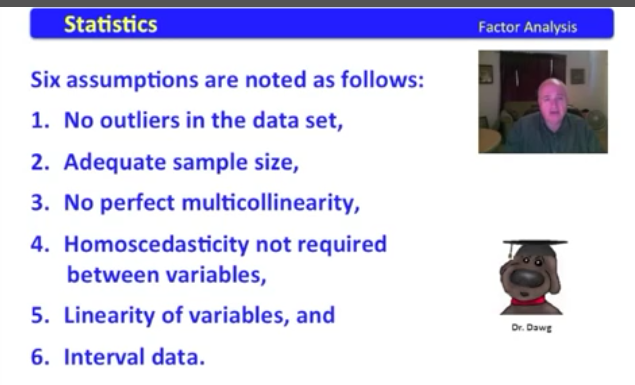
数据没有异常值,下例中1247943太大,属于异常值,应该排除
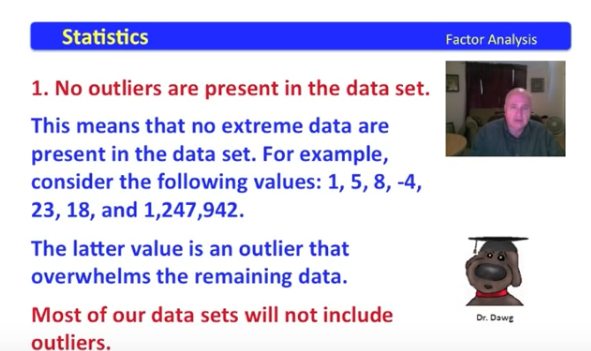
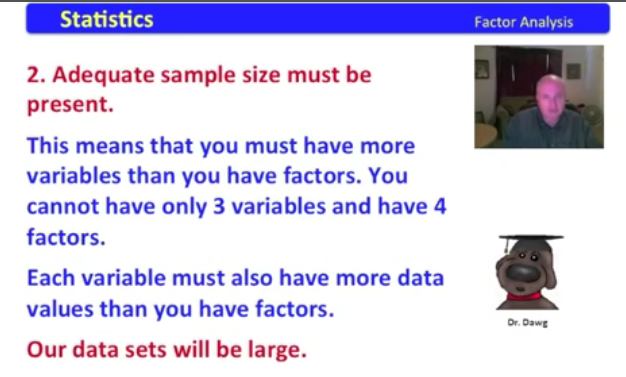
变量数量要多于因子数量
数据不能完全多重共线性
下表数据变量1*2得到变量2,变量1*3得到变量3

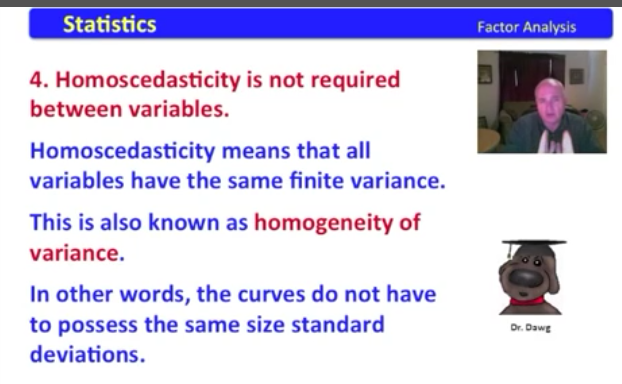
homoscedasticity方差齐性
变量不需要满足方差齐性
变量符合线性,方差分析基于线性前提

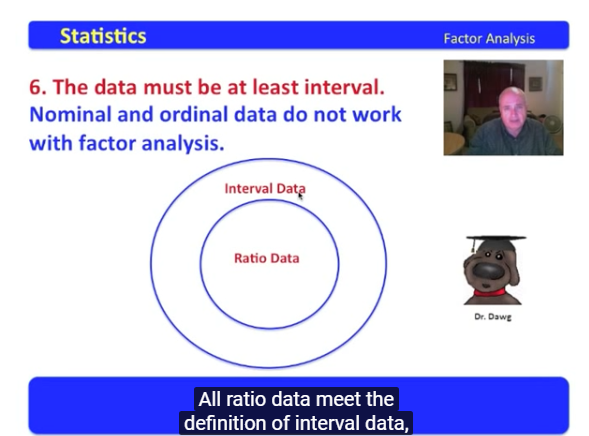
方差分析的变量至少是定距变量
分类变量,例如男女,定序变量1,2,3是均匀等差,也不行
(1) Norminal Data 定类变量:变量的不同取值仅仅代表了不同类的事物,这样的变量叫定类变量。问卷的人口特征中最常使用的问题,而调查被访对象的“性别”,就是 定类变量。对于定类变量,加减乘除等运算是没有实际意义的。
(2) Ordinal Data定序变量:变量的值不仅能够代表事物的分类,还能代表事物按某种特性的排序,这样的变量叫定序变量。问卷的人口特征中最常使用的问题“教育程度“,以及态度量表题目等都是定序变量,定序变量的值之间可以比较大小,或者有强弱顺序,但两个值的差一般没有什么实际意义。
(3)Interval Data 定距变量:变量的值之间可以比较大小,两个值的差有实际意义,这样的变量叫定距变量。有时问卷在调查被访者的“年龄”和“每月平均收入”,都是定距变量。
(4) Ratio Data 定比变量, 有绝对0点,如质量,高度。定比变量与定距变量在市场调查中一般不加以区分,它们的差别在于,定距变量取值为“0”时,不表示“没有”,仅仅是取值为0。定比变量取值为“0”时,则表示“没有”。
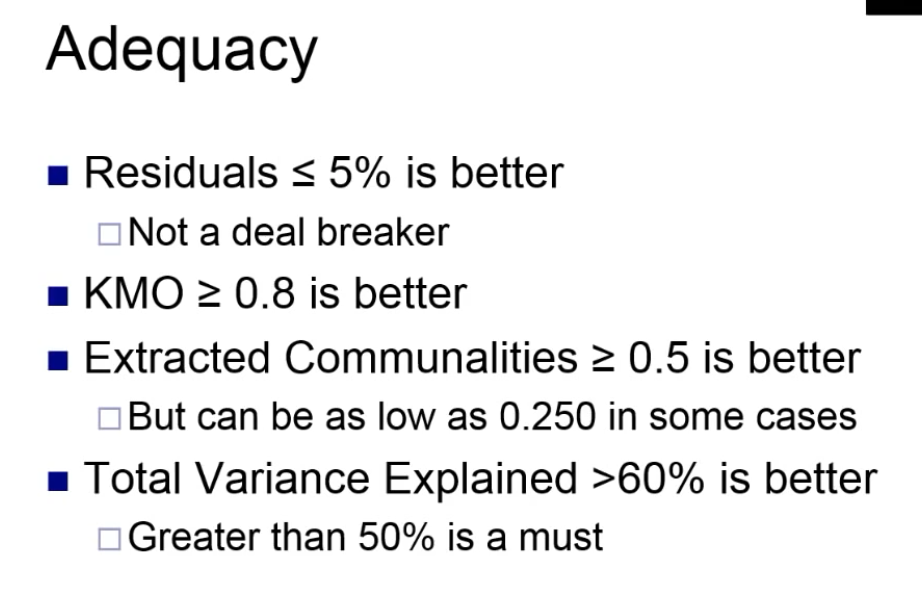
因子分析报告可信度
残差小于5%,KMO大于0.8,解释方差大于60%较好。
教育案例因子分析实例
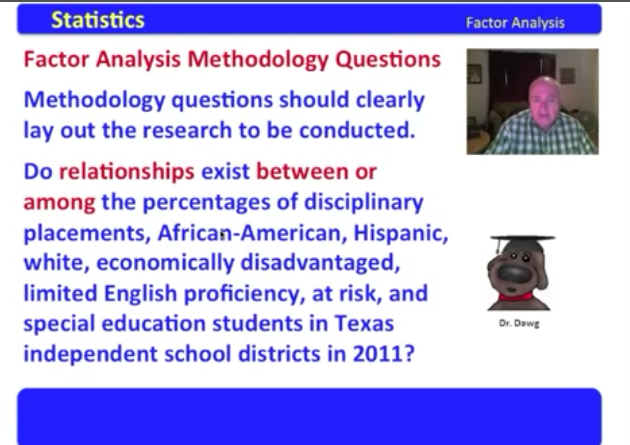
what are the percentages of disciplinary placements,Afican-American,Hispanic,white,economically disadvantaged,limited English proficiency,at risk ,and special education students in Texas independent schooll districts in 2011?
2011年德克萨斯州独立学区的学科配置,非裔美国人,西班牙裔,白人,经济地位不利,英语能力有限,处于风险中,以及特殊教育学生的百分比是多少?
因子分析问题
下面八个变量是否存在相关性?学科配置,非裔美国人,西班牙裔,白人,经济地位不利,英语能力有限,处于风险中,以及特殊教育学生比例
因子分析工具选择:
1.spss
2.python
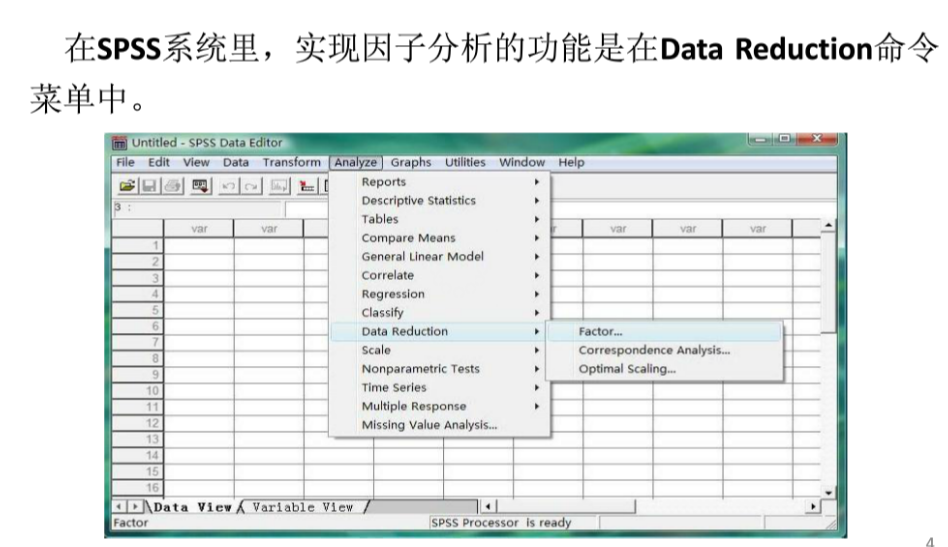
检验五项
1.描述性统计
2.共线矩阵
3.bartlett kmo检验
4.方差总量解释
5. 特征根图
6.旋转成分矩阵

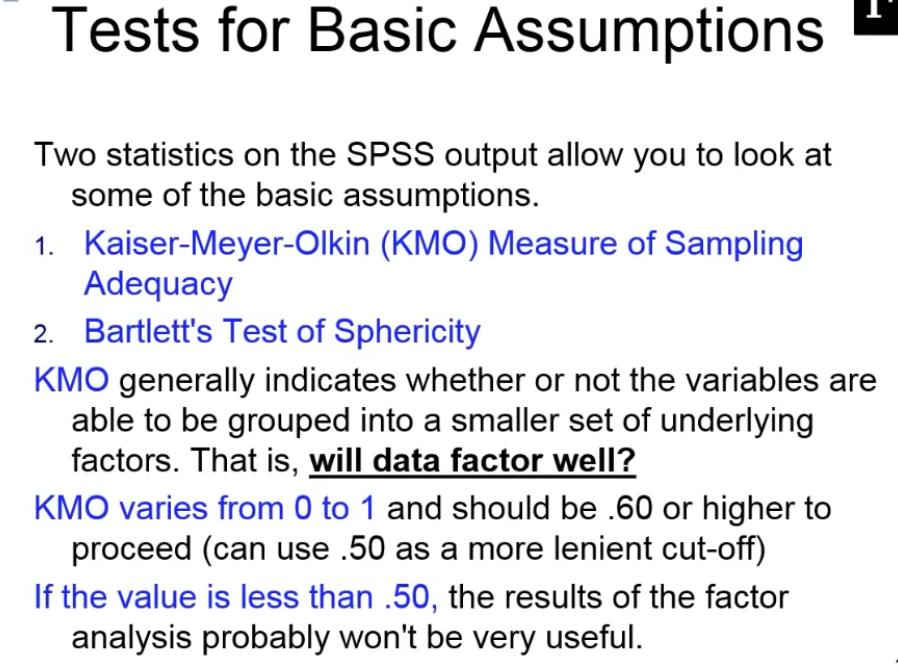
KMO检验
一般KMO值大于0.8参考意义较大
下图KMO值=0.54,说明共线性一般,可以勉强进行因子分析。
bartlett显著性0,拒绝零假设(变量无相关性),得到变量有显著相关性,有时候,bartlett意义不大
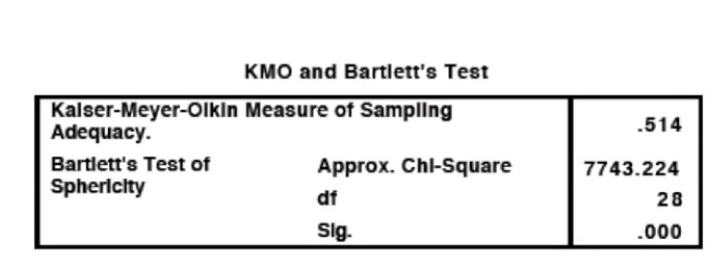
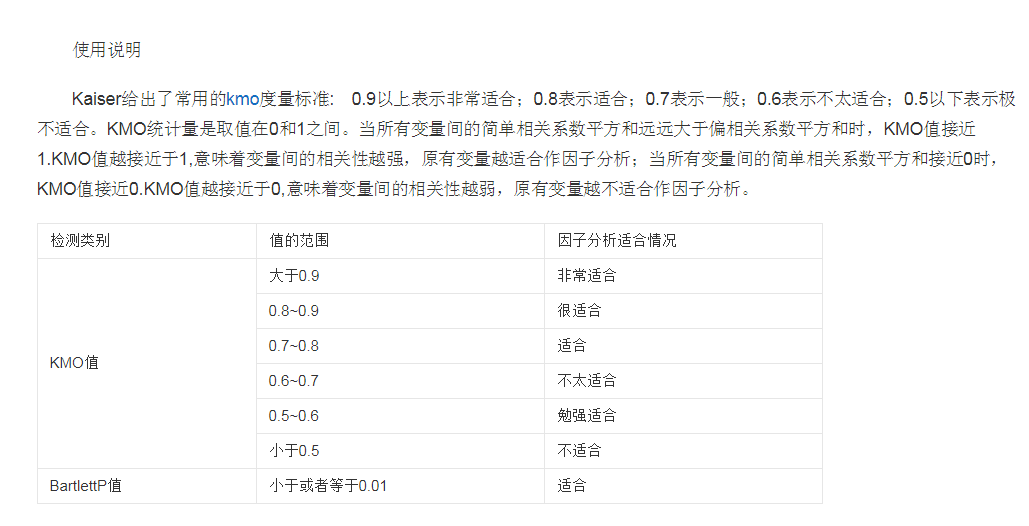
Bartlett's球状检验是一种数学术语。用于检验相关阵中各变量间的相关性,是否为单位阵,即检验各个变量是否各自独立。因子分析前,首先进行KMO检验和巴特利球体检验。在因子分析中,若拒绝原假设,则说明可以做因子分析,若不拒绝原假设,则说明这些变量可能独立提供一些信息,不适合做因子分析。
如果变量间彼此独立,则无法从中提取公因子,也就无法应用因子分析法。Bartlett球形检验判断如果相关阵是单位阵,则各变量独立因子分析法无效。由SPSS检验结果显示Sig.<0.05(即p值<0.05)时,说明各变量间具有相关性,因子分析有效。
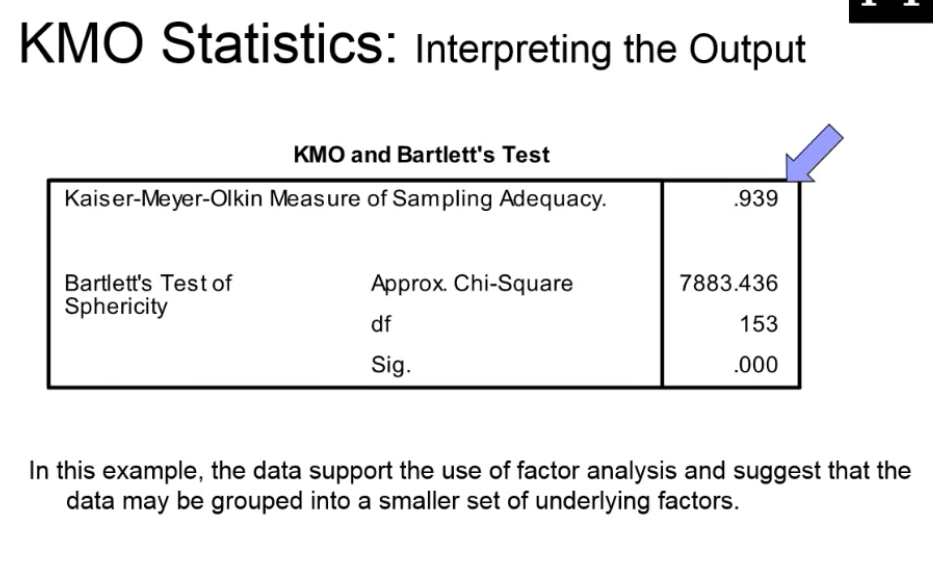
有些情况下,bartlett检验意义不大
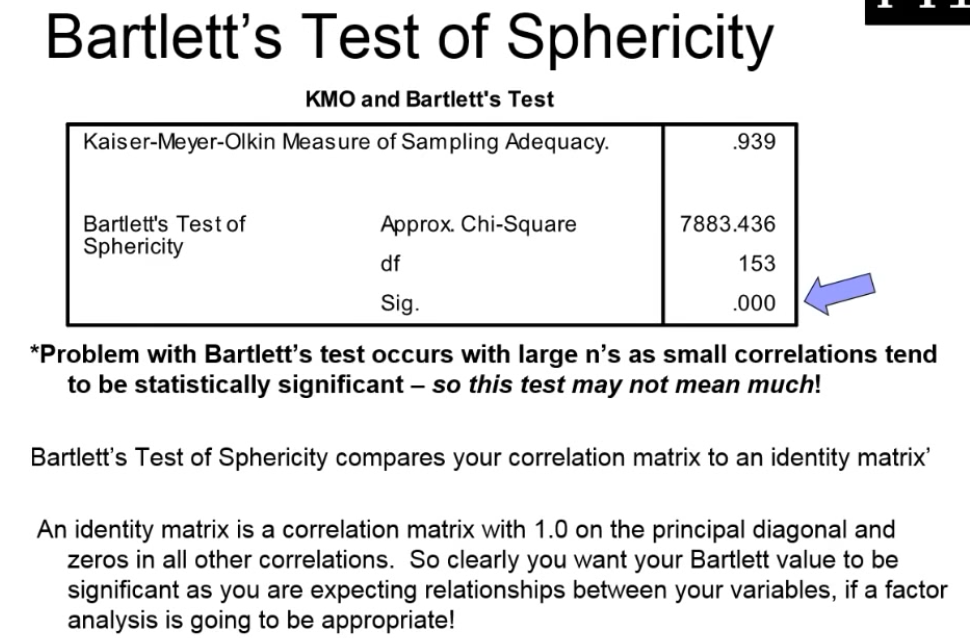
共线矩阵
西班牙后裔比例与黑人比例中度冲突
西班牙后裔比例与白人比例严重冲突
西班牙后裔比例英语水平-0.54相关性,即西班牙后裔英语不好
非洲美国后裔比例与白人30%正相关冲突
英语水平差和经济收入低0.577正相关,与风险因子0.44正相关
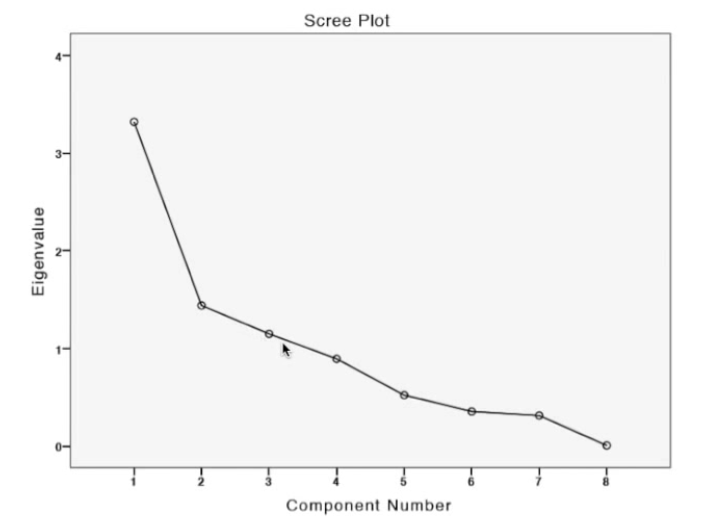
scree plot
纵坐标:特征根值
横坐标:因子数量
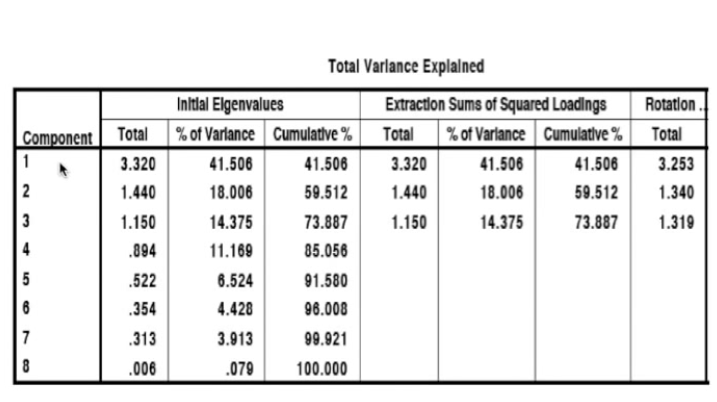
方差解释
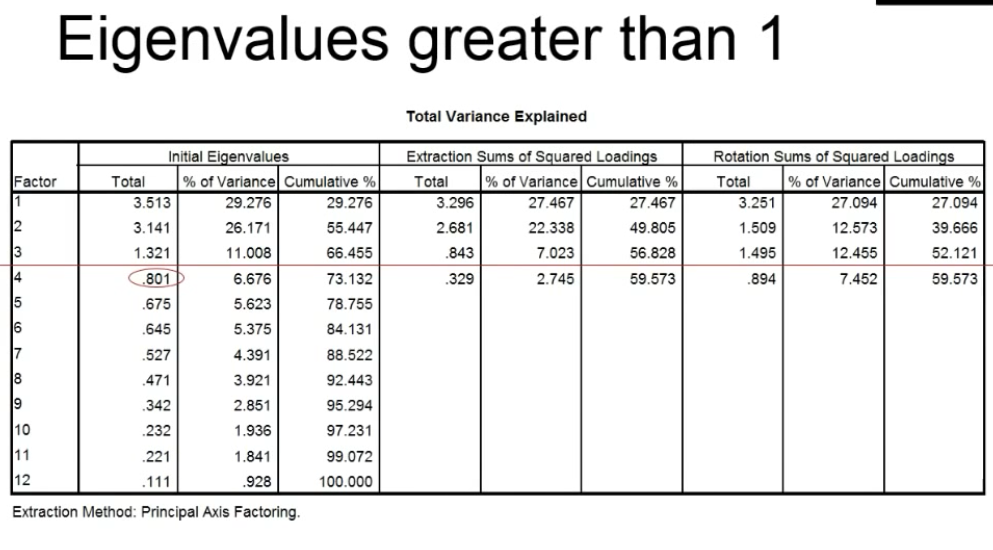
elgenvalue特征根选择大于1的因子,前三个因子特征根大于1,累计解释力度得到73.887%
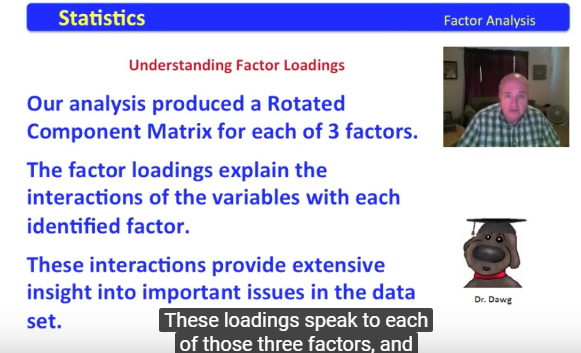
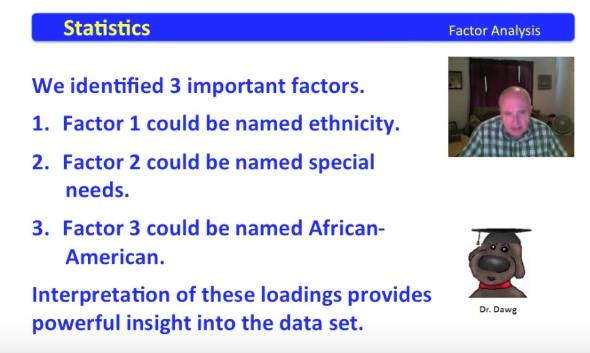
我们的分析产生了3个旋转后的因子
旋转的成分矩阵分析
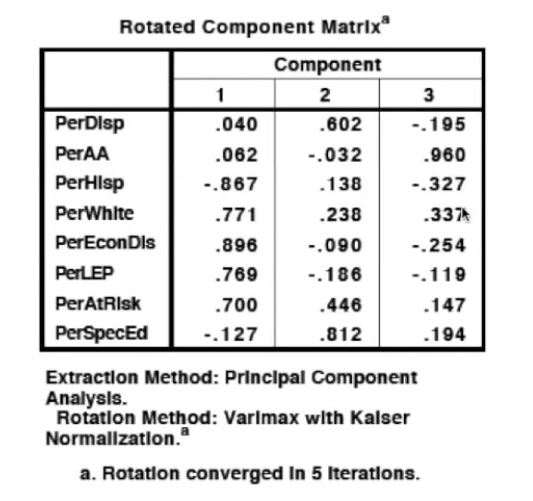
component1:西班牙裔比例,白人比例,黑人比例与经济落后,英语水平低,风险因素比较突出,这些因子可以归类为ethnicity种族问题
第二个因子:特殊需求(special education占比最大0.812)
第三个因子:黑人因子,占比0.96
因子旋转(factor rotation)下图:主成分1的列数来看,所有值都>0.5, 即主成分1能共同解释所有变量,而对每个变量x_i只能解释其中少部分信息,因子含糊不清,需要旋转。 而且主成分1解释了:财政收入,固定资产投资,社会消费品零售总额, 这三个变量难以综合解释。
旋转后,因子1能解释2,3,4,6变量,含义比旋转前要清晰。
因子1:财政收入,固定资产投资,年末总人口,社会消费品零售总额 -------命名为:经济水平
因子2:人均GDP,居民消费水平--------命名为:消费水平
因子旋转的目的使因子含义更加清楚,以便对因子命名和解释。
旋转方法:正交旋转和斜交旋转。
正交旋转是指坐标轴总是保持垂直90度旋转,这样新生成因子可保持不变。
斜交旋转坐标轴夹角是任意的,生成因子不能保证不相关。
实际中更多应用正交旋转Varimax法。
旋转方法:
Varimax
quartimax
equamax
direct oblimin(斜交旋转)
数学模型 设原始的p个变量为x1,x2......x_p, 要寻找k个因子(k<p)为f1, f2, .......f_k,因子f_i和原始变量x_i的关系可表示为
载荷 a_ij
含义与主成分类似。 a_ij为第i个变量x_i与第j个因子f_j之间的线性相关系数,反映x_i和f_j之间的相关程度,也称载荷。
f_i:公因子common factor
因子f_i出现在每个原始变量与因子的线性组合中,称为公因子。
特殊因子:代表公因子以外因素影响。
共同度量:h_i**2
考察x_i的信息能够被k个公因子所解释的程度。它是用k个公因子对第i个变量的方差贡献率来表示的,称为变量x_i的共同度量(communality)
计算公式如下图:
共同度量值越大,说明提出的公因子对原始变量的解释能力越强。
方差贡献率:
:第j个公因子的方差贡献率g_j**2
方差贡献率表示第j个 公因子对变量x_i所提供的方差总和,反应了第j个公因子的相对重要程度。方差贡献率越大表明该公因子对x_i的贡献越大。
变量共同度量表,由该表可知,所有变量的共同度量都是在90%以上,因此提取的公因子对原始变量解释力很强。
因子得分
程序自动统计得到结果

因子得分(factor score)
因子得分是各变量的线性组合。

经过程序运算,x_i不是原始变量,而是标准化变量


f1=[-0.105,0.18,0.3,0.372,-0.104,0.281]
运算结果和答案不符合,说明 x_i不是原始变量,而是标准化变量
特征根 eigenvalues['aɪgən,væljuː]
表中初始特征值就是特征根,实际上就是本例中的6个主轴长度。
特征根 eigenvalues
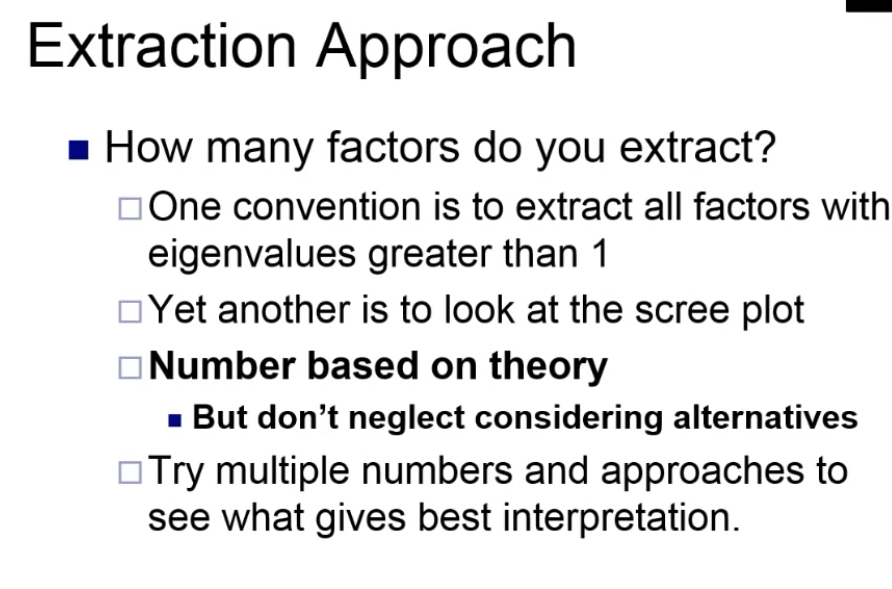
---即主轴或方差,当特征根小于1时,就不再选作主成分了。选择特征根大于1的值
主成分的累计方差贡献率达到80%以上的前几个主成分,都可以选作最后的主成分。
碎石图scree plot
scree[skriː] 小石子;岩屑堆
A scree plot displays the eigenvalues associated with a component or factor in descending order versus the number of the component or factor. You can use scree plots in principal components analysis and factor analysis to visually assess which components or factors explain most of the variability in the data. 碎石图用于主成分分析或因子分析
横轴是因子,纵轴是特征值
观察第五个因素后,斜率慢慢变缓,前五个因素解释了大部分原因。
A factor analysis was conducted on 12 different characteristics of job applicants. This scree plot shows that 5 of those factors explain most of the variability because the line starts to straighten after factor 5. The remaining factors explain a very small proportion of the variability and are likely unimportant.
The ideal pattern in a scree plot is a steep curve, followed by a bend and then a flat or horizontal line. Retain those components or factors in the steep curve before the first point that starts the flat line trend. You might have difficulty interpreting a scree plot. Use your knowledge of the data and the results from the other approaches of selecting components or factors to help decide the number of important components or factors.
碎石图中,前三个因子特征根值大于1,可以被筛选

载荷图Loading Plot
-
The
loading plot is a plot of the relationship between the original variables and the subspace dimension. It is used to interpret relationships between variables.载荷图解释原始变量和主成分关系
横坐标表示第一主成分与原始变量之间的相关系数;纵轴表示第二主成分与原始变量之间相关系数。
这样每个变量对应的主成分载荷就对应坐标系中一个点,比如,人均GDP变量对应点是(0.67,0.725)。这样6个变量就有6个点。相关系数的点越远离坐标轴原点,主成分对原始变量的代表性就越大。
图中,人均GDP和居民消费水平几乎重合
主成分分析-降维
主成分分析principal component analysis
通过考察变量相关性,找到几个主成分(principal component)来代表原来的多个变量。
同时使她们尽量保留原始变量的信息。
这些变量 彼此不相关,数量远少于原始变量个数,从而达到数据降维目的。
图中可见两个变量x1和x2存在相关关系,它们信息有重叠。如果把两个变量用一个新的变量表示,同时这一新变量可能包含原来的两个变量的信息,这就是降维过程。
散点图形成一个椭圆形轮廓,包含一个长轴和一个短轴,称为主轴。
在椭圆长轴方向,数据变化大,携带大部分数据变化信息。
在椭圆短轴方向,数据变化小。携带小部分数据变化信息。
因此用长轴y1方向就可以代表原来x1和x2两个变量信息,这样两个变量降维到一个变量,达到降维目的。
椭圆中,长短轴相差越大,长轴变量代表性就越好 ,降维越合理。
多维变量情形类似,只不过是一个高维椭圆,无法直接观察。由于每个变量有一个坐标轴,因此有几个变量就有几个主轴。
首先找出椭圆球各个主轴,再用代表大多数数据信息的最长几个轴作为新变量,这样降维就完成了。
找出的新变量是原来变量的线性组合,叫做主成分。
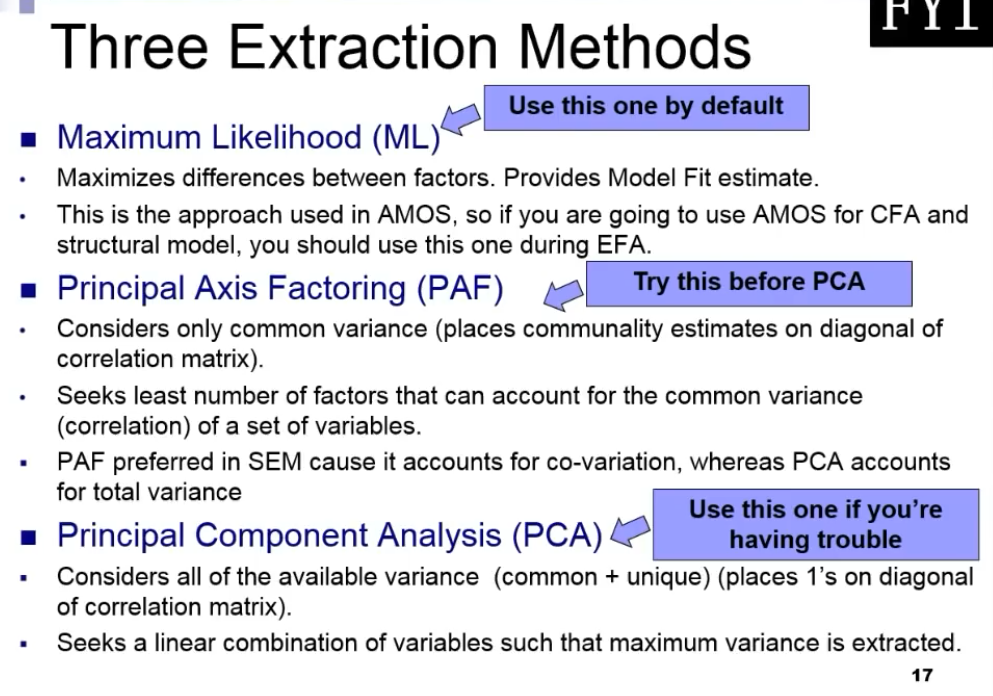
三个提取因子方法

实战
实战1-寻找美国总统因子
变量包括:年龄,性别,种族等等
性别,种族属于分类变量,不适合因子分析

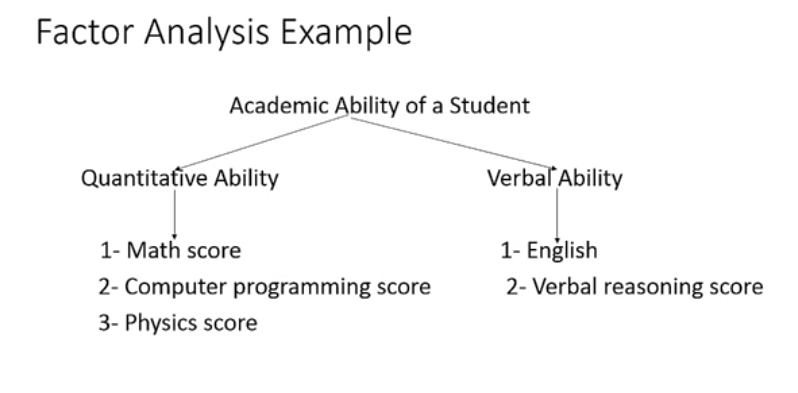
学生教学能力分为两个因子:
量化能力:数学得分,编程得分,物理得分
口语能力:英语,言语推理得分
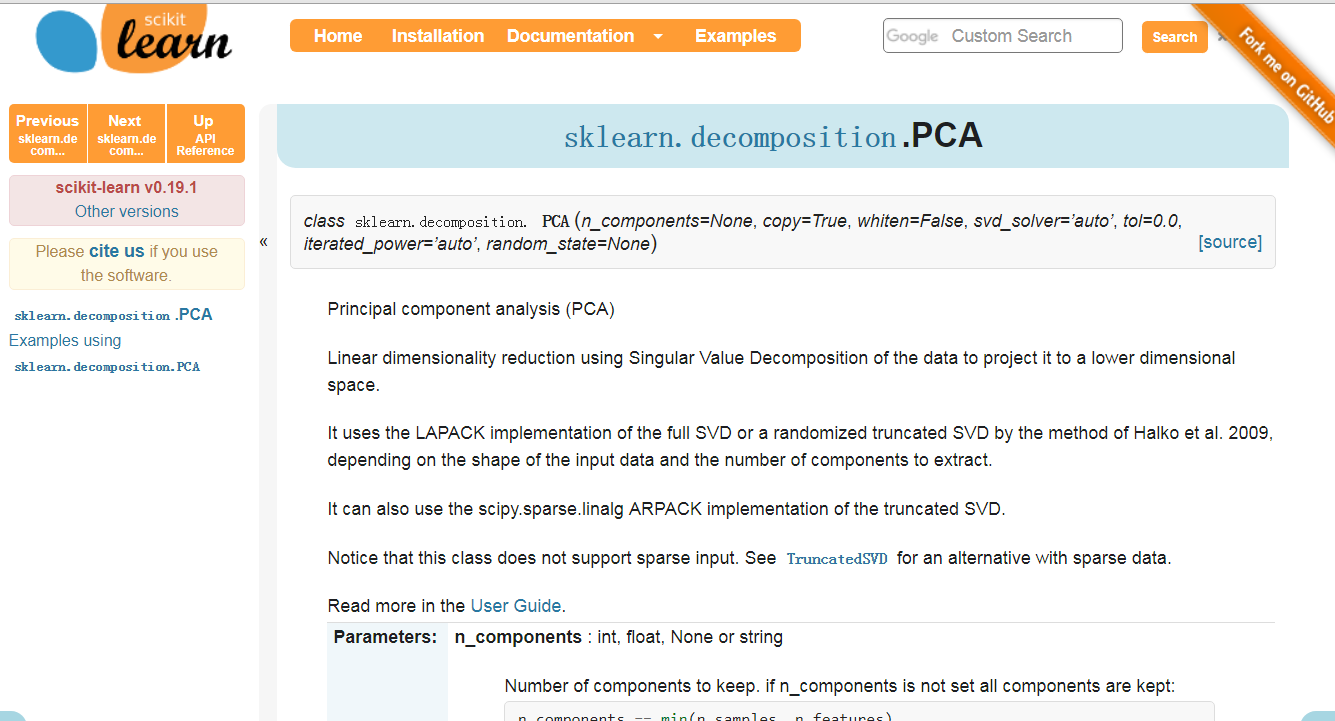
sklearn主成分官网
http://scikit-learn.org/stable/modules/generated/sklearn.decomposition.PCA.html
sklearn.decomposition.PCA 中文介绍网址
https://www.cnblogs.com/pinard/p/6243025.html
1. scikit-learn PCA类介绍
在scikit-learn中,与PCA相关的类都在sklearn.decomposition包中。最常用的PCA类就是sklearn.decomposition.PCA,我们下面主要也会讲解基于这个类的使用的方法。
除了PCA类以外,最常用的PCA相关类还有KernelPCA类,在原理篇我们也讲到了,它主要用于非线性数据的降维,需要用到核技巧。因此在使用的时候需要选择合适的核函数并对核函数的参数进行调参。
另外一个常用的PCA相关类是IncrementalPCA类,它主要是为了解决单机内存限制的。有时候我们的样本量可能是上百万+,维度可能也是上千,直接去拟合数据可能会让内存爆掉, 此时我们可以用IncrementalPCA类来解决这个问题。IncrementalPCA先将数据分成多个batch,然后对每个batch依次递增调用partial_fit函数,这样一步步的得到最终的样本最优降维。
此外还有SparsePCA和MiniBatchSparsePCA。他们和上面讲到的PCA类的区别主要是使用了L1的正则化,这样可以将很多非主要成分的影响度降为0,这样在PCA降维的时候我们仅仅需要对那些相对比较主要的成分进行PCA降维,避免了一些噪声之类的因素对我们PCA降维的影响。SparsePCA和MiniBatchSparsePCA之间的区别则是MiniBatchSparsePCA通过使用一部分样本特征和给定的迭代次数来进行PCA降维,以解决在大样本时特征分解过慢的问题,当然,代价就是PCA降维的精确度可能会降低。使用SparsePCA和MiniBatchSparsePCA需要对L1正则化参数进行调参。
2. sklearn.decomposition.PCA参数介绍
下面我们主要基于sklearn.decomposition.PCA来讲解如何使用scikit-learn进行PCA降维。PCA类基本不需要调参,一般来说,我们只需要指定我们需要降维到的维度,或者我们希望降维后的主成分的方差和占原始维度所有特征方差和的比例阈值就可以了。
现在我们对sklearn.decomposition.PCA的主要参数做一个介绍:
1)n_components:这个参数可以帮我们指定希望PCA降维后的特征维度数目。最常用的做法是直接指定降维到的维度数目,此时n_components是一个大于等于1的整数。当然,我们也可以指定主成分的方差和所占的最小比例阈值,让PCA类自己去根据样本特征方差来决定降维到的维度数,此时n_components是一个(0,1]之间的数。当然,我们还可以将参数设置为"mle", 此时PCA类会用MLE算法根据特征的方差分布情况自己去选择一定数量的主成分特征来降维。我们也可以用默认值,即不输入n_components,此时n_components=min(样本数,特征数)。
2)whiten :判断是否进行白化。所谓白化,就是对降维后的数据的每个特征进行归一化,让方差都为1.对于PCA降维本身来说,一般不需要白化。如果你PCA降维后有后续的数据处理动作,可以考虑白化。默认值是False,即不进行白化。
3)svd_solver:即指定奇异值分解SVD的方法,由于特征分解是奇异值分解SVD的一个特例,一般的PCA库都是基于SVD实现的。有4个可以选择的值:{‘auto’, ‘full’, ‘arpack’, ‘randomized’}。randomized一般适用于数据量大,数据维度多同时主成分数目比例又较低的PCA降维,它使用了一些加快SVD的随机算法。 full则是传统意义上的SVD,使用了scipy库对应的实现。arpack和randomized的适用场景类似,区别是randomized使用的是scikit-learn自己的SVD实现,而arpack直接使用了scipy库的sparse SVD实现。默认是auto,即PCA类会自己去在前面讲到的三种算法里面去权衡,选择一个合适的SVD算法来降维。一般来说,使用默认值就够了。
除了这些输入参数外,有两个PCA类的成员值得关注。第一个是explained_variance_,它代表降维后的各主成分的方差值。方差值越大,则说明越是重要的主成分。第二个是explained_variance_ratio_,它代表降维后的各主成分的方差值占总方差值的比例,这个比例越大,则越是重要的主成分。
SVD奇异值分解的基本原理和运用
https://www.cnblogs.com/NextNight/p/6212575.html
SVD奇异值分解:
SVD是一种可靠的正交矩阵分解法。可以把A矩阵分解成U,∑,VT三个矩阵相乘的形式。(Svd(A)=[U*∑*VT],A不必是方阵,U,VT必定是正交阵,S是对角阵<以奇异值为对角线,其他全为0>)
用途:
信息检索(LSA:隐性语义索引,LSA:隐性语义分析),分解后的奇异值代表了文章的主题或者概念,信息检索的时候同义词,或者说同一主题下的词会映射为同一主题,这样就可以提高搜索效率
数据压缩:通过奇异值分解,选择能量较大的前N个奇异值来代替所有的数据信息,这样可以降低噪声,节省空间。
推荐系统:主要是降噪,矩阵变换至低维空间,方便计算(目前没有意识到它对推荐精确度的提升有什么具体作用)。
原理:矩阵分解,矩阵变换,数据降维
2、PCA对象的属性
3、PCA对象的方法
- fit(X,y=None)
- fit_transform(X)
- inverse_transform()
- transform(X)
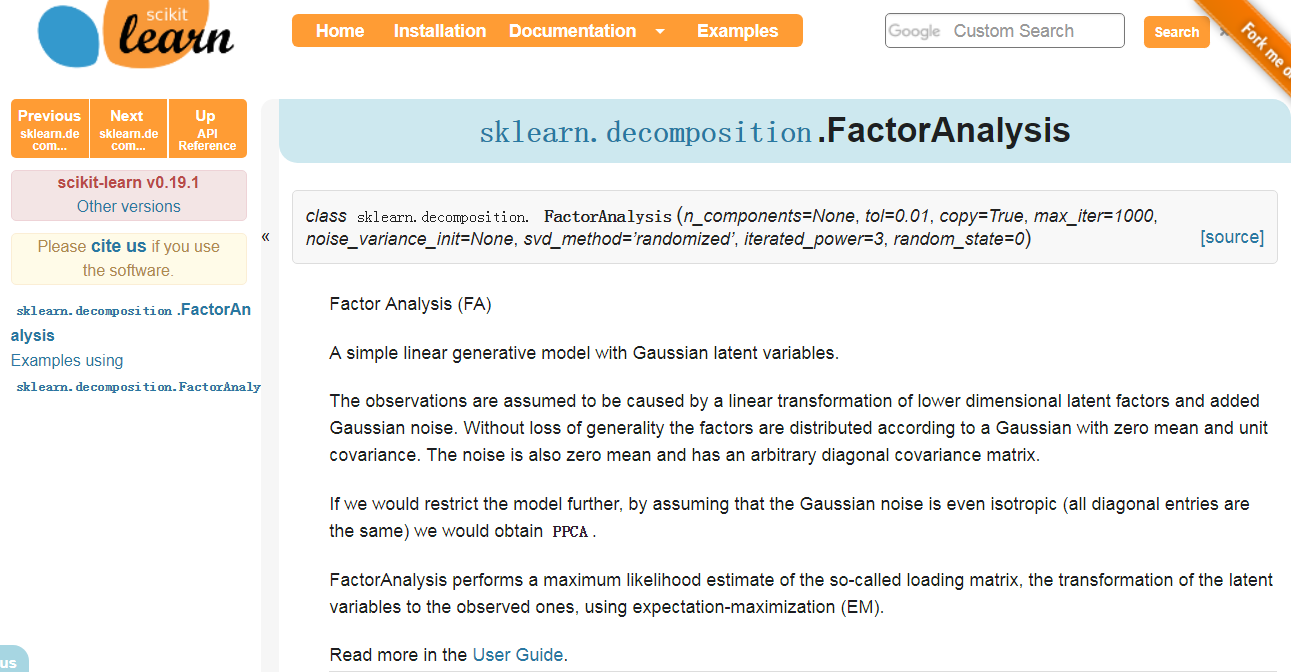
sklearn 因子分析官网
http://scikit-learn.org/stable/modules/generated/sklearn.decomposition.FactorAnalysis.html
3. PCA实例
下面我们用一个实例来学习下scikit-learn中的PCA类使用。为了方便的可视化让大家有一个直观的认识,我们这里使用了三维的数据来降维。
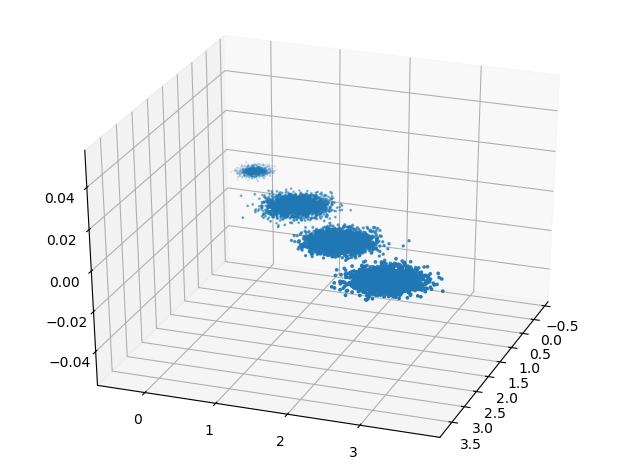
首先我们生成随机数据并可视化,代码如下:
import numpy as np
import matplotlib.pyplot as plt
from mpl_toolkits.mplot3d import Axes3D
%matplotlib inline
from sklearn.datasets.samples_generator import make_blobs
# X为样本特征,Y为样本簇类别, 共1000个样本,每个样本3个特征,共4个簇
X, y = make_blobs(n_samples=10000, n_features=3, centers=[[3,3, 3], [0,0,0], [1,1,1], [2,2,2]], cluster_std=[0.2, 0.1, 0.2, 0.2],
                  random_state =9)
fig = plt.figure()
ax = Axes3D(fig, rect=[0, 0, 1, 1], elev=30, azim=20)
plt.scatter(X[:, 0], X[:, 1], X[:, 2],marker='o')
三维数据的分布图如下:

我们先不降维,只对数据进行投影,看看投影后的三个维度的方差分布,代码如下:
from sklearn.decomposition import PCA
pca = PCA(n_components=3)
pca.fit(X)
print pca.explained_variance_ratio_
print pca.explained_variance_
输出如下:
[ 0.98318212 0.00850037 0.00831751]
[ 3.78483785 0.03272285 0.03201892]
可以看出投影后三个特征维度的方差比例大约为98.3%:0.8%:0.8%。投影后第一个特征占了绝大多数的主成分比例。
现在我们来进行降维,从三维降到2维,代码如下:
pca = PCA(n_components=2)
pca.fit(X)
print pca.explained_variance_ratio_
print pca.explained_variance_
输出如下:
[ 0.98318212 0.00850037]
[ 3.78483785 0.03272285]
这个结果其实可以预料,因为上面三个投影后的特征维度的方差分别为:[ 3.78483785 0.03272285 0.03201892],投影到二维后选择的肯定是前两个特征,而抛弃第三个特征。
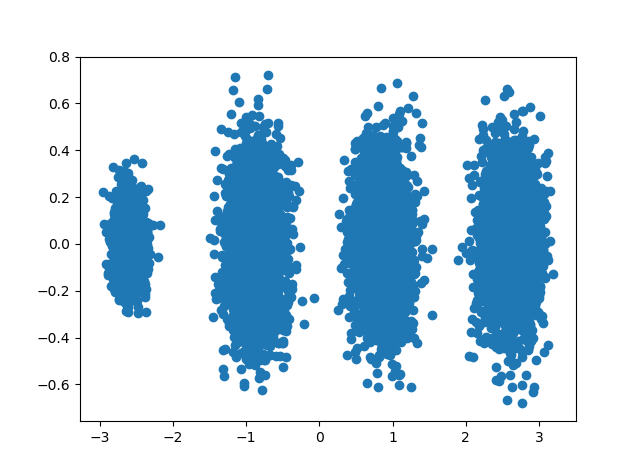
为了有个直观的认识,我们看看此时转化后的数据分布,代码如下:
X_new = pca.transform(X)
plt.scatter(X_new[:, 0], X_new[:, 1],marker='o')
plt.show()
输出的图如下:
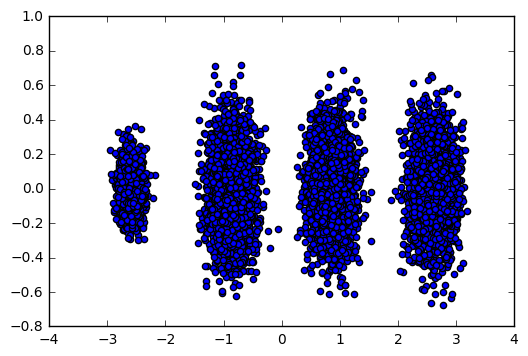
可见降维后的数据依然可以很清楚的看到我们之前三维图中的4个簇。
现在我们看看不直接指定降维的维度,而指定降维后的主成分方差和比例。
pca = PCA(n_components=0.95)
pca.fit(X)
print pca.explained_variance_ratio_
print pca.explained_variance_
print pca.n_components_
我们指定了主成分至少占95%,输出如下:
可见只有第一个投影特征被保留。这也很好理解,我们的第一个主成分占投影特征的方差比例高达98%。只选择这一个特征维度便可以满足95%的阈值。我们现在选择阈值99%看看,代码如下:
pca = PCA(n_components=0.99) pca.fit(X) print pca.explained_variance_ratio_ print pca.explained_variance_ print pca.n_components_
此时的输出如下:
[ 0.98318212 0.00850037] [ 3.78483785 0.03272285] 2
这个结果也很好理解,因为我们第一个主成分占了98.3%的方差比例,第二个主成分占了0.8%的方差比例,两者一起可以满足我们的阈值。
最后我们看看让MLE算法自己选择降维维度的效果,代码如下:
pca = PCA(n_components='mle') pca.fit(X) print pca.explained_variance_ratio_ print pca.explained_variance_ print pca.n_components_
输出结果如下:
[ 0.98318212]
[ 3.78483785]
1
可见由于我们的数据的第一个投影特征的方差占比高达98.3%,MLE算法只保留了我们的第一个特征。
# -*- coding: utf-8 -*-
"""
Created on Thu Apr 5 22:44:32 2018
@author: Administrator
"""
from sklearn.datasets import load_breast_cancer
from sklearn.decomposition import PCA
import numpy as np
X = np.array([[-1, -1], [-2, -1], [-3, -2], [1, 1], [2, 1], [3, 2]])
pca = PCA(n_components=2)
pca.fit(X)
#保留两个因子
PCA(copy=True, n_components=2, whiten=False)
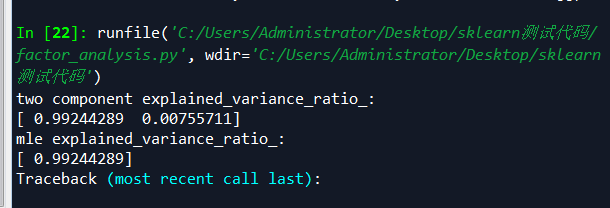
#可以看到第一个特征的单个变量方差贡献率已经到达0.99,意味着几乎保留了所有的信息。所以只保留一个特征即可
print("two component explained_variance_ratio_:")
print(pca.explained_variance_ratio_)
'''
[ 0.99244289 0.00755711]
'''
#自动保留因子,现在我们将n_components设置成"mle",发现自动保留了一个特征。
pca_auto=PCA(n_components='mle')
pca_auto.fit(X)
print("mle explained_variance_ratio_:")
print(pca_auto.explained_variance_ratio_)
'''
[ 0.99244289]
'''
pca1=PCA(n_components=1)
#返回降维后的数据newData
newData=pca1.fit_transform(X)
#将降维后的数据转换成原始数据,X=pca.inverse_transform(newX)
#测试结果不对
original_data=pca1.inverse_transform(newData)
'''
cancer=load_breast_cancer()
data=cancer.data
pca_cancer=PCA(n_components='mle')
pca_cancer.fit(data)
print("cancer data explained_variance_ratio_:")
print(pca_cancer.explained_variance_ratio_)
'''
乳腺癌分类器因子分析脚本
- # -*- coding: utf-8 -*-
- """
- Created on Thu Apr 5 23:32:12 2018
- @author: Administrator
- """
-
- import numpy as np
- import matplotlib.pyplot as plt
-
- from sklearn import linear_model, decomposition, datasets
- from sklearn.pipeline import Pipeline
- from sklearn.model_selection import GridSearchCV
- from sklearn.datasets import load_breast_cancer
-
- cancer=load_breast_cancer()
-
- logistic = linear_model.LogisticRegression()
-
- pca = decomposition.PCA()
- pipe = Pipeline(steps=[('pca', pca), ('logistic', logistic)])
-
- digits = load_breast_cancer()
- X_digits = cancer.data
- y_digits = digits.target
-
- # Plot the PCA spectrum
- pca.fit(X_digits)
-
- plt.figure(1, figsize=(4, 3))
- plt.clf()
- plt.axes([.2, .2, .7, .7])
- plt.plot(pca.explained_variance_, linewidth=2)
- plt.axis('tight')
- plt.xlabel('n_components')
- plt.ylabel('explained_variance_')
-
- # Prediction
- n_components = [10, 20, 30]
- Cs = np.logspace(-4, 4, 3)
-
- # Parameters of pipelines can be set using ‘__’ separated parameter names:
- estimator = GridSearchCV(pipe,
- dict(pca__n_components=n_components,
- logistic__C=Cs))
- estimator.fit(X_digits, y_digits)
-
- plt.axvline(estimator.best_estimator_.named_steps['pca'].n_components,
- linestyle=':', label='n_components chosen')
- plt.legend(prop=dict(size=12))
- plt.show()
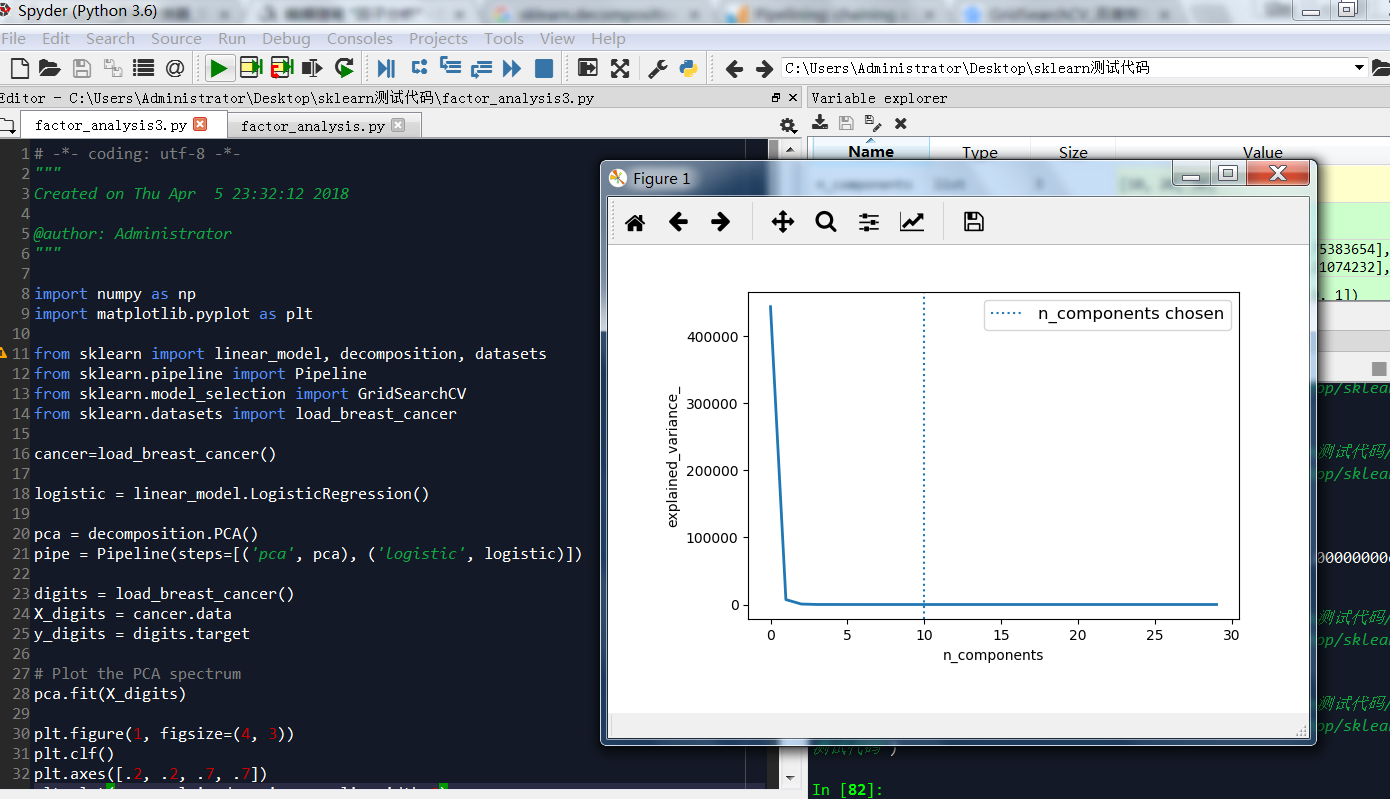
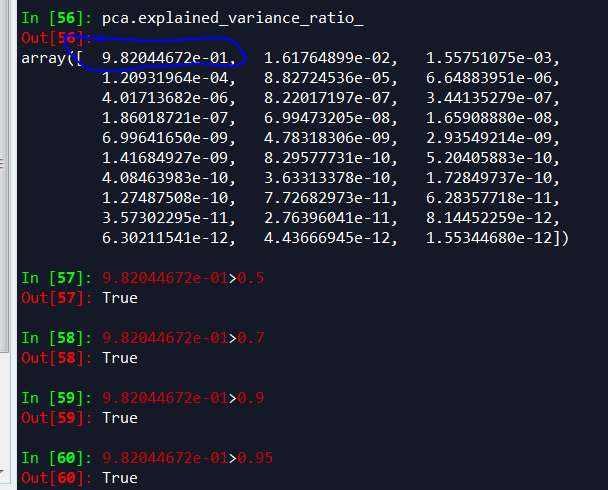
我们可以看到,取第一个因子就可以解释95%方差了。
乳腺癌细胞数据,下面脚本解释了一个主成分就解释了0.98以上癌细胞方差,这和随机森林效果类似,spss和python统计结果相差较大。spss提供因子解读效果好,python计算的值更加准确,乳腺癌细胞,一个特征因子就可以解释0.98成分。
# -*- coding: utf-8 -*-
"""
Created on Thu Apr 5 23:32:12 2018
@author: Administrator
pca =PCA(n_components='mle')报错
elif n_components >= 1 and n_components < .8 * min(X.shape):
TypeError: '>=' not supported between instances of 'str' and 'int'
"""
import numpy as np
import matplotlib.pyplot as plt
from sklearn import linear_model, decomposition, datasets
from sklearn.pipeline import Pipeline
from sklearn.model_selection import GridSearchCV
from sklearn.datasets import load_breast_cancer
from sklearn.decomposition import PCA
cancer=load_breast_cancer()
pca =PCA(n_components=0.98)
#pca= PCA(n_components='mle')
digits = load_breast_cancer()
X_digits = cancer.data
y_digits = digits.target
# Plot the PCA spectrum
pca.fit(X_digits)
print (pca.explained_variance_ratio_)
print (pca.explained_variance_)
print (pca.n_components_)
#计算协方差
pca.get_covariance()
#Estimated precision of data.计算数据估计的准确性
pca.get_precision()
'''
返回模型参数
{'copy': True,
'iterated_power': 'auto',
'n_components': 0.98,
'random_state': None,
'svd_solver': 'auto',
'tol': 0.0,
'whiten': False}
'''
pca.get_params(deep=True)
#返回降维后的数据
new_data=pca.fit_transform(X_digits)
#返回原始数据,测试结果和原始数据不一致
origin_data=pca.inverse_transform(new_data)
PCA随机数测试脚本
- # -*- coding: utf-8 -*-
- """
- Created on Sun Apr 8 23:39:10 2018
- @author: Administrator
- scikit中的make_blobs方法常被用来生成聚类算法的测试数据,直观地说,make_blobs会根据
- 用户指定的特征数量、中心点数量、范围等来生成几类数据,这些数据可用于测试聚类算法的效果
- """
-
- import numpy as np
- import matplotlib.pyplot as plt
- from mpl_toolkits.mplot3d import Axes3D
- from sklearn.datasets.samples_generator import make_blobs
-
- from sklearn.decomposition import PCA
-
-
- # X为样本特征,Y为样本簇类别, 共1000个样本,每个样本3个特征,共4个簇
- X, y = make_blobs(n_samples=10000, n_features=3, centers=[[3,3, 3], [0,0,0], [1,1,1], [2,2,2]], cluster_std=[0.2, 0.1, 0.2, 0.2],
- random_state =9)
- fig = plt.figure()
- ax = Axes3D(fig, rect=[0, 0, 1, 1], elev=30, azim=20)
- plt.scatter(X[:, 0], X[:, 1], X[:, 2],marker='o')
-
- '''
- 我们先不降维,只对数据进行投影,看看投影后的三个维度的方差分布.
- 可以看出投影后三个特征维度的方差比例大约为98.3%:0.8%:0.8%。投影后第一个特征占了绝大多数的主成分比例。
- '''
- pca = PCA(n_components=3)
- pca.fit(X)
- print (pca.explained_variance_ratio_)
- print (pca.explained_variance_)
-
- '''
- 现在我们来进行降维,从三维降到2维
- '''
- pca1 = PCA(n_components=2)
- pca1.fit(X)
- print (pca1.explained_variance_ratio_)
- print (pca1.explained_variance_)
-
- '''
- 可见降维后的数据依然可以很清楚的看到我们之前三维图中的4个簇
- '''
- X_new = pca1.transform(X)
- plt.scatter(X_new[:, 0], X_new[:, 1],marker='o')
- plt.show()
-
- '''
- 现在我们看看不直接指定降维的维度,而指定降维后的主成分方差和比例
- 我们指定了主成分至少占95%,输出如下:
- [ 0.98318212]
- [ 3.78483785]
- 1
- 可见只有第一个投影特征被保留。这也很好理解,我们的第一个主成分占投影特征的方差比例高达98%。
- 只选择这一个特征维度便可以满足95%的阈值。
- '''
- pca2 = PCA(n_components=0.95)
- pca2.fit(X)
- print (pca2.explained_variance_ratio_)
- print (pca2.explained_variance_)
- print (pca2.n_components_)
-
- '''
- 我们现在选择阈值99%看看
- 此时的输出如下:
- [ 0.98318212 0.00850037]
- [ 3.78483785 0.03272285]
- 2
- 这个结果也很好理解,因为我们第一个主成分占了98.3%的方差比例,第二个主成分占了0.8%的方差比例,两者一起可以满足我们的阈值。
- '''
- pca3 = PCA(n_components=0.99)
- pca3.fit(X)
- print (pca3.explained_variance_ratio_)
- print (pca3.explained_variance_)
- print (pca3.n_components_)
-
- '''
- 最后我们看看让MLE算法自己选择降维维度的效果
- 输出结果如下:
- [ 0.98318212]
- [ 3.78483785]
- 1
- 可见由于我们的数据的第一个投影特征的方差占比高达98.3%,MLE算法只保留了我们的第一个特征。
- '''
- pca4 = PCA(n_components='mle')
- #pca4 = PCA()
- pca4.fit(X)
- print (pca4.explained_variance_ratio_)
- print (pca4.explained_variance_)
- print (pca4.n_components_)
人脸识别实战
测试后准确率不是百分之百
算法步骤:
1.用主成分对1850个特征值降维
2.用svc向量机对人类识别,分类,预测准确性
3.用GridSearchCV网格调参,自动调参(适用于小数据集)
http://scikit-learn.org/stable/auto_examples/applications/plot_face_recognition.html#sphx-glr-auto-examples-applications-plot-face-recognition-py
The dataset used in this example is a preprocessed excerpt of the “Labeled Faces in the Wild”, aka LFW:
http://vis-www.cs.umass.edu/lfw/lfw-funneled.tgz (233MB)
Expected results for the top 5 most represented people in the dataset:
| Ariel Sharon | 0.67 | 0.92 | 0.77 | 13 |
| Colin Powell | 0.75 | 0.78 | 0.76 | 60 |
| Donald Rumsfeld | 0.78 | 0.67 | 0.72 | 27 |
| George W Bush | 0.86 | 0.86 | 0.86 | 146 |
| Gerhard Schroeder | 0.76 | 0.76 | 0.76 | 25 |
| Hugo Chavez | 0.67 | 0.67 | 0.67 | 15 |
| Tony Blair | 0.81 | 0.69 | 0.75 | 36 |
| avg / total | 0.80 | 0.80 | 0.80 | 322 |
GridSearchCV,它存在的意义就是自动调参,只要把参数输进去,就能给出最优化的结果和参数。但是这个方法适合于小数据集,一旦数据的量级上去了,很难得出结果。这个时候就是需要动脑筋了。数据量比较大的时候可以使用一个快速调优的方法——坐标下降。它其实是一种贪心算法:拿当前对模型影响最大的参数调优,直到最优化;再拿下一个影响最大的参数调优,如此下去,直到所有的参数调整完毕。这个方法的缺点就是可能会调到局部最优而不是全局最优,但是省时间省力,巨大的优势面前,还是试一试吧,后续可以再拿bagging再优化。
- # -*- coding: utf-8 -*-
- """
- Created on Thu Apr 5 22:44:32 2018
- @author: Administrator
- """
- from __future__ import print_function
-
- from time import time
- import logging
- import matplotlib.pyplot as plt
-
- from sklearn.model_selection import train_test_split
- from sklearn.model_selection import GridSearchCV
- from sklearn.datasets import fetch_lfw_people
- from sklearn.metrics import classification_report
- from sklearn.metrics import confusion_matrix
- from sklearn.decomposition import PCA
- from sklearn.svm import SVC
-
-
- print(__doc__)
-
- # Display progress logs on stdout
- logging.basicConfig(level=logging.INFO, format='%(asctime)s %(message)s')
-
-
- # #############################################################################
- # Download the data, if not already on disk and load it as numpy arrays
-
- lfw_people = fetch_lfw_people(min_faces_per_person=70, resize=0.4)
-
- # introspect the images arrays to find the shapes (for plotting)
- n_samples, h, w = lfw_people.images.shape
-
- # for machine learning we use the 2 data directly (as relative pixel
- # positions info is ignored by this model)
- X = lfw_people.data
- n_features = X.shape[1]
-
- # the label to predict is the id of the person
- y = lfw_people.target
- target_names = lfw_people.target_names
- n_classes = target_names.shape[0]
-
- print("Total dataset size:")
- print("n_samples: %d" % n_samples)
- print("n_features: %d" % n_features)
- print("n_classes: %d" % n_classes)
-
-
- # #############################################################################
- # Split into a training set and a test set using a stratified k fold
-
- # split into a training and testing set
- X_train, X_test, y_train, y_test = train_test_split(
- X, y, test_size=0.25, random_state=42)
-
-
- # #############################################################################
- # Compute a PCA (eigenfaces) on the face dataset (treated as unlabeled
- # dataset): unsupervised feature extraction / dimensionality reduction
- n_components = 150
-
- print("Extracting the top %d eigenfaces from %d faces"
- % (n_components, X_train.shape[0]))
- t0 = time()
- pca = PCA(n_components=n_components, svd_solver='randomized',
- whiten=True).fit(X_train)
- print("done in %0.3fs" % (time() - t0))
-
- eigenfaces = pca.components_.reshape((n_components, h, w))
-
- print("Projecting the input data on the eigenfaces orthonormal basis")
- t0 = time()
- X_train_pca = pca.transform(X_train)
- X_test_pca = pca.transform(X_test)
- print("done in %0.3fs" % (time() - t0))
-
-
- # #############################################################################
- # Train a SVM classification model
-
- print("Fitting the classifier to the training set")
- t0 = time()
- param_grid = {'C': [1e3, 5e3, 1e4, 5e4, 1e5],
- 'gamma': [0.0001, 0.0005, 0.001, 0.005, 0.01, 0.1], }
- clf = GridSearchCV(SVC(kernel='rbf', class_weight='balanced'), param_grid)
- clf = clf.fit(X_train_pca, y_train)
- print("done in %0.3fs" % (time() - t0))
- print("Best estimator found by grid search:")
- print(clf.best_estimator_)
-
-
- # #############################################################################
- # Quantitative evaluation of the model quality on the test set
-
- print("Predicting people's names on the test set")
- t0 = time()
- y_pred = clf.predict(X_test_pca)
- print("done in %0.3fs" % (time() - t0))
-
- print(classification_report(y_test, y_pred, target_names=target_names))
- print(confusion_matrix(y_test, y_pred, labels=range(n_classes)))
-
-
- # #############################################################################
- # Qualitative evaluation of the predictions using matplotlib
-
- def plot_gallery(images, titles, h, w, n_row=3, n_col=4):
- """Helper function to plot a gallery of portraits"""
- plt.figure(figsize=(1.8 * n_col, 2.4 * n_row))
- plt.subplots_adjust(bottom=0, left=.01, right=.99, top=.90, hspace=.35)
- for i in range(n_row * n_col):
- plt.subplot(n_row, n_col, i + 1)
- plt.imshow(images[i].reshape((h, w)), cmap=plt.cm.gray)
- plt.title(titles[i], size=12)
- plt.xticks(())
- plt.yticks(())
-
-
- # plot the result of the prediction on a portion of the test set
-
- def title(y_pred, y_test, target_names, i):
- pred_name = target_names[y_pred[i]].rsplit(' ', 1)[-1]
- true_name = target_names[y_test[i]].rsplit(' ', 1)[-1]
- return 'predicted: %s\ntrue: %s' % (pred_name, true_name)
-
- prediction_titles = [title(y_pred, y_test, target_names, i)
- for i in range(y_pred.shape[0])]
-
- plot_gallery(X_test, prediction_titles, h, w)
-
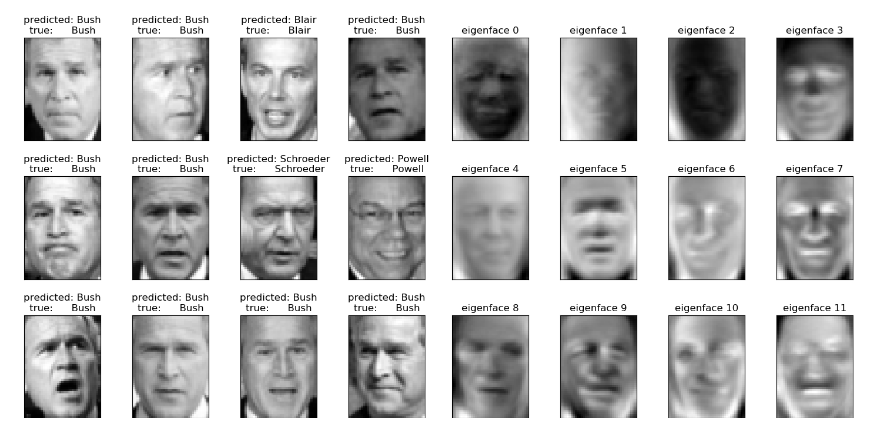
- # plot the gallery of the most significative eigenfaces
-
- eigenface_titles = ["eigenface %d" % i for i in range(eigenfaces.shape[0])]
- plot_gallery(eigenfaces, eigenface_titles, h, w)
-
- plt.show()
输出结果
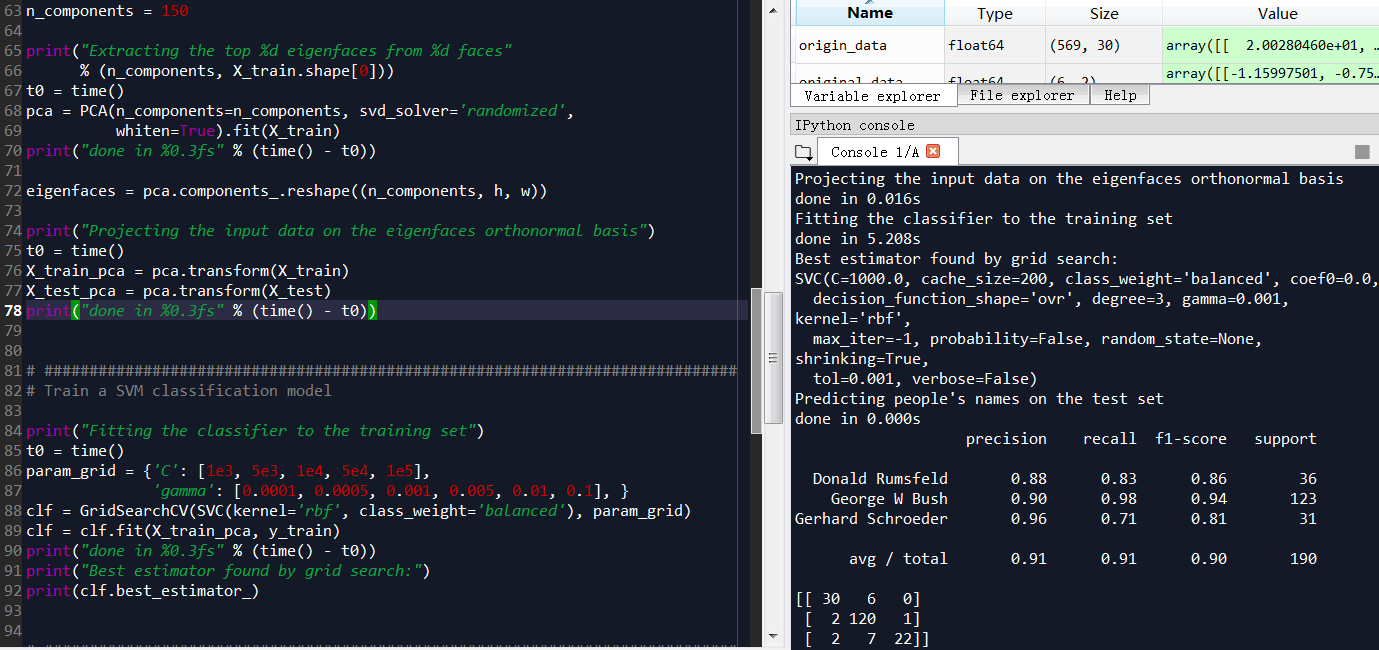
Total dataset size:
n_samples: 1288 n_features: 1850 n_classes: 7 Extracting the top 150 eigenfaces from 966 faces done in 0.215s Projecting the input data on the eigenfaces orthonormal basis done in 0.023s Fitting the classifier to the training set done in 23.334s Best estimator found by grid search: SVC(C=1000.0, cache_size=200, class_weight='balanced', coef0=0.0, decision_function_shape='ovr', degree=3, gamma=0.001, kernel='rbf', max_iter=-1, probability=False, random_state=None, shrinking=True, tol=0.001, verbose=False) Predicting people's names on the test set done in 0.049s precision recall f1-score support Ariel Sharon 0.50 0.69 0.58 13 Colin Powell 0.80 0.85 0.82 60 Donald Rumsfeld 0.69 0.74 0.71 27 George W Bush 0.91 0.89 0.90 146 Gerhard Schroeder 0.82 0.72 0.77 25 Hugo Chavez 0.83 0.67 0.74 15 Tony Blair 0.88 0.83 0.86 36 avg / total 0.84 0.83 0.83 322 [[ 9 0 3 1 0 0 0] [ 2 51 2 4 0 1 0] [ 5 0 20 2 0 0 0] [ 2 8 2 130 3 0 1] [ 0 1 0 3 18 1 2] [ 0 2 0 1 1 10 1] [ 0 2 2 2 0 0 30]]
spss应用
因子分析是一种数据简化的技术,通过研究众多变量之间的内部依赖关系,探求观测数据中的基本结构,并用少数几个假想变量来表示其基本的数据结构。
1.因子分析
-
1
1.因子分析
(1)主要思路:降维 简化数据结构
(2)目的:将(具有错综复杂关系的)变量 综合为 (数量较少的) 因子
以再现 原始变量与因子的关系, 通过不同的因子,对变量进行分类
消除 相关性,在信息损失最小的情况下,降维
(3)步骤
选取因子分析的变量(选相关性较大的,利于降维)――标准化处理;
根据样本、估计随机向量的协方差矩阵或相关矩阵;
选择一种方法――估计因子载荷阵,计算关键统计特征;
进行因子旋转,使因子含义清晰化,并命名,利用因子解释变量的构成;
计算每个因子在各样本上的得分,得出新的因子得分变量――进一步分析。
(4)如何分析
检验变量间偏相关度KMO值>0.6,才适合做因子分析;
调整因子个数,显示共同特征后即可命名。
-
2
2.因子分析操作步骤
-
3
3.看看结果吧
END
spss-因子分析/主成分分析-乳腺癌细胞
数据来源from sklearn.datasets import load_breast_cancer
KMO指数>0.8,说明变量共线性很强,适合因子分析或主成分分析
Bartlett的sig显著性为0,说明也OK,只是bartlett在某些场景参考意义不大

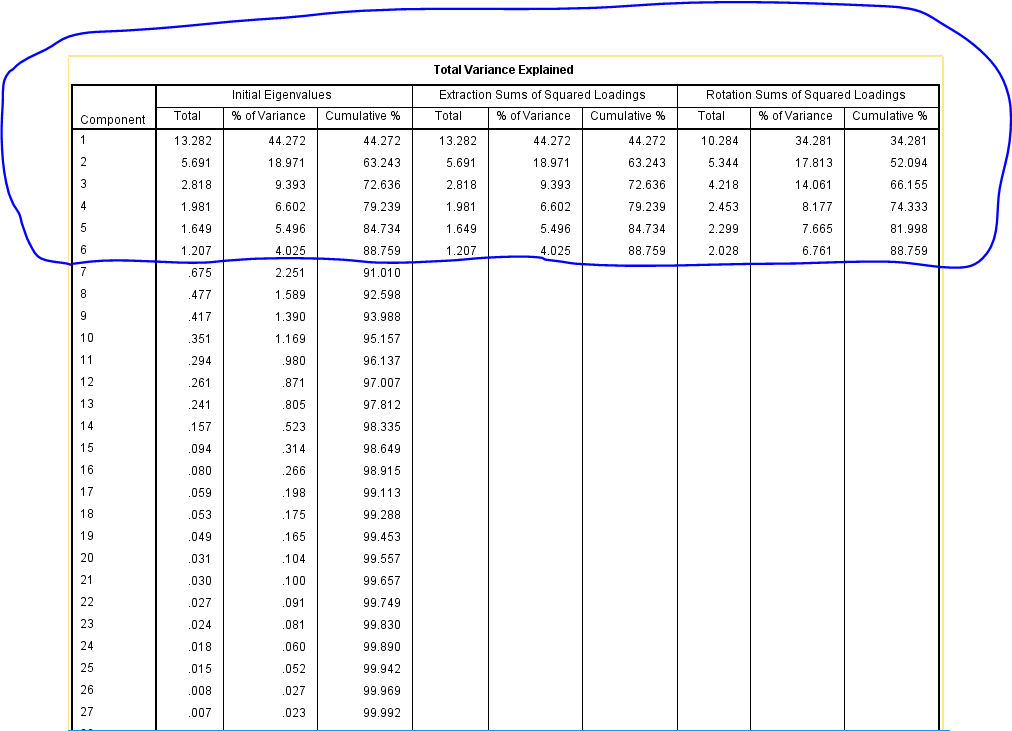
从方差解释来看,癌细胞受到6个因子共同决定,而非单一因素决定,和之前蒙特卡洛模拟结论一致
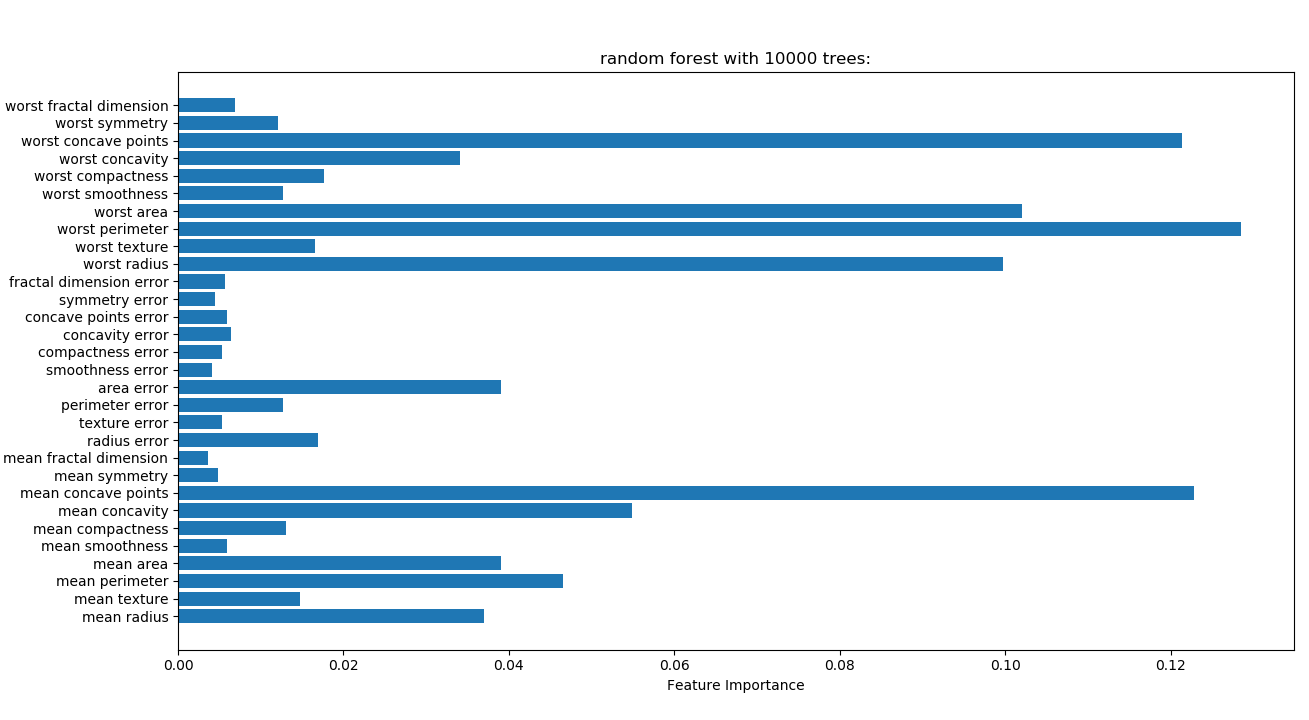
随机森林测试和因子分析的方差解释相差较大,随机森林更加准确,因子分析方差解释仅做参考
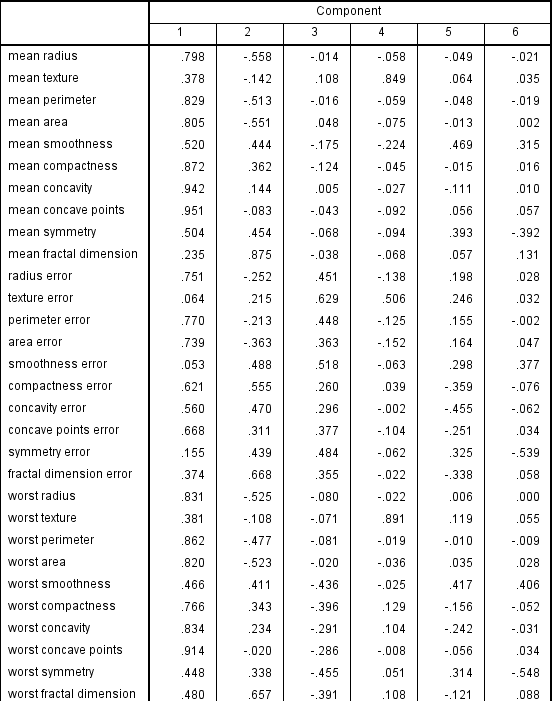
主成分图
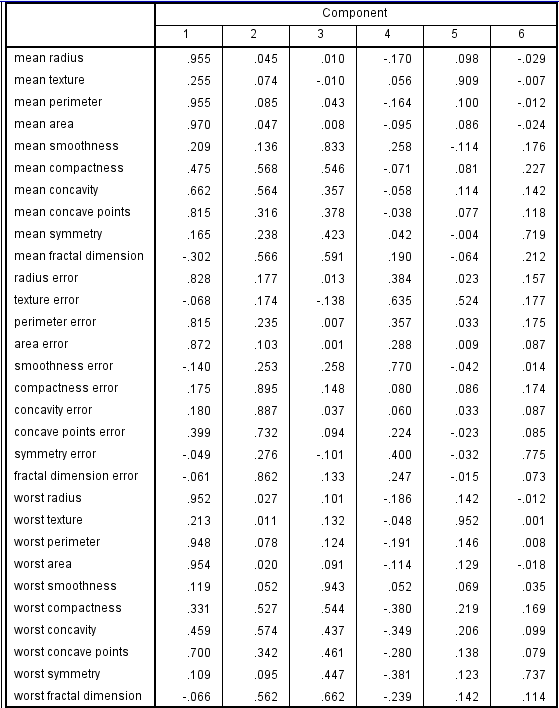
旋转后因子图,经过和主成分比较,旋转后因子成分变量参数很多大于0.9,比较显著,主成分中大于0.9的变量很少
Extraction Method: Principal Component Analysis.
Rotation Method: Varimax with Kaiser Normalization.
Rotation converged in 11 iterations.
因子总结结果:

随机森林测试结果,1000颗树
