
热门标签
热门文章
- 1Baidu Comate中文名——文心快码——送礼物来了(活动最后3天)_如何登入 文心快码
- 2从“专家”视角看:2024年软件测试行业的八大发展趋势!_列举在ai自动化测试工具链领域,国外软件的龙头以及国产化软件的龙头
- 3Stable Diffusion【二次元模型】:质量高细节丰富的动漫风格大模型anima_pencil-XL_animapencilxl
- 4vue 视频添加水印_vue3视频点播嵌入水印
- 5Python 中的后台进程_python后台运行
- 6AIGC各个应用场景下的模型选择
- 7win10家庭版安装Docker_windows10家庭版安装docker
- 8三天吃透Redis面试八股文
- 9php如何判断0和空_php判断0和空值
- 10python-learning20--高阶教程--基础阶段--python字符串--拼接操作
当前位置: article > 正文
13 - matlab m_map地学绘图工具基础函数 - 介绍创建管理颜色映射的函数m_colmap和轮廓图绘制颜色条的函数m_contfbar
作者:小惠珠哦 | 2024-07-15 14:01:07
赞
踩
13 - matlab m_map地学绘图工具基础函数 - 介绍创建管理颜色映射的函数m_colmap和轮廓图绘制颜色条的函数m_contfbar
0. 引言
本篇介绍下m_map中用于创建和管理颜色映射函数(m_colmap)和 为轮廓图绘制颜色条的函数(m_contfbar)。
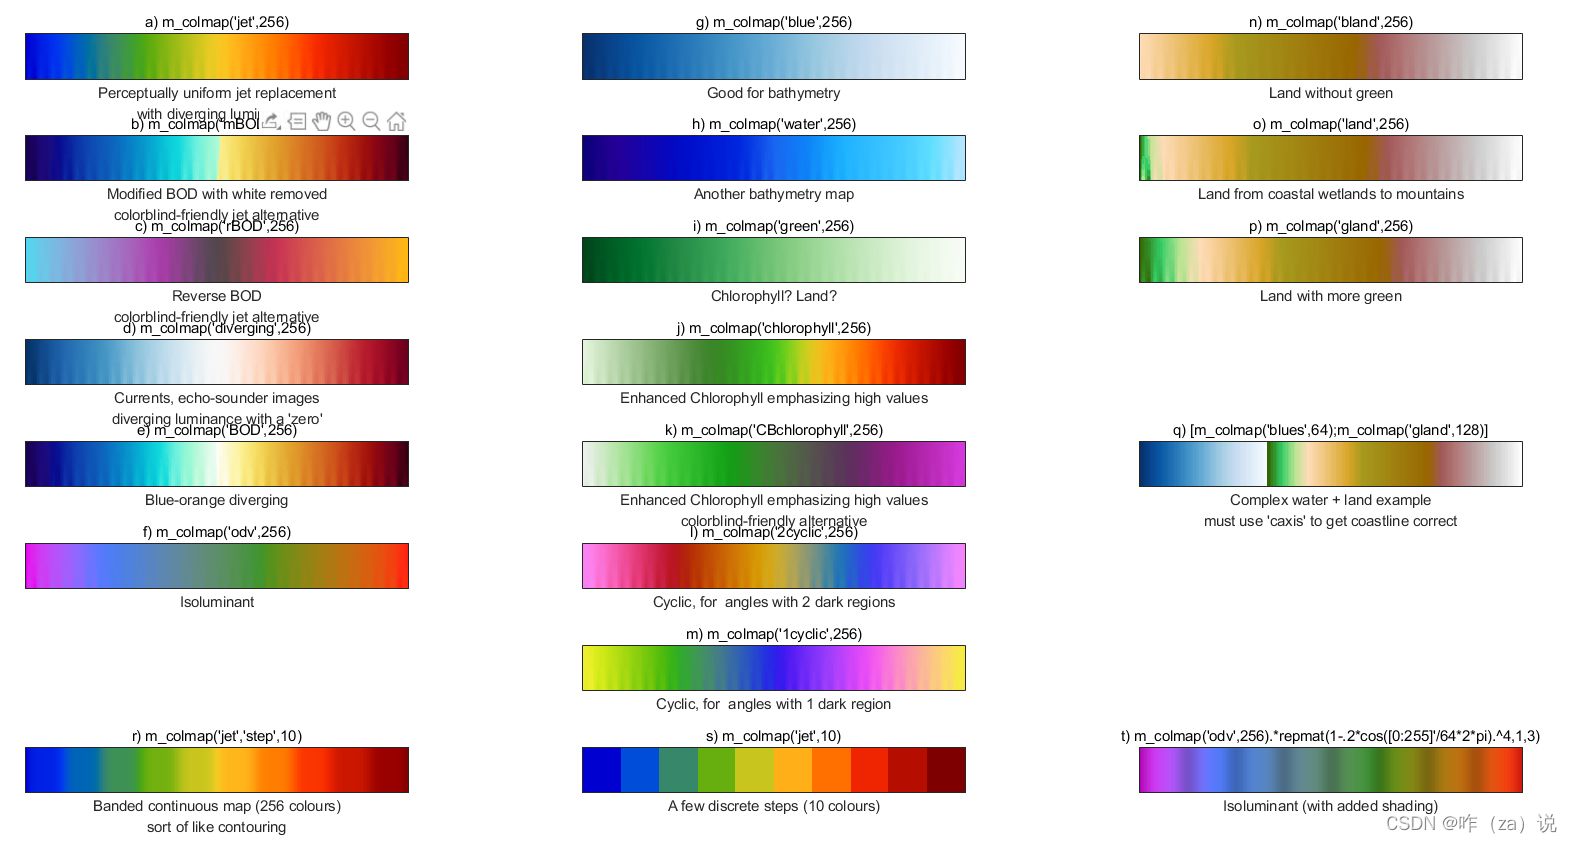
1. 关于m_colmap
m_colmap函数用于创建和管理颜色映射(colormap)。颜色映射可以用来对数据进行可视化编码,例如在地图上显示温度、高度、速度等信息。
m_colmap函数的一般形式如下:
cols=m_colmap(nme,m,ncol)
% m_colmap  Useful colormaps
%   m_colmap(NAME) returns an M-by-3 matrix containing the NAME colormap
%   where NAME is one of:
%     'jet' : a perceptually uniform variation of the JET colormap. It
%             contains the multiple colours which make JET useful, while
%             avoiding the weird highlighting especially around yellow and
%             cyan. The colors begin with dark blue, range through shades
%             of blue, green, orange and red, and ends with dark red.
%     'mBOD' : a modified blue/orange diverging colormap without white,
%              useful as a colorblind-friendly jet alternative
%
%     'diverging' : a blue/red diverging colormap
%     'BOD' : a blue/orange diverging colormap
%     'rBOD' : a different blue/orange colormap with gray in the middle
%
%     'odv'  : an isoluminant map
%     'cyclic2': a cyclic colormap (for angles) with two dark regions
%     'cyclic1': a cyclic colormap (for angles) with one dark region
%
%     'land' : a topographic height (green-brown-white) shading
%     'water' : blue shading for water (goes with 'land').
%     'gland' : a topographic height  shading with more green
%     'bland' : a topographic height shading with browns only.
%
%     'blue' : a perceptually useful blue shading (good for bathymetry)
%     'green' : a perceptually useful green shading
%     'chlorophyll': Enhanced green for chlorophyll (to red)
%     'CBchlorophyll': Enhanced green for chlorophyll (to magenta)
%                               <-colorblind friendly
%
%     'EK80' : a standard echo-sounder map.
%     'chart':  the standard chart colour (single color)
%
%   and M is the same length as the current figure's colormap. If no
%   figure exists, the length of the default colormap is used. The
%   length can be explicitly specified with s_colmap(NAME,M).
%
%   m_colmap('demo') demonstrates the colormaps.
%
%   m_colmap(NAME,'step') returns a 256-color map in which colours are
%   perceptually bunched into 16 separate colours. This is useful
%   if you want to see "edges" in what would be an otherwise
%   smooth gradation (i.e. approaching the look of contouring).
%
%   m_colmap(NAME,'demo') Gives a demo of this behavior
%
%   m_colmap(NAME,'step',M) bunches into M colours.

- 1
- 2
- 3
- 4
- 5
- 6
- 7
- 8
- 9
- 10
- 11
- 12
- 13
- 14
- 15
- 16
- 17
- 18
- 19
- 20
- 21
- 22
- 23
- 24
- 25
- 26
- 27
- 28
- 29
- 30
- 31
- 32
- 33
- 34
- 35
- 36
- 37
- 38
- 39
- 40
- 41
- 42
- 43
- 44
- 45
- 46
- 47
- 48
其中,nme 选择一种颜色类型;m 颜色长度,不设置就自动用默认的,设置了就颜色条按区间进行分段;
m_map的所有颜色类型可以通过下面一句代码查看:
m_colmap demo
- 1
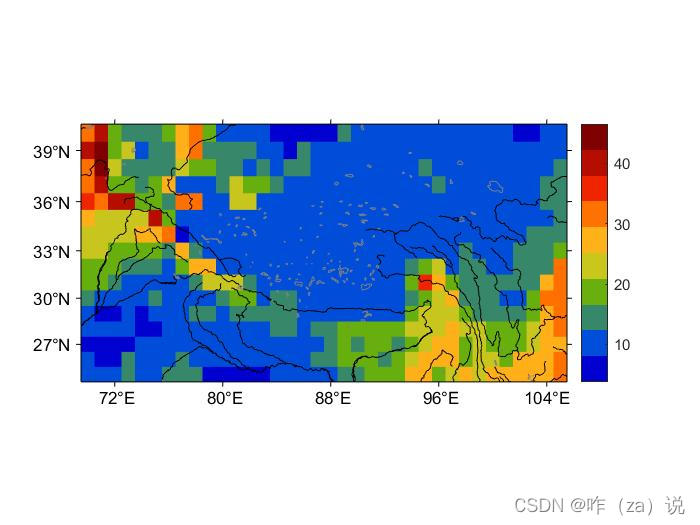
m_colmap函数的使用示例,示例数据可以从网盘获取,提取码:ofxi:
%% m_colormap
clc;clear;
ncFilePath = 'GLDAS_NOAH10_M.A200602.021.nc4';
lon = ncread(ncFilePath,'lon');
lat = ncread(ncFilePath,'lat');
soilmoi_data = ncread(ncFilePath,'SoilMoi0_10cm_inst');

[LN,LT]=meshgrid(lon,lat);

m_proj('mercator','long',[69.5 105.5],'lat',[24.5 40.5]);
% 在地图上绘制伪彩色图
m_pcolor(LN,LT, soilmoi_data');

colormap( m_colmap('jet') );
%colormap( m_colmap('jet',10) );

% 添加地图边界、标签和色标
m_gshhs('ic','color',[.5 .5 .5]) % 中等分辨率海岸线
m_gshhs('ir2','color','k')   % 中等分辨率河流
m_grid('linestyle','none','tickdir','out');
colorbar;
- 1
- 2
- 3
- 4
- 5
- 6
- 7
- 8
- 9
- 10
- 11
- 12
- 13
- 14
- 15
- 16
- 17
- 18
- 19
- 20
- 21
对比下图可以发现,绘制在图右侧的颜色调划分上存在差异,这就是设置了m的差别,根据需要选择合适的命令参数,能够绘出更加符合的图示:

|
|
2. 关于m_contfbar
m_contfbar函数用于添加色标,以显示地图上的等值线或填充的数据的颜色对应的数值范围。
m_contfbar函数的一般形式是:
[ ax,h ] = m_contfbar(lon,lat,DATA,LEVELS)
% M_CONTFBAR Draws a colour bar for contourf plots
%    M_CONTFBAR([X1,X2],Y,DATA,LEVELS) draws a horizontal colourbar
%    between the normalized coordinates (X1,Y) and (X2,Y) where
%    X/Y are both in the range 0 to 1 across the current axes.
%    Negative values can be used to position outside the axis.
%
%    Differences from COLORBAR are: the bar is divided into solid
%    colour patches exactly corresponding to levels provided by
%    CONTOURF(DATA,LEVELS) instead of showing the whole continuous
%    colourmap, the parent axis is not resized, the axis can be made
%    as large or small as desired, and the presence of values
%    above/below contoured levels is indicated by triangular pieces
%    (MATLAB 2014b or later).
%
%    M_CONTFBAR(X,[Y1,Y2],...) draws a vertical colourbar
%
%    The DATA,LEVELS pair can also be replaced with CS,CH where
%    [CS,CH]=CONTOURF(DATA,LEVELS).
%
%    M_CONTFBAR(...,'parameter','value') lets you specify extra
%    parameter/value pairs for the colourbar in the usual handle-graphics
%    way. Parameters you might set include 'xticks','xticklabels',
%    'xscale','xaxisloc' (or corresponding y-axis parameters for
%    a vertical colourbar) and 'fontsize'.
%
%    Additional parameter/value pairs allow special customization of the
%    colourbar:
%        'axfrac' : width of the colourbar (default 0.03)
%        'endpiece' : 'yes' (default) or 'no' show triangular
%                      endpieces.
%        'levels' : 'set' (default) shows a colourbar with exactly
%                   the levels in the LEVELS argument.
%                   'match' shows only the subsect of levels actually
%                   used in the CONTOURF call. E.g., if your data ranges
%                   from (say) 121 to 192, and LEVELS=[10:10:300],
%                   then only levels in 130:10:190 actually appear in both
%                   the CONTOURF and the colourbar.
%         'edgecolor' : 'none' removes edges between colors.
%
%    [AX,H]=M_CONTFBAR(...) returns the handle to the axis AX and to
%    the contourobject H. This is useful to add titles, xlabels, etc.
%
%    M_CONTFBAR(BAX,...) where BAX is an axis handle draws the colourbar
%    for that axis.
- 1
- 2
- 3
- 4
- 5
- 6
- 7
- 8
- 9
- 10
- 11
- 12
- 13
- 14
- 15
- 16
- 17
- 18
- 19
- 20
- 21
- 22
- 23
- 24
- 25
- 26
- 27
- 28
- 29
- 30
- 31
- 32
- 33
- 34
- 35
- 36
- 37
- 38
- 39
- 40
- 41
- 42
- 43
- 44
- 45
其中:
lon,lat控制色标的位置,([lon1 lon2],[lat]…)表示横向色标;([lon1],[lat1 lat2]…)纵向色标;DATA进行绘图的输入数据;axfrac设置色标宽度 设置value数值;endpiece设置结束端,yes 或 no;edgecolor色标框边缘颜色,可以设置’r’ 、'g’等matlab内置颜色,也可以设置none;
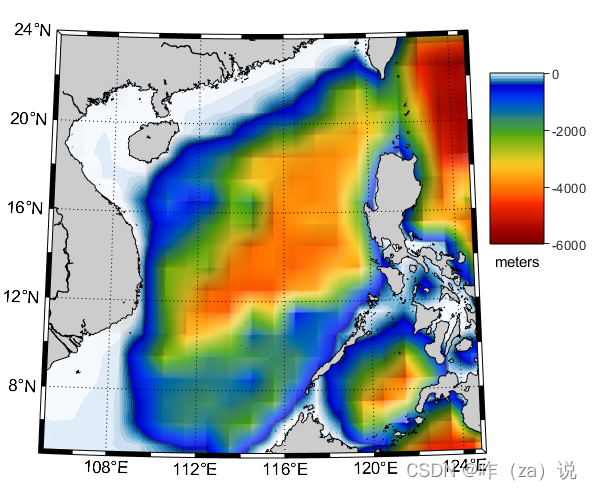
m_contfbar函数的使用示例(在官网示例上不断尝试修改):
m_proj('lambert','lat',[5 24],'long',[105 125]);

set(gcf,'color','w')   % Set background colour before m_image call
caxis([-6000 0]);
colormap(flipud([flipud(m_colmap('blues',10));m_colmap('jet',118)]));
m_etopo2('shadedrelief','gradient',3);
m_gshhs_i('patch',[.8 .8 .8]);
m_grid('box','fancy');
ax=m_contfbar(.97,[.5 .9],[-6000 0],[-6000:100:000],'edgecolor','none','endpiece','no','axfrac ',0.1);
xlabel(ax,'meters','color','k');
- 1
- 2
- 3
- 4
- 5
- 6
- 7
- 8
- 9
- 10
示例运行结果,上边的可选参数可自行修改。
3. 结语
本篇介绍了用于创建和管理颜色映射函数(m_colmap)和 为轮廓图绘制颜色条的函数(m_contfbar),通过示例展示了各函数的基本用法,对于绘制常见地学图已经够用了,后面如果发现还有其它相关函数再进行补充。希望对绘图的你有所帮助
声明:本文内容由网友自发贡献,不代表【wpsshop博客】立场,版权归原作者所有,本站不承担相应法律责任。如您发现有侵权的内容,请联系我们。转载请注明出处:https://www.wpsshop.cn/w/小惠珠哦/article/detail/829703
推荐阅读
相关标签
Copyright © 2003-2013 www.wpsshop.cn 版权所有,并保留所有权利。

