- 1PyQt5快速开发与实战 3.2 布局管理入门 and 3.3 Qt Designer实战应用
- 213 个Python开发者必知的Python GUI库(1)_python 界面库
- 3【人工智能】数据分析与机器学习——泰坦尼克号(更新中)_机器学习实战泰坦尼克号
- 4CentOS yum安装redis_centos yum redis
- 5从three.js旋转动画,我了解了requestAnimationFrame_three.js requestanimationframe
- 6LVGL ArchLinux VSCode环境运行
- 7elementui 上传请求头_element-ui el-upload http-request自定义上传方法
- 8计算机Java项目|超市进销存管理系统_java超市管理系统
- 9前端技术岗,阿里 P7、百度 T6、腾讯 T3.1 的要求是怎样的?_t3前端啥水平
- 10tiup与prometheus迁移
【Hadoop】四、Hadoop生态综合案例 ——陌陌聊天数据分析_基于hadoop和hive的在线社交网络情感分析:使用hadoop和hive分析社交网络数据,以了
赞
踩
四、Hadoop生态综合案例 ——陌陌聊天数据分析
1、陌陌聊天数据分析案例需求
1.1、背景介绍
背景介绍
陌陌作为聊天平台每天都会有大量的用户在线,会出现大量的聊天数据,通过对 聊天数据的统计分析 ,可以更好的对用户构建 精准的用户画像 ,为用户提供更好的服务以及实现 高ROI的平台运营推广 ,给公司的发展决策提供精确的数据支撑。

1.2、目标需求
目标
基于Hadoop和Hive实现聊天数据统计分析,构建聊天数据分析报表
需求
-
统计今日总消息量
-
统计今日每小时消息量、发送和接收用户数
-
统计今日各地区发送消息数据量
-
统计今日发送消息和接收消息的用户数
-
统计今日发送消息最多的To p 1 0用户
-
统计今日接收消息最多的To p 1 0用户
-
统计发送人的手机型号分布情况
-
统计发送人的设备操作系统分布情况
1.3、数据内容
-
数据大小:两个文件共14万条数据
-
列分隔符:制表符 \t
-
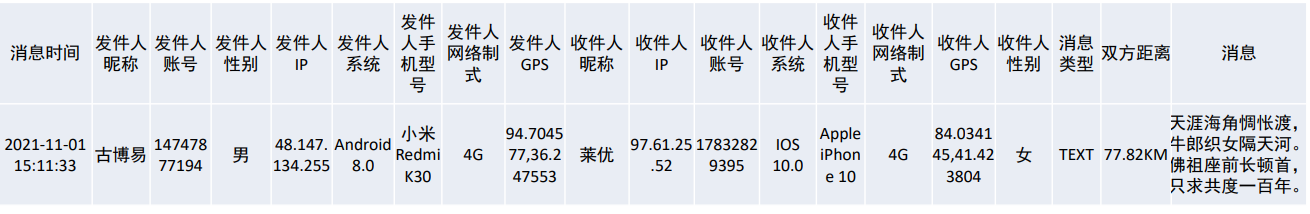
数据字典及样例数据
2、基于Hive数仓实现需求开发
2.1、建库建表、加载数据
建库建表
--------------1、建库-------------------

--如果数据库已存在就删除
drop database if exists db_msg cascade;
--创建数据库
create database db_msg;
--切换数据库
use db_msg;

--------------2、建表-------------------
--如果表已存在就删除
drop table if exists db_msg.tb_msg_source;
--建表
create table db_msg.tb_msg_source(
  msg_time             string  comment "消息发送时间"
  , sender_name        string  comment "发送人昵称"
  , sender_account     string  comment "发送人账号"
  , sender_sex         string  comment "发送人性别"
  , sender_ip          string  comment "发送人ip地址"
  , sender_os          string  comment "发送人操作系统"
  , sender_phonetype   string  comment "发送人手机型号"
  , sender_network     string  comment "发送人网络类型"
  , sender_gps         string  comment "发送人的GPS定位"
  , receiver_name      string  comment "接收人昵称"
  , receiver_ip        string  comment "接收人IP"
  , receiver_account   string  comment "接收人账号"
  , receiver_os        string  comment "接收人操作系统"
  , receiver_phonetype string  comment "接收人手机型号"
  , receiver_network   string  comment "接收人网络类型"
  , receiver_gps       string  comment "接收人的GPS定位"
  , receiver_sex       string  comment "接收人性别"
  , msg_type           string  comment "消息类型"
  , distance           string  comment "双方距离"
  , message            string  comment "消息内容"
)
--指定分隔符为制表符
row format delimited fields terminated by '\t';

- 1
- 2
- 3
- 4
- 5
- 6
- 7
- 8
- 9
- 10
- 11
- 12
- 13
- 14
- 15
- 16
- 17
- 18
- 19
- 20
- 21
- 22
- 23
- 24
- 25
- 26
- 27
- 28
- 29
- 30
- 31
- 32
- 33
- 34
- 35
- 36
- 37
加载数据
-
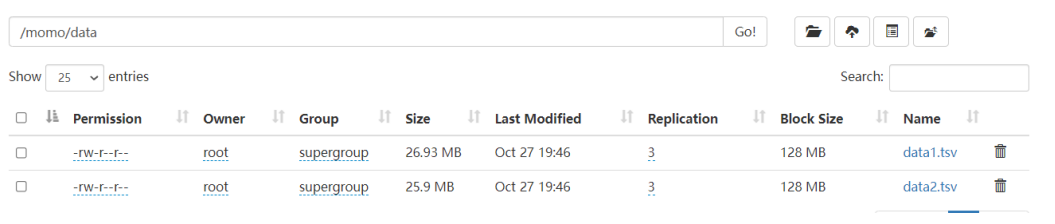
HDFS上创建目录
hdfs dfs -mkdir -p /momo/data- 1
-
上传到HDFS
hdfs dfs -put /export/data/data1.tsv /momo/data/ hdfs dfs -put /export/data/data2.tsv /momo/data/- 1
- 2
- 3
-
加载到Hive表中
load data inpath '/momo/data/data1.tsv' into table db_msg.tb_msg_source; load data inpath '/momo/data/data2.tsv' into table db_msg.tb_msg_source;- 1
- 2
-
验证结果
--查询表 验证数据文件是否映射成功 select * from tb_msg_source limit 10; --统计行数 select count(*) as cnt from tb_msg_source;- 1
- 2
- 3
- 4
- 5
2.2、ETL数据清洗
原始数据内容
-
数据来源:聊天业务系统中导出的2021年11月01日一天24小时的用户聊天数据,以TSV文本形式存储在文件中
-
数据问题
-
问题1:当前数据中,有一些数据的字段为空,不是合法数据
-
问题2:需求中,需要统计每天、每个小时的消息量,但是数据中没有天和小时字段,只有整体时间字段,不好处理
-
问题3:需求中,需要对经度和维度构建地区的可视化地图,但是数据中GPS经纬度为一个字段,不好处理
-
ETL需求
-
需求1:对字段为空的不合法数据进行过滤 •
Where过滤
-
需求2:通过时间字段构建天和小时字段
substr函数
-
需求3:从GPS的经纬度中提取经度和维度
Split函数
-
需求4:将ETL以后的结果保存到一张新的Hive表中
ETL数据清洗
--------------4、ETL数据清洗-------------------
--问题1:当前数据中,有一些数据的字段为空,不是合法数据
select
   msg_time,
   sender_name,
   sender_gps
from db_msg.tb_msg_source
where length(sender_gps) = 0
limit 10;

--问题2:需求中,需要统计每天、每个小时的消息量,但是数据中没有天和小时字段,只有整体时间字段,不好处理
select
   msg_time
from db_msg.tb_msg_source
limit 10;

--问题3:需求中,需要对经度和维度构建地区的可视化地图,但是数据中GPS经纬度为一个字段,不好处理
select
   sender_gps
from db_msg.tb_msg_source
limit 10;

--ETL实现
--如果表已存在就删除
drop table if exists db_msg.tb_msg_etl;
--将Select语句的结果保存到新表中
create table db_msg.tb_msg_etl as
select
  *,
  substr(msg_time,0,10) as dayinfo, --获取天
  substr(msg_time,12,2) as hourinfo, --获取小时
  split(sender_gps,",")[0] as sender_lng, --提取经度
  split(sender_gps,",")[1] as sender_lat --提取纬度
from db_msg.tb_msg_source
--过滤字段为空的数据
where length(sender_gps) > 0 ;

--验证ETL结果
select
    msg_time,dayinfo,hourinfo,sender_gps,sender_lng,sender_lat
from db_msg.tb_msg_etl
limit 10;
- 1
- 2
- 3
- 4
- 5
- 6
- 7
- 8
- 9
- 10
- 11
- 12
- 13
- 14
- 15
- 16
- 17
- 18
- 19
- 20
- 21
- 22
- 23
- 24
- 25
- 26
- 27
- 28
- 29
- 30
- 31
- 32
- 33
- 34
- 35
- 36
- 37
- 38
- 39
- 40
- 41
- 42
2.3、需求指标统计
需求
-
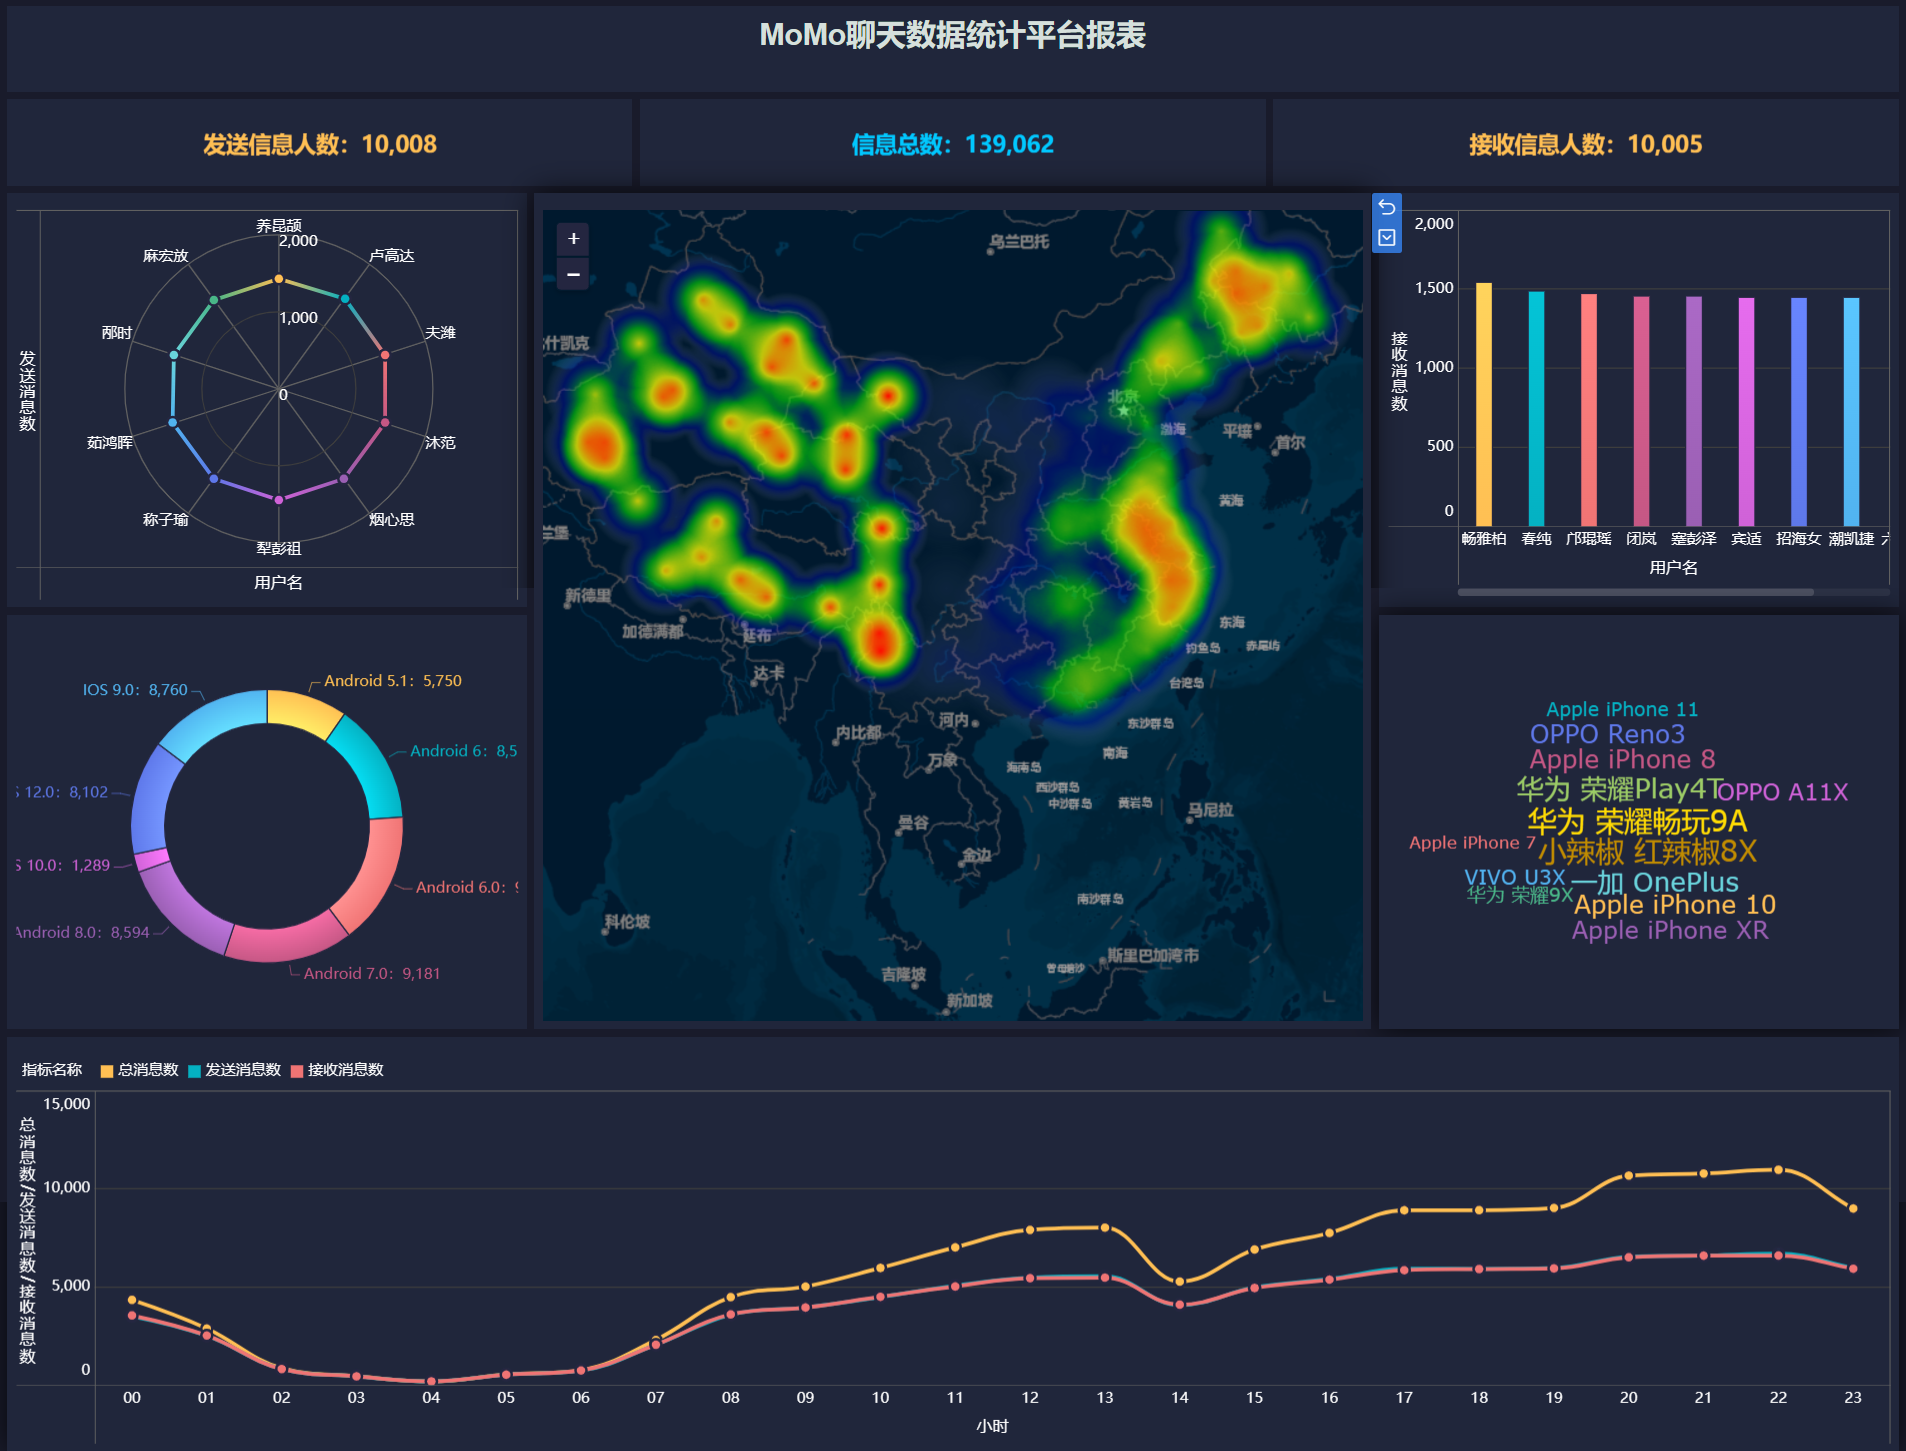
统计今日总消息量
-
统计今日每小时消息量、发送和接收用户数
-
统计今日各地区发送消息数据量
-
统计今日发送消息和接收消息的用户数
-
统计今日发送消息最多的To p 1 0用户
-
统计今日接收消息最多的To p 1 0用户
-
统计发送人的手机型号分布情况
-
统计发送人的设备操作系统分布情况
思路
- 正确解读业务需求,避免歧义
- 确定待查询的数据表–>from 表
- 找出分析的维度–>group by 分组的字段
- 找出计算的指标–>聚合的字段
- 其他细节点(过滤、排序等)
需求指标统计
--------------5、需求指标统计分析-------------------
--需求:统计今日总消息量
create table if not exists tb_rs_total_msg_cnt
comment "今日消息总量"
as
select
  dayinfo,
  count(*) as total_msg_cnt
from db_msg.tb_msg_etl
group by dayinfo;

select * from tb_rs_total_msg_cnt;--结果验证


--需求:统计今日每小时消息量、发送和接收用户数
create table if not exists tb_rs_hour_msg_cnt
comment "每小时消息量趋势"
as
select
  dayinfo,
  hourinfo,
  count(*) as total_msg_cnt,
  count(distinct sender_account) as sender_usr_cnt,
  count(distinct receiver_account) as receiver_usr_cnt
from db_msg.tb_msg_etl
group by dayinfo,hourinfo;

select * from tb_rs_hour_msg_cnt;--结果验证


--需求:统计今日各地区发送消息数据量
create table if not exists tb_rs_loc_cnt
comment "今日各地区发送消息总量"
as
select
  dayinfo,
  sender_gps,
  cast(sender_lng as double) as longitude,
  cast(sender_lat as double) as latitude,
  count(*) as total_msg_cnt
from db_msg.tb_msg_etl
group by dayinfo,sender_gps,sender_lng,sender_lat;

select * from tb_rs_loc_cnt; --结果验证


--需求:统计今日发送消息和接收消息的用户数
create table if not exists tb_rs_usr_cnt
comment "今日发送消息人数、接受消息人数"
as
select
  dayinfo,
  count(distinct sender_account) as sender_usr_cnt,
  count(distinct receiver_account) as receiver_usr_cnt
from db_msg.tb_msg_etl
group by dayinfo;

select * from tb_rs_usr_cnt; --结果验证


--需求:统计今日发送消息最多的Top10用户
create table if not exists tb_rs_susr_top10
comment "发送消息条数最多的Top10用户"
as
select
  dayinfo,
  sender_name as username,
  count(*) as sender_msg_cnt
from db_msg.tb_msg_etl
group by dayinfo,sender_name
order by sender_msg_cnt desc
limit 10;

select * from tb_rs_susr_top10; --结果验证


--需求:统计今日接收消息最多的Top10用户
create table if not exists tb_rs_rusr_top10
comment "接受消息条数最多的Top10用户"
as
select
  dayinfo,
  receiver_name as username,
  count(*) as receiver_msg_cnt
from db_msg.tb_msg_etl
group by dayinfo,receiver_name
order by receiver_msg_cnt desc
limit 10;

select * from tb_rs_rusr_top10;  --结果验证


--需求:统计发送人的手机型号分布情况
create table if not exists tb_rs_sender_phone
comment "发送人的手机型号分布"
as
select
  dayinfo,
  sender_phonetype,
  count(distinct sender_account) as cnt
from tb_msg_etl
group by dayinfo,sender_phonetype;

select * from tb_rs_sender_phone; --结果验证


--需求:统计发送人的设备操作系统分布情况
create table if not exists tb_rs_sender_os
comment "发送人的OS分布"
as
select
  dayinfo,
  sender_os,
  count(distinct sender_account) as cnt
from tb_msg_etl
group by dayinfo,sender_os;

select * from tb_rs_sender_os;  --结果验证
- 1
- 2
- 3
- 4
- 5
- 6
- 7
- 8
- 9
- 10
- 11
- 12
- 13
- 14
- 15
- 16
- 17
- 18
- 19
- 20
- 21
- 22
- 23
- 24
- 25
- 26
- 27
- 28
- 29
- 30
- 31
- 32
- 33
- 34
- 35
- 36
- 37
- 38
- 39
- 40
- 41
- 42
- 43
- 44
- 45
- 46
- 47
- 48
- 49
- 50
- 51
- 52
- 53
- 54
- 55
- 56
- 57
- 58
- 59
- 60
- 61
- 62
- 63
- 64
- 65
- 66
- 67
- 68
- 69
- 70
- 71
- 72
- 73
- 74
- 75
- 76
- 77
- 78
- 79
- 80
- 81
- 82
- 83
- 84
- 85
- 86
- 87
- 88
- 89
- 90
- 91
- 92
- 93
- 94
- 95
- 96
- 97
- 98
- 99
- 100
- 101
- 102
- 103
- 104
- 105
- 106
- 107
- 108
- 109
- 110
- 111
- 112
- 113
- 114
- 115
- 116
- 117
- 118
3、FineBI实现可视化报表
3.1、FineBI的介绍及安装
-
FineBI的介绍:https://www.finebi.com/
-
FineBI 是帆软软件有限公司推出的一款 商业智能 (Business I ntelligence)产品。FineBI 是定位于自助大数据分析的BI 工具,能够帮助企业的业务人员和数据分析师,开展以问题导向的探索式分析。

FineBI的特点
-
通过多人协作来实现最终的可视化构建
-
不需要通过复杂代码来实现开发,通过可视化操作实现开发
-
适合于各种数据可视化的应用场景
-
支持各种常见的分析图表和各种数据源
-
支持处理大数据
FineBI的安装
下载对应版本

Windows版本安装
第一次启动配置FineBI
3.2、FineBI配置数据源及数据准备
- FineBI与Hive集成的官方文档:https://help.fanruan.com/finebi/doc-view-301.html
- 驱动配置
- 问题:如果使用FineBI连接Hive,读取Hive的数据表,需要在FineBI中添加Hive的驱动jar包
- 解决:将Hive的驱动jar包放入FineBI的lib目录下
FineBI配置数据源及数据准备
-
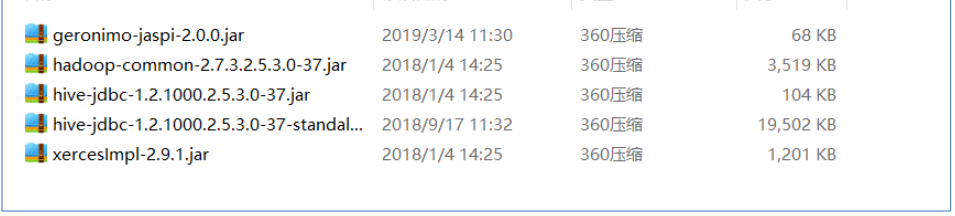
step1:找到提供的【Hive连接驱动】
-
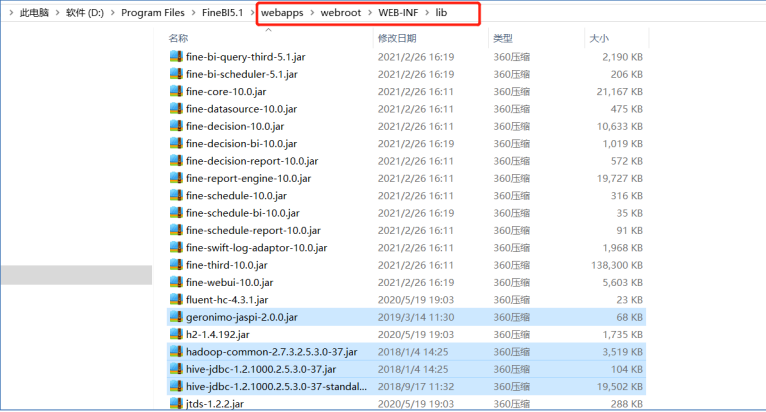
step2:将这些文件放入FineBI的安装目录下的:webapps\webroot\WEB-INF\lib目录中
插件安装
-
问题:我们自己放的Hive驱动包会与FineBI自带的驱动包产生冲突,导致FineBI无法识别我们自己的驱动包
-
解决:安装FineBI官方提供的驱动包隔离插件
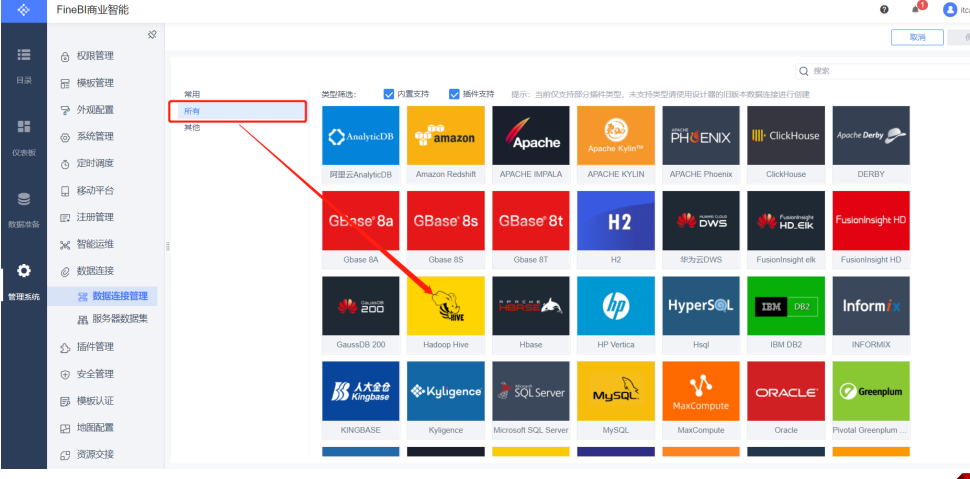
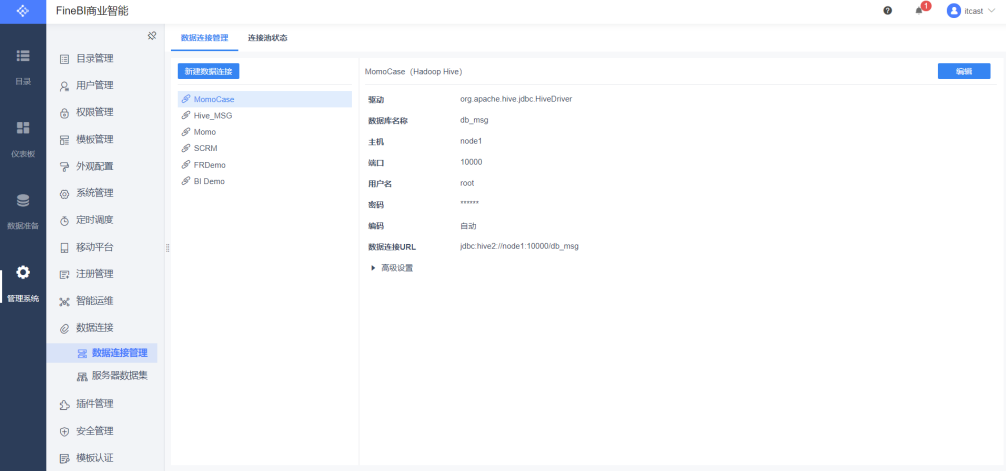
构建连接
-
新建连接
-
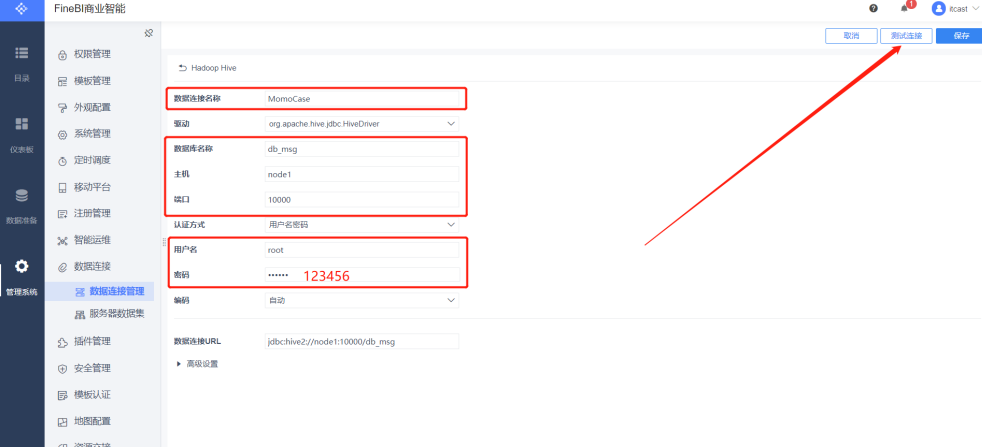
配置连接
-
测试连接
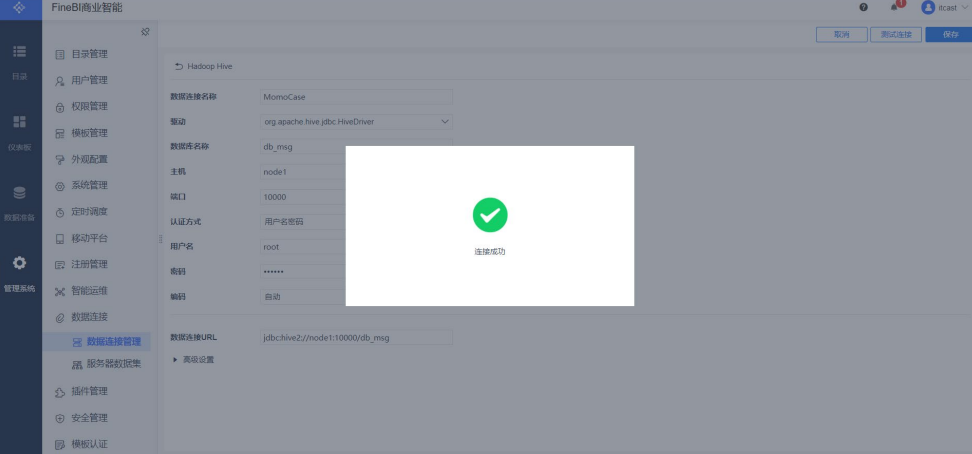
-
保存连接
数据准备
-
新建分组
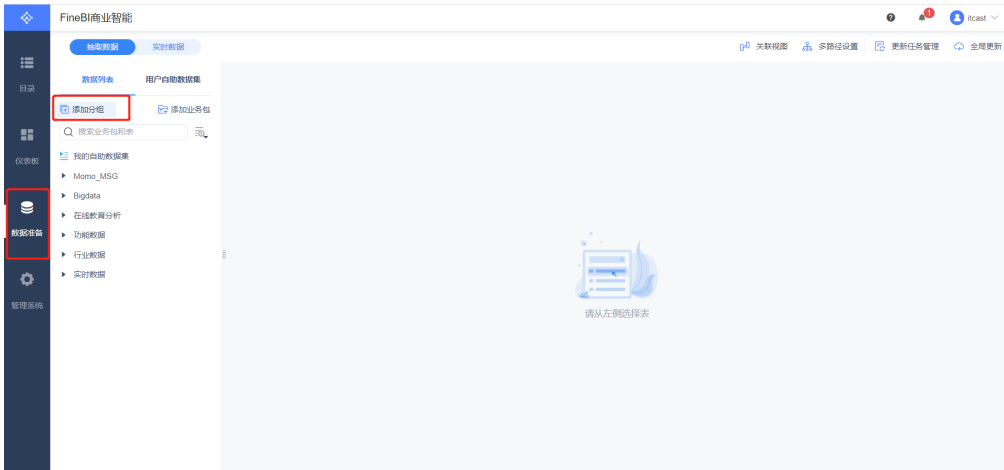
-
添加业务包
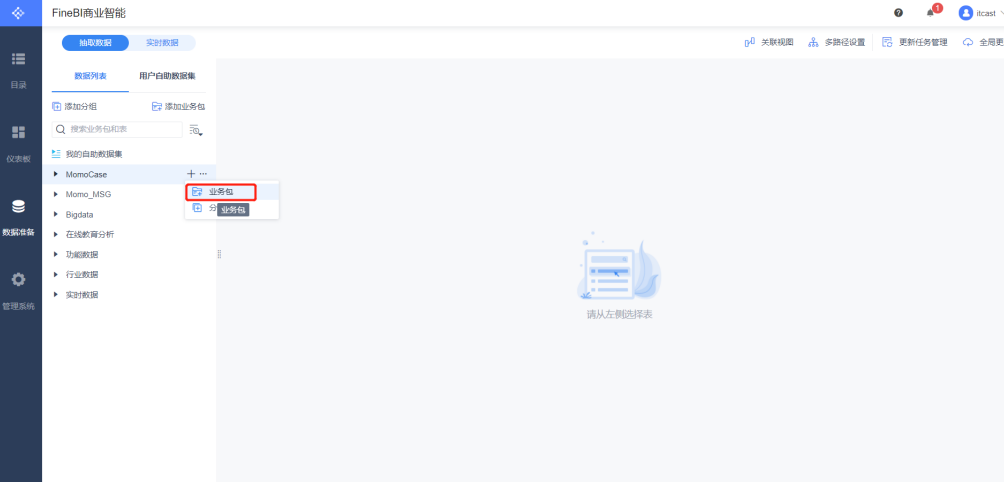
-
添加表
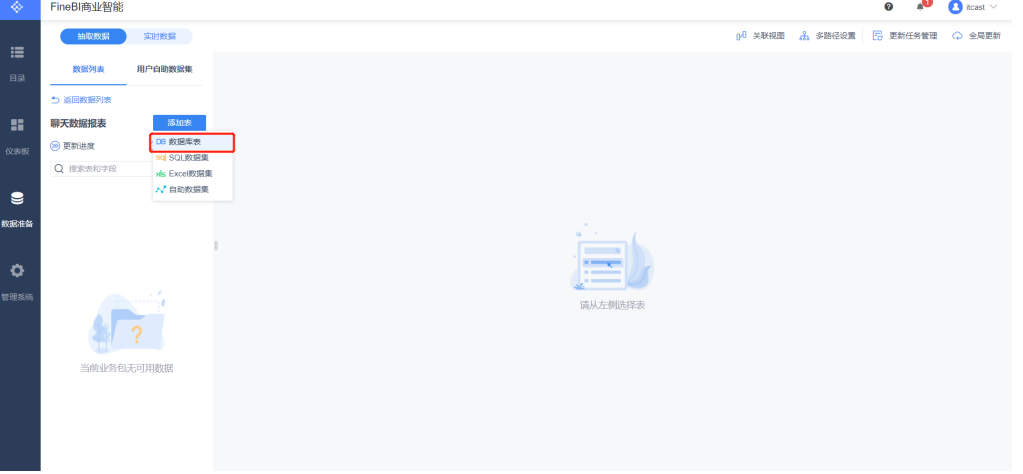
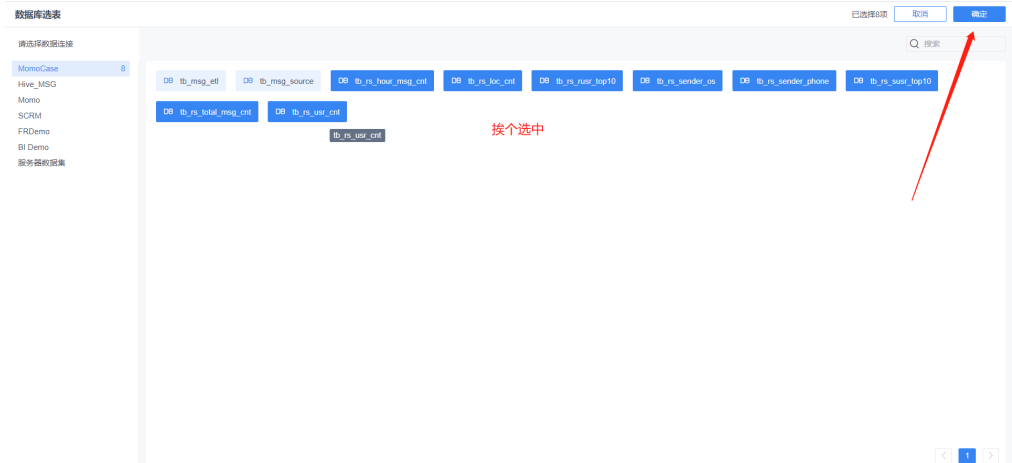
-
更新业务包
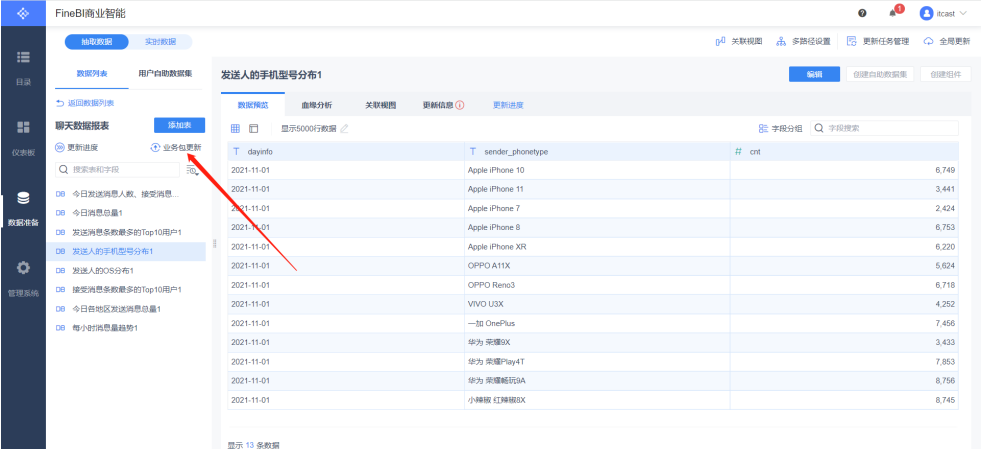
3.3、FineBI构建可视化报表
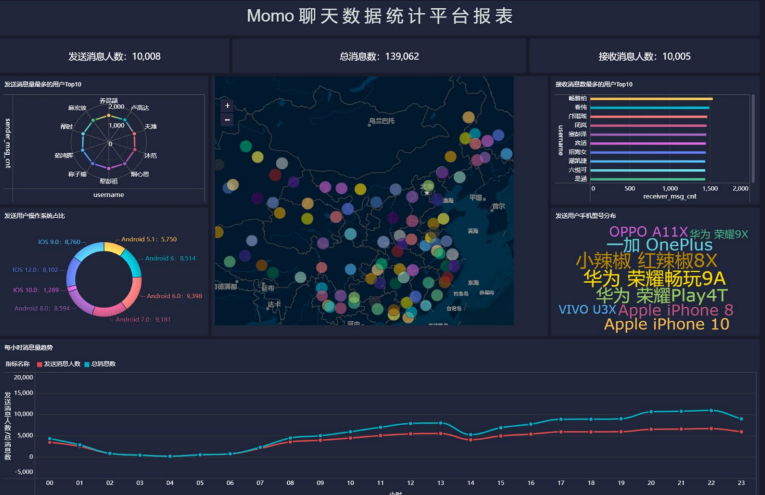
报表预览(步骤太多,懒得截图,放最终效果图)