- 1页面置换算法_最近未用置换算法nru
- 2什么是迭代器(Iterator)
- 3SpringBoot自定义自动装配与Conditional失效问题_conditionalonclass不生效
- 4Ubuntu搭建EMBY和挂载Google Drive_ubuntu emby
- 5【满分】【华为OD机试真题2023 JAVA&JS】任务混部_华为od机试题库及答案
- 6已解决selenium.common.exceptions.TimeoutException: Message: script timeout_c#openqa.selenium.webdrivertimeoutexception:鈥渟crip
- 7无人机航迹规划:小龙虾优化算法COA求解无人机路径规划MATLAB(可以修改起始点,地图可自动生成)
- 8MATLAB使用教程(4)——悄悄滴上手项目_matlab中绘制反比例函数
- 9【计算机网络】谢希仁笔记 物理层_谢希仁计网没有pcm
- 10总结—elasticsearch启动失败的几种情况及解决_elasticsearch-8.12.1启动失败
可视化深度学习模型架构的6个常用的方法总结_可视化模型
赞
踩
可视化有助于解释和理解深度学习模型的内部结构。 通过模型计算图的可视化可以弄清楚神经网络是如何计算的,对于模型的可视化主要包括以下几个方面:
- 模型有多少层
- 每层的输入和输出形状
- 不同的层是如何连接的?
- 每层使用的参数
- 使用了不同的激活函数
本文将使用 Keras 和 PyTorch 构建一个简单的深度学习模型,然后使用不同的工具和技术可视化其架构。
使用Keras构建模型
import keras

# Train the model on Fashion MNIST dataset
(train_images, train_labels), _ = keras.datasets.fashion_mnist.load_data()
train_images = train_images / 255.0

# Define the model.
model = keras.models.Sequential([
    keras.layers.Flatten(input_shape=(28, 28)),
    keras.layers.Dense(32, activation='relu'),
    keras.layers.Dropout(0.2),
    keras.layers.Dense(10, activation='softmax')
])

#Compile the model
model.compile(
    optimizer='adam',
    loss='sparse_categorical_crossentropy',
    metrics=['accuracy'])
- 1
- 2
- 3
- 4
- 5
- 6
- 7
- 8
- 9
- 10
- 11
- 12
- 13
- 14
- 15
- 16
- 17
- 18
- 19
Keras 内置可视化模型
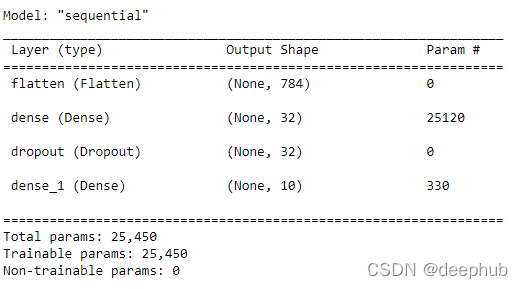
在 Keras 中显示模型架构的最简单就是使用 summary()方法
model.summary()
- 1

这个方法是keras内置的实现,他的原理很简单。就是遍历所有模型层并打印相关细节,如层的输入维度和输出维度、参数数量、激活类型等,我们也可以用for训练遍历实现,代码如下:
for layer in model.layers:
        print("Layer Name: " + layer.name)
        print("Type of layer: " + layer.__class__.__name__)
        print("Input dimesion: {}".format(layer.input_shape[1:]))
        print("Output dimesion: {}".format(layer.output_shape[1:]))
        print("Parameter Count: {}".format( layer.count_params()))
        try:
            print("Activation : " + layer.activation.__name__)
            print(" ")
        except:
            print(" ")
- 1
- 2
- 3
- 4
- 5
- 6
- 7
- 8
- 9
- 10
- 11

这种方法只能提供一些简单的信息,下面我们介绍一些更好用的方法
Keras vis_utils
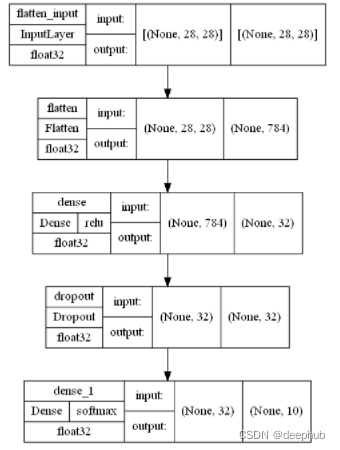
keras.utils.vis_utils 提供了使用 Graphviz 绘制 Keras 模型的实用函数。但是在使用之前需要安装一些其他的依赖:
pip install pydot
pip install pydotplus
pip install graphviz
- 1
- 2
- 3
使用Graphviz,还需要在系统 PATH 中添加 Graphviz bin 文件夹的路径,设置完成后就可以使用了
model_img_file = 'model.png'
tf.keras.utils.plot_model(model, to_file=model_img_file,
                          show_shapes=True,
                          show_layer_activations=True,
                          show_dtype=True,
                          show_layer_names=True )
- 1
- 2
- 3
- 4
- 5
- 6

Visualkears
Visualkears 库只支持 CNN(卷积神经网络)的分层样式架构生成和大多数模型的图形样式架构,包括普通的前馈网络。
pip install visualkeras
- 1
layered view() 用于查看 CNN 模型架构
visualkeras.layered_view(model,legend=True, draw_volume=True)
- 1

TensorBoard
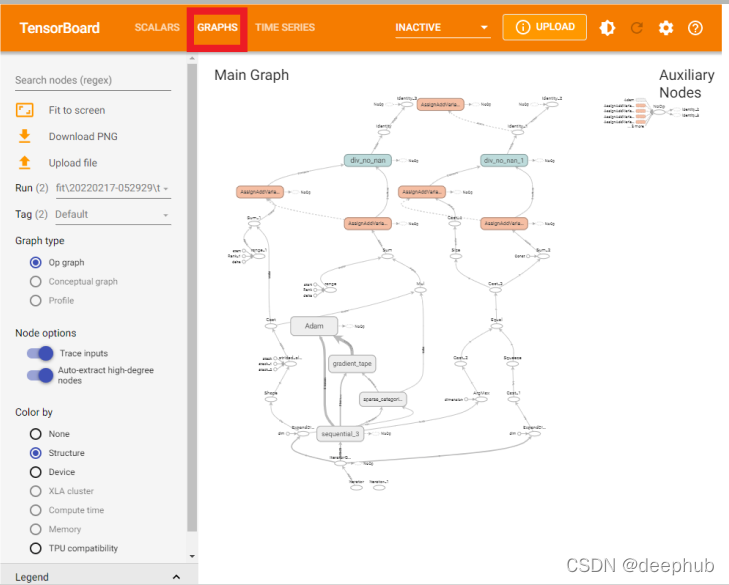
TensorBoard 的 Graphs 可查看模型结构图。对于 Tensorboard,使用如下的方法。
import tensorflow as tf
from datetime import datetime
import tensorboard
- 1
- 2
- 3
如果需要在notebook中使用,可以用下面的语句加载 Tensorboard 扩展
%load_ext tensorboard
- 1
在 fit() 中使用的 Keras Tensorboard Callback
# Define the Keras TensorBoard callback.
logdir="logs/fit/" + datetime.now().strftime("%Y%m%d-%H%M%S")
tensorboard_callback = keras.callbacks.TensorBoard(log_dir=logdir)

# Train the model.
model.fit(
    train_images,
    train_labels,
    batch_size=64,
    epochs=5,
    callbacks=[tensorboard_callback])

model.save("model.h5")
- 1
- 2
- 3
- 4
- 5
- 6
- 7
- 8
- 9
- 10
- 11
- 12
- 13
模型训练完成后,启动 TensorBoard 并等待 UI 加载。
%tensorboard --logdir logs
- 1
通过单击的“Graphs”就可以看到模型的可视化结果了。

注:在Pytorch 1.8以后中提供了from torch.utils.tensorboard import SummaryWriter也可以生成tensorboard的数据,与tensorboard 对接。
Netron
Netron 是专门为神经网络、深度学习和机器学习模型设计的查看器。 它支持 Keras、TensorFlow lite、ONNX、Caffe,并对 PyTorch、TensorFlow 有实验性支持。
pip install netron
- 1
浏览器并输入netron.app ,请单击“打开模型”并选择 h5 文件的路径上传。

就可以看到每一层的可视化结果了。
在 PyTorch 中构建一个简单的深度学习模型
import torch
from torch import nn
# Get cpu or gpu device for training.
device = "cuda" if torch.cuda.is_available() else "cpu"
print(f"Using {device} device")
class NeuralNetwork(nn.Module):
    def __init__(self):
        super(NeuralNetwork, self).__init__()
        self.flatten = nn.Flatten()
        self.linear_relu_stack = nn.Sequential(
            nn.Linear(28*28, 512),
            nn.ReLU(),
            nn.Linear(512, 512),
            nn.ReLU(),
            nn.Linear(512, 10),
        )def forward(self, x):
        x = self.flatten(x)
        logits = self.linear_relu_stack(x)
        return logits
pytorch_model = NeuralNetwork().to(device)
x = torch.randn(  512, 28,28,1).requires_grad_(True)
y = pytorch_model(x)
- 1
- 2
- 3
- 4
- 5
- 6
- 7
- 8
- 9
- 10
- 11
- 12
- 13
- 14
- 15
- 16
- 17
- 18
- 19
- 20
- 21
- 22
查看模型架构最直接的方法是打印它。
print(pytorch_model)
- 1

虽然可以看到完整的模型架构,但是效果还没有Keras的内置函数效果好,下面介绍一个很好用的库解决这个问题。
PyTorchViz
PyTorchViz 依赖于graphviz,所以也需要安装:
pip install graphviz
pip install torchviz
- 1
- 2
使用PyTorchViz 可视化模型非常简单,只需要一个方法即可:
from torchviz import make_dot
make_dot(y, params=dict(list(pytorch_model.named_parameters()))).render("torchviz", format="png")
- 1
- 2
上面的代码生成了一个torchviz.png文件,如下图。

总结
可视化模型架构可以更好的解释深度学习模型。 模型结构可视化显示层数、每层数据的输入和输出形状、使用的激活函数以及每层中的参数数量,为优化模型提供更好的理解。
https://www.overfit.cn/post/dff81951b62d48f79ff4995c1eedbbb3
作者:Renu Khandelwal


