
- 1Python重要知识点梳理一_用分支结构实现以下输出: 输入一个0-40之间的整数,当接收的整数在0-10之间,输出:
- 2【开源】基于区块链Hyperledger Fabric V2.5 的农产品/商品等的通用溯源系统
- 3Unreal 和 Unity 3D 各有什么特点?如何选择?_unity unreal
- 4Java实现Base64加解密的方式_java base64
- 5在 M1/M2 芯片的Mac上安装最新原生 ruby 的超简单方法(无需rvm)_ruby 支持m1
- 6普洛斯与宁德时代签署战略合作协议;高博昌平国际研究型医院成为北京自贸区首批签约项目 | 美通企业日报...
- 7聚类项目:2.模型搭建,开始训练_sovit 聚类模型
- 8STP内容扩充 PVST MSTP 流量负载分担_mstp对接pvst
- 9mac清理磁盘空间软件有哪些 mac清理磁盘空间怎么清理_mac上有哪些管理空间的
- 10Codeium的使用_codeium使用教程
flink-metric原理与实战_flink自定义业务埋点
赞
踩
一、背景介绍
flink内部实现了一套metric数据收集库。同时flink自身系统有一些固定的metric数据,包括系统的一些指标,CPU、内存、 IO或者各个task运行的一些指标。具体包含那些指标可以查看官方文档: flink-metric。同时我们也可以利用系统的metric库在自己的代码中进行打点收集metrics数据。此外, flink提供了外部接口reporter,可以用来导出这些metrics数据。
二、Metric类别
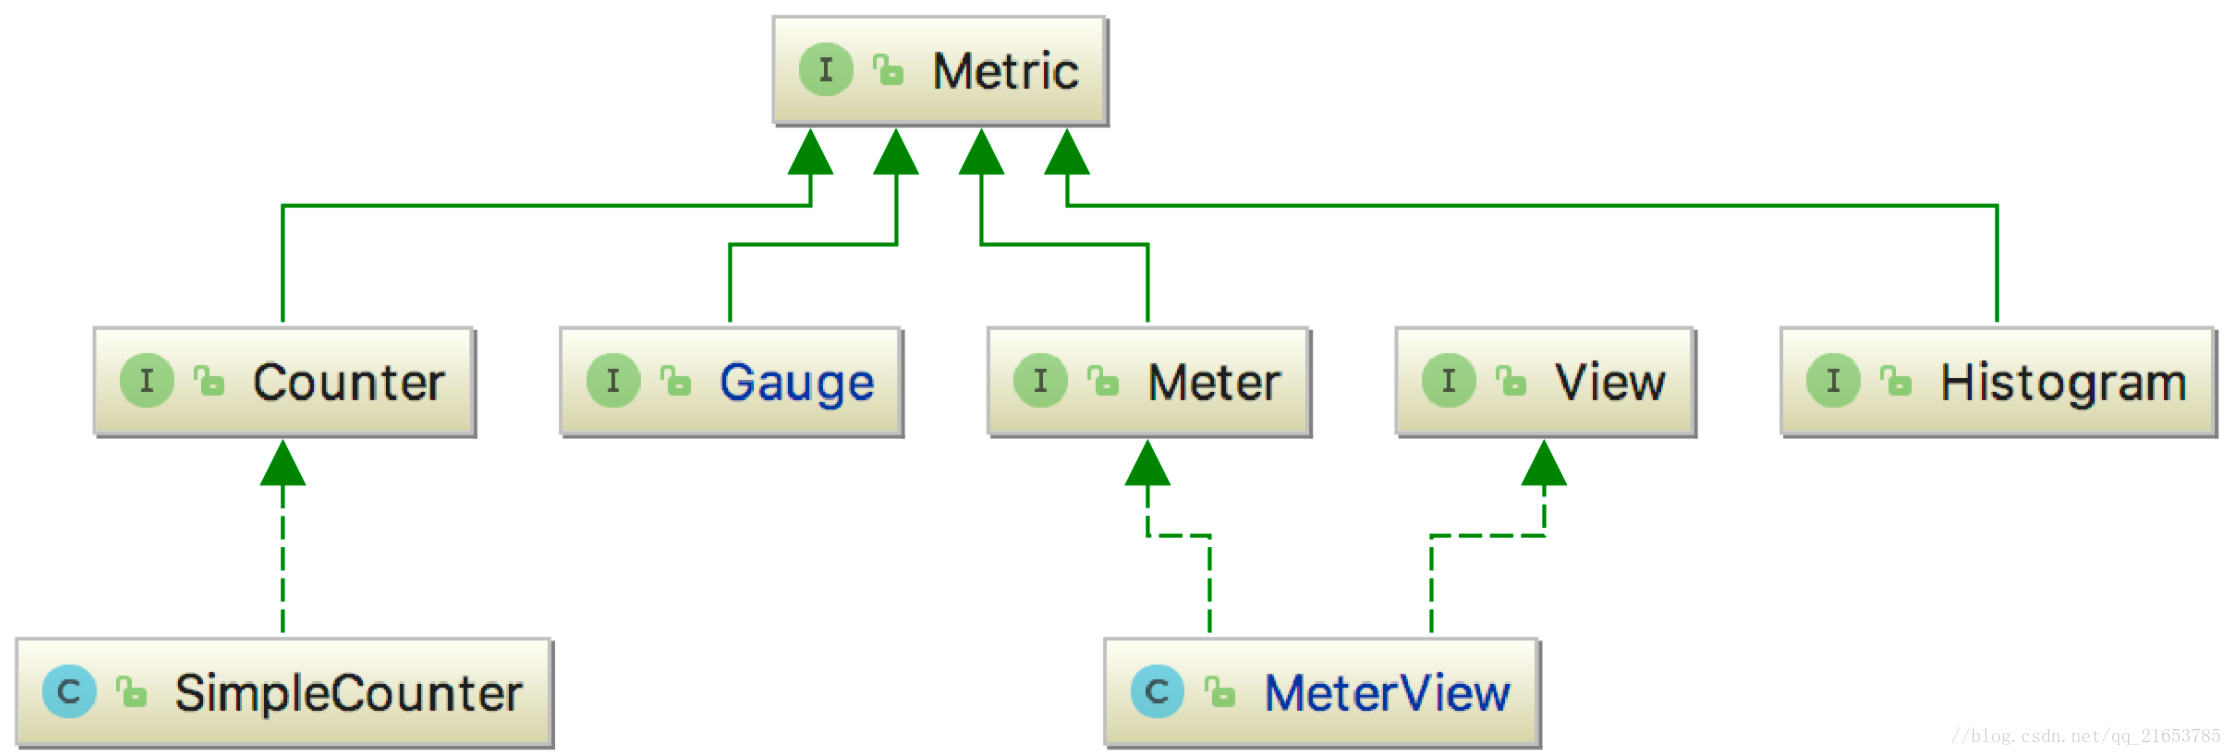
从图中可以看出,Metric这个接口有四个直接子类,分别是:
Gauge —— 最简单的度量指标,只是简单的返回一个值,比如当前实时读取kafka数据的条数
Counter —— 计数器,在一些情况下,会比Gauge高效,比如通过一个AtomicLong变量来统计一个队列的长度;
Meter —— 吞吐量的度量,也就是一系列事件发生的速率,例如TPS;
Histogram —— 度量值的统计结果,如最大值、最小值、平均值,以及分布情况等。
三、Metric使用
在官方的文档中有介绍, 需要继承 Richfunction 才能获得对应的metric对象,用法如下:
- public class MyMapper extends RichMapFunction<String, String> {
- private transient Counter counter;
-
- @Override
- public void open(Configuration config) {
- this.counter = getRuntimeContext()
- .getMetricGroup()
- .counter("myCounter");
- }
-
- @Override
- public String map(String value) throws Exception {
- this.counter.inc();
- return value;
- }
- }

自定义监控指标会在Flink WebUI显示出来,如需在外部系统显示,需要自定义reporter类。
四、监控指标接入外部系统
Flink 内置了很多 Reporter,对外部系统的技术选型可以参考,比如 JMX 是 java 自带的技术,不严格属于第三方。还有InfluxDB、Prometheus、Slf4j(直接打 log 里)等,调试时候很好用,可以直接看 logger,Flink 本身自带日志系统,会打到 Flink 框架包里面去。
详见官方文档:
https://ci.apache.org/projects/flink/flink-docs-release-1.8/monitoring/metrics.html
1.自定义reporter(参考自带的influxDB)
- public class InfluxdbReporter extends AbstractReporter<MeasurementInfo> implements Scheduled {
-
- private String database;
- private String retentionPolicy;
- private InfluxDB influxDB;
-
- public InfluxdbReporter() {
- super(new MeasurementInfoProvider());
- }
-
- @Override
- public void open(MetricConfig config) {
- String host = getString(config, HOST);
- int port = getInteger(config, PORT);
- if (!isValidHost(host) || !isValidPort(port)) {
- throw new IllegalArgumentException("Invalid host/port configuration. Host: " + host + " Port: " + port);
- }
- String database = getString(config, DB);
- if (database == null) {
- throw new IllegalArgumentException("'" + DB.key() + "' configuration option is not set");
- }
- String url = String.format("http://%s:%d", host, port);
- String username = getString(config, USERNAME);
- String password = getString(config, PASSWORD);
-
- this.database = database;
- this.retentionPolicy = getString(config, RETENTION_POLICY);
- if (username != null && password != null) {
- influxDB = InfluxDBFactory.connect(url, username, password);
- } else {
- influxDB = InfluxDBFactory.connect(url);
- }
-
- log.info("Configured InfluxDBReporter with {host:{}, port:{}, db:{}, and retentionPolicy:{}}", host, port, database, retentionPolicy);
- }
-
- @Override
- public void close() {
- if (influxDB != null) {
- influxDB.close();
- influxDB = null;
- }
- }
-
- @Override
- public void report() {
- BatchPoints report = buildReport();
- if (report != null) {
- influxDB.write(report);
- }
- }
-
- @Nullable
- private BatchPoints buildReport() {
- Instant timestamp = Instant.now();
- BatchPoints.Builder report = BatchPoints.database(database);
- report.retentionPolicy(retentionPolicy);
- try {
- for (Map.Entry<Gauge<?>, MeasurementInfo> entry : gauges.entrySet()) {
- report.point(MetricMapper.map(entry.getValue(), timestamp, entry.getKey()));
- }
-
- for (Map.Entry<Counter, MeasurementInfo> entry : counters.entrySet()) {
- report.point(MetricMapper.map(entry.getValue(), timestamp, entry.getKey()));
- }
-
- for (Map.Entry<Histogram, MeasurementInfo> entry : histograms.entrySet()) {
- report.point(MetricMapper.map(entry.getValue(), timestamp, entry.getKey()));
- }
-
- for (Map.Entry<Meter, MeasurementInfo> entry : meters.entrySet()) {
- report.point(MetricMapper.map(entry.getValue(), timestamp, entry.getKey()));
- }
- }
- catch (ConcurrentModificationException | NoSuchElementException e) {
- // ignore - may happen when metrics are concurrently added or removed
- // report next time
- return null;
- }
- return report.build();
- }
-
- private static boolean isValidHost(String host) {
- return host != null && !host.isEmpty();
- }
-
- private static boolean isValidPort(int port) {
- return 0 < port && port <= 65535;
- }
- }
2.配置文件
- metrics.reporter.influxdb.class: org.apache.flink.metrics.influxdb.InfluxdbReporter
- metrics.reporter.influxdb.host: 192.168.2.x
- metrics.reporter.influxdb.port: 8086
- metrics.reporter.influxdb.db: flink_metrics
- metrics.reporter.influxdb.username: gzdata
- metrics.reporter.influxdb.password: gzdata
可以自定义配置,在配置文件中配置:
metrics.reporter.your_monitor.config.b: your_b_value然后在open方法中可以直接获取到。
输出到influxDB详见:https://blog.csdn.net/qq_23160237/article/details/98058632

