热门标签
热门文章
- 1AIC,BIC信息准则_bic准则公式
- 2Docker容器、Serverless与微服务:腾讯云云原生架构技术实践案例集解析
- 3吴恩达深度学习笔记-NLP & Word Embeddings(第14课)
- 4AI智能剪辑,快速剪辑出需要的视频_选出一款ai软件,用文字或图列出生成剪辑内容的详细过程
- 5使用vscode进行python的单元测试,提高开发效率_vscode单元测试
- 6Deep Learning Techniques for Text Classification_creating deep neural networks for text classificat
- 7王小川大模型2个月交卷!开源7B规模里中文最强,GitHub揽星2.2k
- 82.搭建神经网络-pytorch与自然语言处理_x = f.max_pool2d(f.relu(self.conv1(x)), (2, 2))
- 9《书生·浦语大模型全链路开源开放体系》学习笔记
- 10K8S之Configmap的介绍和使用
当前位置: article > 正文
Python使用Matplotlib通过鼠标交互实现缩放、移动以及线上点坐标显示功能_matplotlib缩放交互
作者:繁依Fanyi0 | 2024-04-06 10:04:42
赞
踩
matplotlib缩放交互
-
- import numpy as np
- import matplotlib.pyplot as plt
- import matplotlib as mpl
-
- from matplotlib.text import Text, Annotation
- from matplotlib.patches import Polygon, Rectangle, Circle, Arrow, ConnectionPatch,Ellipse,FancyBboxPatch
- from matplotlib.widgets import Button, Slider, Widget
-
-
- def call_move(event, fig): # event mouse press/release
- global mPress # whether mouse button press or not
- global startx
- global starty
- # print(mPress)
- if event.name=='button_press_event':
- axtemp=event.inaxes
- # Whether mouse in a coordinate system or not, yes is the figure in the mouse location, no is None
- if axtemp and event.button==1:
- print(event)
- mPress=True
- startx=event.xdata
- starty=event.ydata
- elif event.name=='button_release_event':
- axtemp=event.inaxes
- if axtemp and event.button==1:
- mPress=False
- elif event.name=='motion_notify_event':
- axtemp=event.inaxes
- if axtemp and event.button==1 and mPress: # the mouse continuing press
- x_min, x_max = axtemp.get_xlim()
- y_min, y_max = axtemp.get_ylim()
- w=x_max-x_min
- h=y_max-y_min
- # mouse movement
- mx=event.xdata-startx
- my=event.ydata-starty
- axtemp.set(xlim=(x_min-mx, x_min-mx+w))
- axtemp.set(ylim=(y_min-my, y_min-my+h))
- fig.canvas.draw_idle() # Delay drawing
- return
-
-
- def call_scroll(event, fig):
- print(event.name)
- axtemp=event.inaxes
- print('event:',event)
- print(event.xdata,event.ydata)
- # caculate the xlim and ylim after zooming
- if axtemp:
- x_min, x_max = axtemp.get_xlim()
- y_min, y_max = axtemp.get_ylim()
- w = x_max - x_min
- h = y_max - y_min
- curx=event.xdata
- cury=event.ydata
- curXposition=(curx - x_min) / w
- curYposition=(cury - y_min) / h
- # Zoom the figure for 1.1 times
- if event.button == 'down':
- print('befor:',w,h)
- w = w*1.1
- h = h*1.1
- print('down',w,h)
- elif event.button == 'up':
- print('befor:',w,h)
- w = w/1.1
- h = h/1.1
- print('up',w,h)
- print(curXposition,curYposition)
- newx=curx - w*curXposition
- newy=cury - h*curYposition
- axtemp.set(xlim=(newx, newx+w))
- axtemp.set(ylim=(newy, newy+h))
- fig.canvas.draw_idle() # drawing
-
-
-
- def update_annot(ind, l1, annot, x_str, y_str, fig):
- posx = np.array(l1.get_data())[0][ind["ind"][0]] #get the x in the line
- posy = np.array(l1.get_data())[1][ind["ind"][0]] #get the y in the line
- annot.xy = ([posx, posy])
- text = "{}, {}".format(" ".join([x_str[n] for n in ind["ind"]]),
- " ".join([y_str[n] for n in ind["ind"]]))
-
- annot.set_text(text)
- cmap = plt.cm.RdYlGn
- norm = plt.Normalize(1,4)
- c = np.random.randint(1,5,size=10) # the upper colour
- annot.get_bbox_patch().set_facecolor(cmap(norm(c[ind["ind"][0]])))
- annot.get_bbox_patch().set_alpha(0.4)
-
-
-
- def hover(event, l1, annot, ax, x_str, y_str, fig):
-
- vis = annot.get_visible()
- if event.inaxes == ax:
- cont, ind = l1.contains(event)
- if cont: # the mouse in the point
- update_annot(ind, l1, annot, x_str, y_str, fig)
- annot.set_visible(True)
- else:
- if vis:
- annot.set_visible(False)
- fig.canvas.draw_idle()
-
-
-
-
- def draw():
- fig = plt.figure()
- ax = fig.add_subplot(111)
-
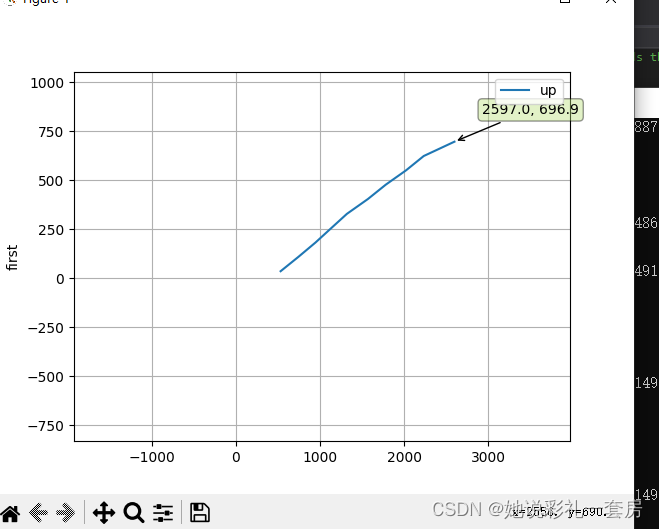
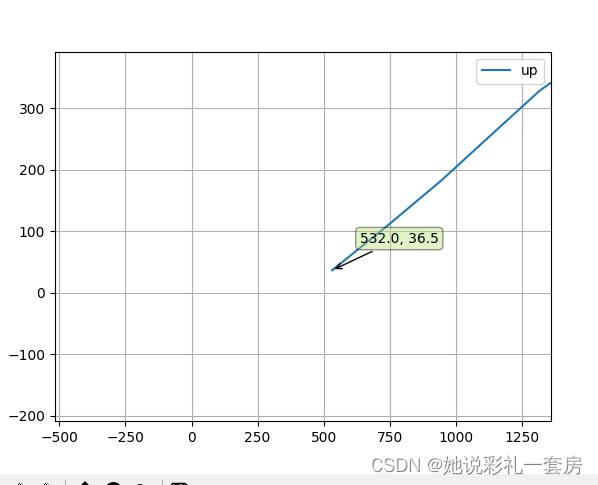
- x = np.array([2597.0, 2232.0, 2022.0, 1781.0, 1569.0, 1319.0, 1132.0, 946.0, 743.0, 532.0]) #get x
- x_str = np.array(x).astype(str)
- y = np.array([696.9, 623.8, 550.8, 477.7, 404.6, 328.8, 255.7, 182.7, 109.6, 36.5])# get y
- y_str = np.array(y).astype(str)
-
- annot = ax.annotate("", xy=(0,0), xytext=(20,20),textcoords="offset points",
- bbox=dict(boxstyle="round", fc="w"),
- arrowprops=dict(arrowstyle="->"))
- plt.ylabel('first')
- l1, = plt.plot(x, y)
- #l2, = plt.plot(x, y2,color='red',linewidth=1.0,linestyle='--',label='square line')
- #plt.legend(handles=[l1, l2], labels=['up', 'down'], loc='upper right')
- plt.legend(handles=[l1], labels=['up'], loc='upper right')
- annot.set_visible(False) # mouse not display the information when not pointing
- plt.grid()
-
- startx=0
- starty=0
- mPress=False
- fig.canvas.mpl_connect('scroll_event', lambda event: call_scroll(event, fig)) # Event mouse wheel
- fig.canvas.mpl_connect('button_press_event', lambda event: call_move(event, fig)) # Event mouse button press
- fig.canvas.mpl_connect('button_release_event', lambda event: call_move(event, fig)) # Event mouse button release
- # fig.canvas.mpl_connect('draw_event', call_move) # Event draw figure
- fig.canvas.mpl_connect('motion_notify_event', lambda event: call_move(event, fig)) # Event mouse move
- fig.canvas.mpl_connect("motion_notify_event", lambda event: hover(event, l1, annot, ax, x_str, y_str, fig))
- x_min = min(x)
- x_max = max(x)
- y_min = min(y)
- y_max = max(y)
-
- ax.set_xlim(x_min, x_max) # xlabel start limition
- ax.set_ylim(y_min, y_max) # ylabel start limition
-
- plt.show()
-
-
-
- draw()

参考文章:
缩放:python 桌面软件开发-matplotlib画图鼠标缩放拖动_matplotlib缩放-CSDN博客
获取点坐标参考的文章忘了,侵权即删


声明:本文内容由网友自发贡献,不代表【wpsshop博客】立场,版权归原作者所有,本站不承担相应法律责任。如您发现有侵权的内容,请联系我们。转载请注明出处:https://www.wpsshop.cn/w/繁依Fanyi0/article/detail/371284?site
推荐阅读
相关标签


