
- 1数字图像处理与Python语言实现-常见图像特效(二)
- 2Java微服务篇4——Elastic search_es实现case when
- 3PTA基础编程题目集 之 Python解法(7-22)_pta龟兔赛跑python答案
- 4vscode配置C++环境(图文详解)_vscode c++环境
- 5ArchLinux安装fcitx5-rime_fcitx-rime
- 6教你如何在Mac上搭建自己的服务器——Nginx_mac 搭建自己的服务器
- 7初学Linux基本的命令操作应当记牢
- 8使用vscode远程服务器,让代码在vscode关闭后也在服务器后台运行_vscode连接服务器运行代码
- 9python 并行化介绍,ThreadPool对象map函数的使用_threadpool map
- 10hadoop使用公平调度器
【机器学习】逻辑回归之心脏病预测_预测心胀病机器代码
赞
踩
目录
一、分析数据
- from IPython.core.display_functions import display
- import numpy as np
- import pandas as pd
-
- df_heart = pd.read_csv("./heart.csv") # 读取文件
- display(df_heart)
- # df.head() # 显示前5行数据
- df_heart.tail() #显示后五行
它有三个部分:
data部分:303条数据
最后一列为标签
target部分: 303条 0代表无心脏病,1代表有心脏病
表头部分: 13个属性(特征)-影响心脏病的因素
'''
cp:胸痛类型
trestbps:休息时血压
chol:胆固醇
fbs:血糖
restecg:心电图
thalach:最大心率
exang:运动后心绞痛
oldpeak:运动后ST段压低
slope:运动高峰期ST段的斜率
ca:主动脉荧光造影染色数
thal:缺陷种类
target:0代表无心脏病,1代表有心脏病
'''
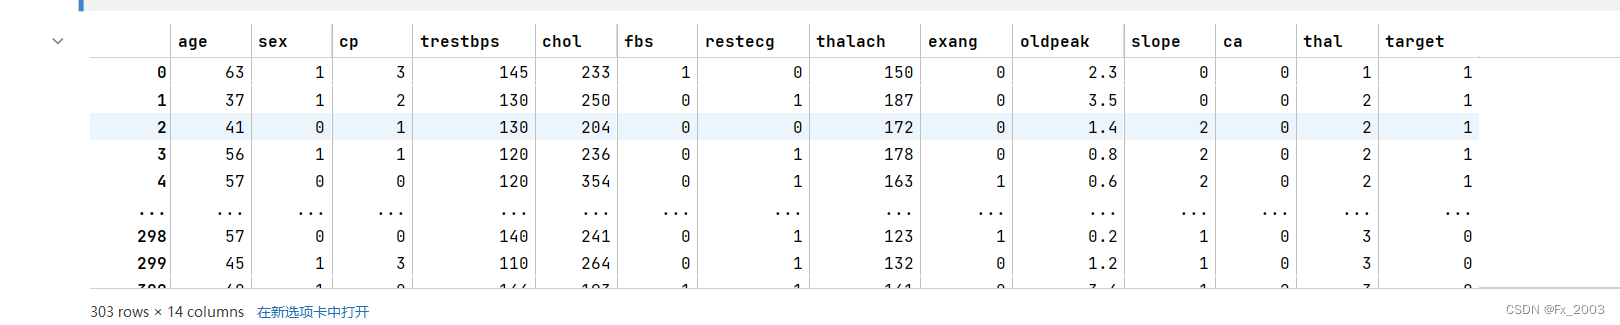
统计其中有多少个有心脏病:
- # df_heart.sex.value_counts()
- num=df_heart.target.value_counts()
- print(num[0]) # 输出类别数目(0/1)
- num
输出如下:
可见138人没有心脏病,165人有
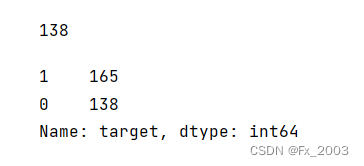
一些可视化处理
散点图:以心率和年龄为例
- from matplotlib import pyplot as plt
- #thalach:最大心率
- #散点图
- plt.scatter(x=df_heart.age[df_heart.target == 1],
- y=df_heart.thalach[(df_heart.target == 1)], c="red")
- plt.scatter(x=df_heart.age[df_heart.target == 0],
- y=df_heart.thalach[(df_heart.target == 0)])
-
- plt.legend(["Disease", "No Disease"]) # 显示图例
- plt.xlabel("Age") # X轴:年龄
- plt.ylabel("Thalach") # Y轴:最大心率
- plt.show()
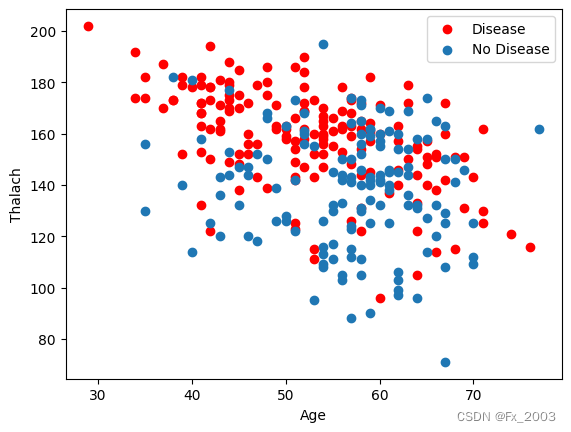
二、 处理数据
文本型变量应当转换成0、1数据格式
例如性别,取值为0、1,对于男女
数据集中有三个需要处理的文本型变量----转换成哑变量
这些文本型变量,比如cp,它们的取值是0、1、2、3,但是这个值的大小是没有比较意义的,但是计算机会把它们理解为数值,所以我们需要转换为哑变量 转换成0、1数据格式
代码如下:
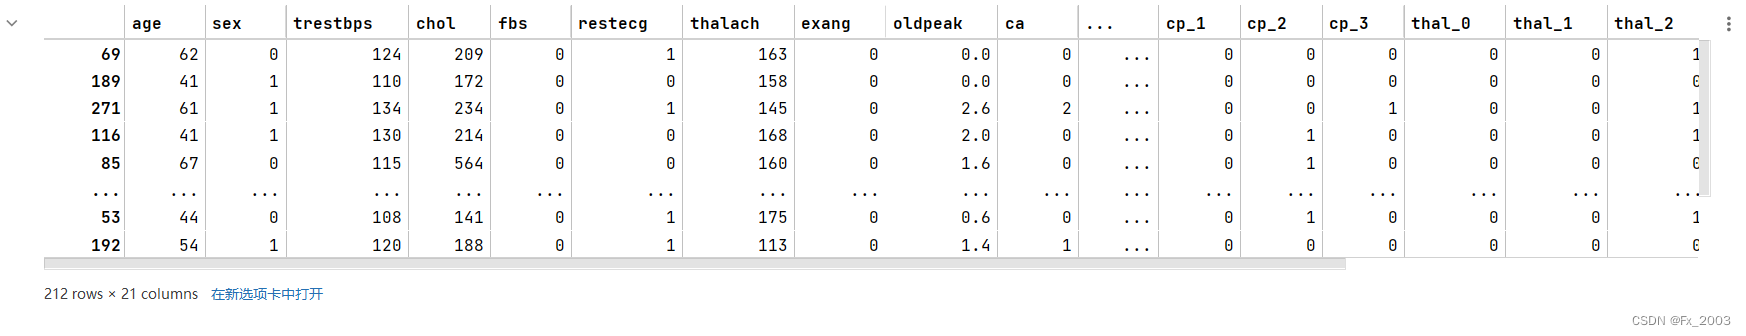
- # 把3个文本型变量转换为哑变量
-
- #get_dummies
- a = pd.get_dummies(df_heart['cp'], prefix="cp")
- b = pd.get_dummies(df_heart['thal'], prefix="thal")
- c = pd.get_dummies(df_heart['slope'], prefix="slope")
- #drop
- df_heart = df_heart.drop(columns=['cp', 'thal', 'slope']) #去掉这三列
-
- # 添加哑变量
- #拼接列表
- df_heart = pd.concat([df_heart, a, b, c], axis=1)
- df_heart.head() # 显示新的dataframe
输出如下:
其中:
concat 用来拼接或合并数据,其根据不同的轴既可以横向拼接,又可以纵向拼接
它有两个常用参数:
- objs:合并的数据集,一般用列表传入,例如:[df1,df2,df3]
- axis:指定数据拼接时的轴,0是行、1是列
get_dummies:其实相当与独热编码
参考博客:特征提取之pd.get_dummies()用法_那记忆微凉的博客-CSDN博客_pd.get_dummies
比如上面的 cp:胸痛类型 有四个取值:0、1、2、3
那么就变成了四列:cp_0、cp_1。。。。
每一列都是取值0或1
三、构建特征集和标签集
1、代码如下
- X = df_heart.drop(['target'], axis=1) # 特征集
- y = df_heart.target.values # 标签集
- y = y.reshape(-1, 1) # -1是相对索引,等价于len(y)
- print("张量X的形状:", X.shape)
- print("张量y的形状:", y.shape)
- # X
- y
2、输出如下:
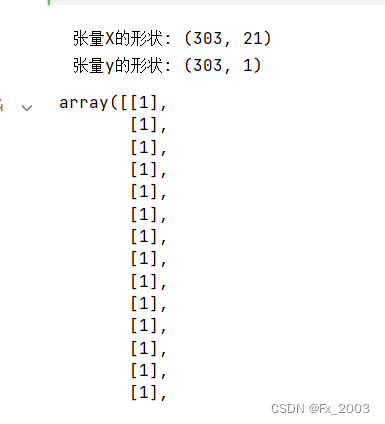
这个reshape可以用来转换这个行列,
比如3x4的数据我,reshape(12,1),就变成了12行的列向量
3、拆分训练集和验证集,打乱顺序
用sklearn的拆分工具
- from sklearn.model_selection import train_test_split
-
- X_train, X_test, y_train, y_test = train_test_split(X, y, test_size=0.3)
- X_train
可以看到,已经打乱顺序,
至于为什么是212行?
因为我X_train, X_test, y_train, y_test = train_test_split(X, y, test_size=0.3)
test_size=0.3 说明验证集占比30%,而303*0.7=212.1,取整212
四、训练模型
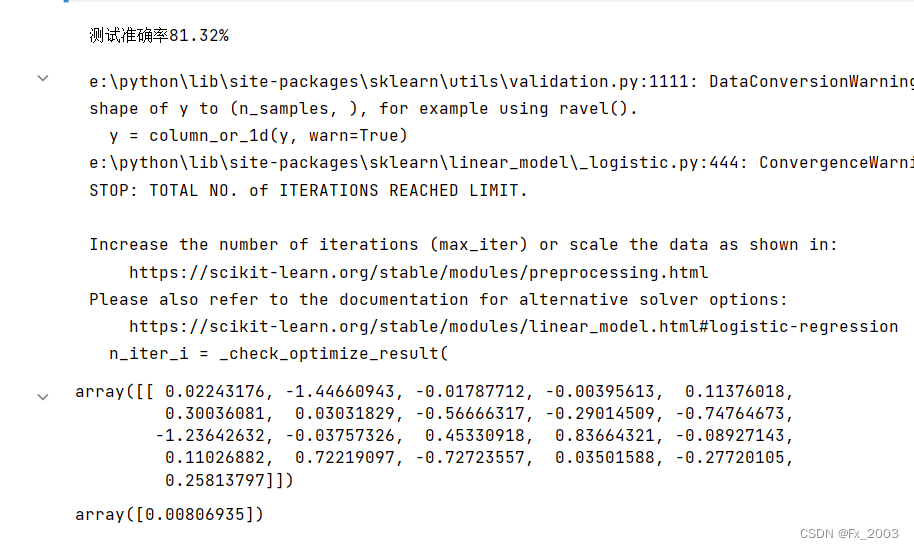
- from sklearn.linear_model import LogisticRegression #导入逻辑回归模型
-
- lr = LogisticRegression()
- lr.fit(X_train, y_train) # 拟合
- print("测试准确率{:.2f}%".format(lr.score(X_test, y_test) * 100))
- display(lr.coef_,lr.intercept_)
model.coef_:斜率 正值说明正相关,负值说明负相关model.intercept_:截距(用的默认的----fit_intercept=True)
输出:
五、开始预测
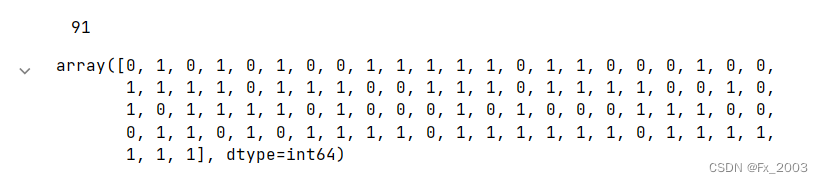
- y_predict = lr.predict(X_test)
- print(len(y_predict))
- y_predict
输出为 :(91=303-212)
六、评价
print("测试准确率{:.2f}%".format(lr.score(X_test, y_test) * 100))输出如下:

 由于文档资料越来越多,将所有资料都存放在自己的电脑上容易混淆,并且也不利于分享。这种情况下,考虑将资料上传SVN统一管理,这样一来其他人也能很方便的查略各种资料。当SVN安装在局域网内的话,想要远程访问资料库或者代码将会受到限制,为了能从公... [详细]
赞
踩
- 目录1前言.11.1植物的发展史.11.1.1植物界的类群及多样性.11.1.2植物的分类等级.21.2植物的识别方法.31.2.1花与种子的特性.31.2.2叶子的特征.31.3什么是数字图像处理.51.3.1数字图像处理概念及其意义.5... [详细]
赞
踩
- KafkaConnect是一个高伸缩性、高可靠性的数据集成工具,用于在ApacheKafka与其他系统间进行数据搬运以及执行ETL操作,比如KafkaConnect能够将文件系统中某些文件的内容全部灌入Kafkatopic中或者是把Kafk... [详细]
赞
踩
- 【代码】axios结合ts使用,取消请求,全局统一获取数据,抛出错误信息。axios结合ts使用,取消请求,全局统一获取数据,抛出错误信息通常在开发时,后端向前端返回的数据可以如下:1使用restfulapi充分利用http状态码,然后在d... [详细]
赞
踩
- 本设计主要实现集人性化、高效率、便捷等优点于一身的学生信息管理系统,完成用户管理、班级管理、学生成绩管理、学籍信息管理、排课信息管理、社团信息管理等功能模块。系统通过浏览器与服务器进行通信,实现数据的交互与变更。本系统通过科学的管理方式、便... [详细]
赞
踩
- article
npm install 卡在了 reify:rxjs: timing reifyNode,出现 gyp ERR find Python、gyp ERR find VS_reify:fsevents: timing reifynode:node_modules/jest
前言最近跑一个vue的项目,第一步肯定是npminstall,结果就出现我标题上写的那些情况,经过一番搜索,网上一堆方法尝试了,有说叫你用管理员权限运行npminstall--global--productionwindows-build-... [详细]赞
踩
- 开始这是我在工作中开发的一个微信端的h5项目,主要功能是一个答题以及一个调用微信扫描查看一些机器设备信息,功能不多,但麻雀虽小,五脏俱全,vue中常用的技术栈都有涉及到。这篇文章主要是对此项目的一个总结以及对整个项目的开发流程做一个梳理。技... [详细]
赞
踩
- 模型序列化器:有时候我们根据模型类的字段一个个去定义序列化器类中的字段,可能模型类有百个字段,这样一个个定义就显得非常繁琐,所以我们可以使用drf中自带的模型序列化器,即serializers.ModelSerializer.1.定义模型序... [详细]
赞
踩
- 一个完整的测试过程,应该包括测试方法、测试工具、测试范围、测试种类、测试的软件硬件环境、测试进度、测试人员的分工和职责以及测试流程进行详细的定义和整体的描述。包括测试资源,工具,环境,风险评估,缺陷跟踪方式的说明。_djangotest使用... [详细]
赞
踩
- 【WARNING:Ignoredistutilsconfigsinsetup.cfgduetoencodingerrors】,如果安装过程出现这个,可以直接将setup.cfg另存为txt文件。中找到对应的安装命令,这里版本要求推荐torc... [详细]
赞
踩
- JAVASocket简介所谓socket通常也称作”套接字“,用于描述IP地址和端口,是一个通信链的句柄。应用程序通常通过”套接字”向网络发出请求或者应答网络请求。importjava.io.BufferedReader;importjav... [详细]
赞
踩
- vue2element-ui的问题_el-drawer在element哪个版本el-drawer在element哪个版本一个老项目中想使用抽屉el-drawer,死活没有反应。查了下element-ui的版本是2.9.1再看其他一个正常使用... [详细]
赞
踩
- Python爬虫之selenium_pythonseleniumpythonselenium目录1.selenium的介绍2.selenium的作用和工作原理3.selenium的安装以及简单使用4.selenium的简单使用5. ... [详细]
赞
踩
- article
C++——多态2|virtual与析构函数|C++11override 和 final|重载,重写(覆盖),隐藏(重定义对比| 抽象类|子类和父类虚表|多继承|习题|总结_析构函数 override
目录virtual与析构函数C++11override和final重载,重写(覆盖),隐藏(重定义)对比抽象类子类和父类虚表多继承习题多态总结习题_析构函数override析构函数override目录virtual与析构函数 &n... [详细]赞
踩
- 通过python写数据到csv文件的时候,遇到如下图所示的问题,写出来的文件会隔一行:代码如下:importcsv#构建数据集data=[{'name':'张三','age':24,'salary':100},{'name':'李四','a... [详细]
赞
踩
- Updating..._ubuntu18.04安装后ubuntu18.04安装后因某些原因,本博客以后将在以下网址更新~关于Ubuntu18.04/20.04安装后的一系列环境配置过程的总结_安装好ubuntu18-CSDN博客文章浏览阅读... [详细]
赞
踩
- 然而,由于Python2的大量代码和库仍然在使用,所以在升级到Python3时可能需要做一些适配和修改。字符串:在Python2中,字符串可以使用ASCII或Unicode表示,而在Python3中,字符串默认为Unicode,在需要使用A... [详细]
赞
踩
- SimpleGame#include
#definelllonglongusingnamespacestd;constintmaxn=1e5+9;lln,x,k,m;intf[maxn];bitset ... [详细] 赞
踩
- 反编译软件HopperDisassemblerforMac十六进制模式的介绍分享给大家,HopperDisassemblerforMac是一款强大的反编译软件,大多数Hopper功能都可以从Python脚本调用,使您能够以任何方式转换二进制... [详细]
赞
踩
- 通过引入智能数据采集网关,该高端制造企业实现了生产过程的数字化、智能化管理,取得了显著的经济效益和竞争优势。同时,进行数据接口的对接工作,确保数据的完整性和准确性。4、系统集成与部署:最后,将智能数据采集网关集成到企业的生产管理系统中,实现... [详细]
赞
踩

