- 1APUE编程:12---文件I/O之(文件描述符、操作函数:open、openat、creat、close、lseek、read、write)_linux编程 creat 函数
- 2elementUI 上传组件 http-request (覆盖默认的上传行为,可以自定义上传的实现)使用_element-plus http-request
- 3目前最新版AndroidStudio详细安装教程,纯萌新安装_android studio2021 百度云链接
- 4数组元素访问
- 5CNN(六):ResNeXt-50实战_resnext50
- 6linux基础命令-cd_通过cd命令将当前的工作目录变更为mylab的父目录。
- 7厦门阿里云代理商:阿里云云计算什么意思
- 8ECharts - Java 类库 1.0.0 发布_enhancedoption
- 9UniApp 统一的接口 myRequest 用于进行 HTTP 请求_my.request请求
- 10【耗时30天修改上百次!】适合所有嵌入式人群的最全人工智能学习路线,我给做出来了!...
在 LaTeX 中插入表格_latex插入表格
赞
踩
原 文:在 LaTeX 中插入表格
译 者:Xovee
翻译时间:2020-1024
在 LaTeX 中插入表格
在科研论文中,表格是最重要的内容之一。LaTeX 提供了许多定制化表格的功能,包括调整表格大小,合并单元格,改变表格颜色等等。
介绍
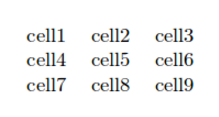
下面的代码展示了一个简单的表格:
\begin{center}
\begin{tabular}{ c c c }
 cell1 & cell2 & cell3 \\
 cell4 & cell5 & cell6 \\
 cell7 & cell8 & cell9
\end{tabular}
\end{center}
- 1
- 2
- 3
- 4
- 5
- 6
- 7

tabular环境是LaTeX默认创建表格的环境。你需要对这个环境手动指定一个参数。{c c c}参数告诉LaTeX,表格将会有三列,每一列都是居中对齐(c: center)。
在 Overleaf 中创建一个简单的表格
你可以在 tabular环境中放置分割线:
\begin{center}
\begin{tabular}{ |c|c|c| }
 \hline
 cell1 & cell2 & cell3 \\
 cell4 & cell5 & cell6 \\
 cell7 & cell8 & cell9 \\
 \hline
\end{tabular}
\end{center}
- 1
- 2
- 3
- 4
- 5
- 6
- 7
- 8
- 9

下面介绍tabular环境中一些重要的参数。
{ |c|c|c| }
这个参数设定了表格中有三列,列旁都有一个竖直的分割线。每一个c都代表这一列中的内容是居中对齐的,你也可以使用r来向右对齐,或者l来向左对齐。
\hline
这个参数会在表格中插入水平的分割线。你可以多次使用这个命令。
cell1 & cell2 & cell3 \\
&符号分割了单元格之间的内容。\\代表着一行的结束。
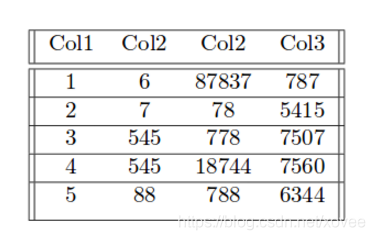
下面展示另外一个例子。
\begin{center}
 \begin{tabular}{||c c c c||}
 \hline
 Col1 & Col2 & Col2 & Col3 \\ [0.5ex]
 \hline\hline
 1 & 6 & 87837 & 787 \\
 \hline
 2 & 7 & 78 & 5415 \\
 \hline
 3 & 545 & 778 & 7507 \\
 \hline
 4 & 545 & 18744 & 7560 \\
 \hline
 5 & 88 & 788 & 6344 \\ [1ex]
 \hline
\end{tabular}
\end{center}
- 1
- 2
- 3
- 4
- 5
- 6
- 7
- 8
- 9
- 10
- 11
- 12
- 13
- 14
- 15
- 16
- 17

在这个例子里,表格中插入了一些双层的线。你可以利用这些线来让表格的内容显示的更加有条理。
固定长度的表格
在设计表格的时候,你也许想要每一列或者整个表格的长度是固定的。下面的例子介绍了如何设定表格的长度。
\begin{center}
\begin{tabular}{ | m{5em} | m{1cm}| m{1cm} | }
\hline
cell1 dummy text dummy text dummy text& cell2 & cell3 \\
\hline
cell1 dummy text dummy text dummy text & cell5 & cell6 \\
\hline
cell7 & cell8 & cell9 \\
\hline
\end{tabular}
\end{center}
- 1
- 2
- 3
- 4
- 5
- 6
- 7
- 8
- 9
- 10
- 11

首先,你需要引入array包:
\usepackage{array}
- 1
在tabular环境中,m{5em}参数对表格中的第一列设定了5em的长度(另外两列的长度是1cm),并且设定了单元格中的内容是水平对齐的。在这里,m代表middle,p代表top,b代表bottom。在标准的表格中,每一行必须手动插入。使用这个参数可以让单元格中的内容自动调整、换行,来满足所设定的固定长度。
如果你不需要控制每一个单元格的宽度,而是想设定整个表格的宽度,并且均等地设定空间,你可以使用tabularx包。请参考下面的例子:
\begin{tabularx}{0.8\textwidth} {
  | >{\raggedright\arraybackslash}X
  | >{\centering\arraybackslash}X
  | >{\raggedleft\arraybackslash}X | }
 \hline
 item 11 & item 12 & item 13 \\
 \hline
 item 21  & item 22  & item 23  \\
\hline
\end{tabularx}
- 1
- 2
- 3
- 4
- 5
- 6
- 7
- 8
- 9
- 10

tabularx环境与tabular环境相似,但是更灵活。在这个例子里,表格的宽度被设定为文字宽度的0.8倍。你还可以使用其他的LaTeX单位。
大括号中的参数(\raggedright\arraybackslash等),设定了每一列的对齐方式:第一列向左对齐,第二列居中对齐,第三列向右对齐。
合并行和列
你可以合并行和列来生成更大的单元格。下面的例子介绍了如何使用\multicolumn命令来合并列。
\begin{tabular}{ |p{3cm}||p{3cm}|p{3cm}|p{3cm}|  }
 \hline
 \multicolumn{4}{|c|}{Country List} \\
 \hline
 Country Name     or Area Name& ISO ALPHA 2 Code &ISO ALPHA 3 Code&ISO numeric Code\\
 \hline
 Afghanistan   & AF    &AFG&   004\\
 Aland Islands&   AX  & ALA   &248\\
 Albania &AL & ALB&  008\\
 Algeria    &DZ & DZA&  012\\
 American Samoa&   AS  & ASM&016\\
 Andorra& AD  & AND   &020\\
 Angola& AO  & AGO&024\\
 \hline
\end{tabular}
- 1
- 2
- 3
- 4
- 5
- 6
- 7
- 8
- 9
- 10
- 11
- 12
- 13
- 14
- 15

下面我们介绍这个命令中的各个参数。
{4}
需要合并的列的数量。
{|c|}
这个列会居中对齐(c),并且列两旁有两条竖直的分割线。
{Country List}
单元格中展示的内容。
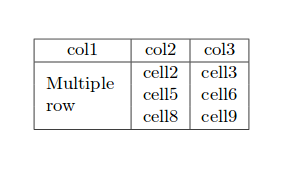
如果你想合并行,你首先需要引入multirow包,然后你可以使用multirow命令。
\begin{center}
\begin{tabular}{ |c|c|c|c| }
\hline
col1 & col2 & col3 \\
\hline
\multirow{3}{4em}{Multiple row} & cell2 & cell3 \\
& cell5 & cell6 \\
& cell8 & cell9 \\
\hline
\end{tabular}
\end{center}
- 1
- 2
- 3
- 4
- 5
- 6
- 7
- 8
- 9
- 10
- 11

这个命令接受三个参数。第一个是需要合并的行数。第二个参数是行的宽度。第三个参数是单元格的内容。
跨越多页的表格
如果你要插入一个非常长的表格,单个页面无法放的下这个表格,那么你可以引入longtable包来让表格跨越多个页面。使用longtable命令:
\documentclass{article}
\usepackage[utf8]{inputenc}
\usepackage{longtable}

\begin{document}

 \begin{longtable}[c]{| c | c |}
 \caption{Long table caption.\label{long}}\\

 \hline
 \multicolumn{2}{| c |}{Begin of Table}\\
 \hline
 Something & something else\\
 \hline
 \endfirsthead

 \hline
 \multicolumn{2}{|c|}{Continuation of Table \ref{long}}\\
 \hline
 Something & something else\\
 \hline
 \endhead

 \hline
 \endfoot

 \hline
 \multicolumn{2}{| c |}{End of Table}\\
 \hline\hline
 \endlastfoot

 Lots of lines & like this\\
 Lots of lines & like this\\
 Lots of lines & like this\\
 Lots of lines & like this\\
 Lots of lines & like this\\
 Lots of lines & like this\\
 Lots of lines & like this\\
 Lots of lines & like this\\
 ...
 Lots of lines & like this\\
 \end{longtable}
- 1
- 2
- 3
- 4
- 5
- 6
- 7
- 8
- 9
- 10
- 11
- 12
- 13
- 14
- 15
- 16
- 17
- 18
- 19
- 20
- 21
- 22
- 23
- 24
- 25
- 26
- 27
- 28
- 29
- 30
- 31
- 32
- 33
- 34
- 35
- 36
- 37
- 38
- 39
- 40
- 41
- 42

longtable的用法和tabular相似。下面介绍长表格的四个关键元素:
\endfirsthead
这个命令之前的内容会出现在第一页中表格的头部。
\endhead
这个命令之前,endfirsthead命令之后的内容,会出现在除了第一页的其他页中,表格的头部。
\endfoot
与endhead相似。在这个命令之前,\endhead之后,内容会出现在除了最后一页的其他页中,表格的底部。
\endlastfoot
与endfirsthead相似。在这个命令之前,\endfoot命令之后的内容,会仅出现在最后一页表格的底部。
表格的位置
设定表格的位置非常简单。表格是处于table环境之中的。
\begin{table}[h!]
\centering
 \begin{tabular}{||c c c c||}
 \hline
 Col1 & Col2 & Col2 & Col3 \\ [0.5ex]
 \hline\hline
 1 & 6 & 87837 & 787 \\
 2 & 7 & 78 & 5415 \\
 3 & 545 & 778 & 7507 \\
 4 & 545 & 18744 & 7560 \\
 5 & 88 & 788 & 6344 \\ [1ex]
 \hline
 \end{tabular}
\end{table}
- 1
- 2
- 3
- 4
- 5
- 6
- 7
- 8
- 9
- 10
- 11
- 12
- 13
- 14

在这个例子中,h!参数代表着表格的位置是必须这里,它覆盖了LaTeX表格的默认设定。其他可能的位置参数包括:
h
大约出现在这里(here)。
t
出现在页面的顶部(top)。
b
出现在页面的底部(bottom)。
p
将表格放置在一个专门放置表格的特殊页面。
!
覆盖LaTeX内部的参数。
H
将表格精确地放置在其出现的位置,一般等价于h!。
更多例子请见这篇文章。
在上面的例子中我们还使用了下面两个命令:
\centering
这个命令使表格在容器中居中。
[1ex]
这个命令在行中的单元格内添加了额外的空间。
表题、标签、引用
表格可以拥有表题、标签,也可以在文中被引用。
The table \ref{table:1} is an example of referenced \LaTeX elements.

\begin{table}[h!]
\centering
\begin{tabular}{||c c c c||}
 \hline
 Col1 & Col2 & Col2 & Col3 \\ [0.5ex]
 \hline\hline
 1 & 6 & 87837 & 787 \\
 2 & 7 & 78 & 5415 \\
 3 & 545 & 778 & 7507 \\
 4 & 545 & 18744 & 7560 \\
 5 & 88 & 788 & 6344 \\ [1ex]
 \hline
\end{tabular}
\caption{Table to test captions and labels}
\label{table:1}
\end{table}
- 1
- 2
- 3
- 4
- 5
- 6
- 7
- 8
- 9
- 10
- 11
- 12
- 13
- 14
- 15
- 16
- 17
- 18

这个例子中介绍了三个重要的命令:
\caption{Table to test captions and labels}
显然,这个命令设定了表格的标题。你可以将标题放置在表格的上方,或者下方。
\label{table:1}
如果你需要在文档中引用表格,你需要给表格设定一个标签。标签会对表格进行编号。下面的命令可以让你引用标签。
\ref{table:1}
这个命令在文档中会变成表格的编号。
注意:你需要对文档编译两次来让标签正常的显示。
表格列表
创建一个表格的列表非常简单:
\documentclass{article}
\usepackage[utf8]{inputenc}

\begin{document}

\listoftables

...
\end{document}
- 1
- 2
- 3
- 4
- 5
- 6
- 7
- 8
- 9

表格的标题会被用来生成这个列表。如果你使用了babel包,标题“List of Tables"会被相应地替换为对应的语言。更多信息请参考这篇文章。
改变表格的外表
你可以自定义表格的外表,来让它更加好看。下面我们将介绍如何更改表格中线的粗细、线的颜色、单元格的背景色等。
线的宽度、单元格的填充
你可以增加表格中列之间的间距、行的间距,来让表格的可读性更强。
\documentclass{article}
\usepackage[utf8]{inputenc}

\setlength{\arrayrulewidth}{1mm}
\setlength{\tabcolsep}{18pt}
\renewcommand{\arraystretch}{1.5}

\begin{document}
\begin{tabular}{ |p{3cm}|p{3cm}|p{3cm}|  }
\hline
\multicolumn{3}{|c|}{Country List} \\
\hline
Country Name     or Area Name& ISO ALPHA 2 Code &ISO ALPHA 3 \\
\hline
Afghanistan & AF &AFG \\
Aland Islands & AX   & ALA \\
Albania &AL & ALB \\
Algeria    &DZ & DZA \\
American Samoa & AS & ASM \\
Andorra & AD & AND   \\
Angola & AO & AGO \\
\hline
\end{tabular}
\end{document}
- 1
- 2
- 3
- 4
- 5
- 6
- 7
- 8
- 9
- 10
- 11
- 12
- 13
- 14
- 15
- 16
- 17
- 18
- 19
- 20
- 21
- 22
- 23
- 24

\setlength{\arrayrulewidth}{1mm}
这个命令设定了表格边界的宽度。例子中使用的宽度是1mm,你也可以设定其他的宽度。
\setlength{\tabcolsep}{18pt}
单元格的边界和单元格中的文字的距离被设置为18pt。你也可以设置其他的距离。
\renewcommand{\arraystretch}{1.5}
行高被设定为默认的1.5倍。
交替对行着色
在表格中,人们经常使用两种颜色来对不同的行进行交替着色,来增强表格的可读性。你可以使用xcolor包。
\documentclass{article}
\usepackage[table]{xcolor}

\setlength{\arrayrulewidth}{1mm}
\setlength{\tabcolsep}{18pt}
\renewcommand{\arraystretch}{2.5}

{\rowcolors{3}{green!80!yellow!50}{green!70!yellow!40}
\begin{tabular}{ |p{3cm}|p{3cm}|p{3cm}|  }
\hline
\multicolumn{3}{|c|}{Country List} \\
\hline
Country Name     or Area Name& ISO ALPHA 2 Code &ISO ALPHA 3 \\
\hline
Afghanistan & AF &AFG \\
Aland Islands & AX   & ALA \\
Albania &AL & ALB \\
Algeria    &DZ & DZA \\
American Samoa & AS & ASM \\
Andorra & AD & AND   \\
Angola & AO & AGO \\
\hline
\end{tabular}
}
- 1
- 2
- 3
- 4
- 5
- 6
- 7
- 8
- 9
- 10
- 11
- 12
- 13
- 14
- 15
- 16
- 17
- 18
- 19
- 20
- 21
- 22
- 23
- 24

注意命令右边大括号中的参数。
\rowcolors{3}{green!80!yellow!50}{green!70!yellow!40}
- 1
命令\rowcolors接收三个参数:
- 开始着色的行
- 奇数行的颜色
- 偶数行的颜色
参考xcolor包的官方文档(见文末链接),其中介绍了可用的颜色,以及如何创建自定义的颜色。在这个例子中,不同比例的绿色和黄色混合起来。
为了让上面的命令正常工作,记得在文档的序言部分使用下面的命令:
\usepackage[table]{xcolor}
- 1
对表格着色(单元格、行、列)
表格中的所有元素都可以被着色。你必须引入xcolor包。
下面介绍一个例子:
\documentclass{article}
\usepackage[utf8]{inputenc}
\usepackage[table]{xcolor}

\setlength{\arrayrulewidth}{1mm}
\setlength{\tabcolsep}{18pt}
\renewcommand{\arraystretch}{2.5}

\newcolumntype{s}{>{\columncolor[HTML]{AAACED}} p{3cm}}

\arrayrulecolor[HTML]{DB5800}

\begin{tabular}{ |s|p{3cm}|p{3cm}|  }
\hline
\rowcolor{lightgray} \multicolumn{3}{|c|}{Country List} \\
\hline
Country Name    or Area Name& ISO ALPHA 2 Code &ISO ALPHA 3 \\
\hline
Afghanistan & AF &AFG \\
\rowcolor{gray}
Aland Islands & AX & ALA \\
Albania   &AL & ALB \\
Algeria  &DZ & DZA \\
American Samoa & AS & ASM \\
Andorra & AD & \cellcolor[HTML]{AA0044} AND    \\
Angola & AO & AGO \\
\hline
\end{tabular}
- 1
- 2
- 3
- 4
- 5
- 6
- 7
- 8
- 9
- 10
- 11
- 12
- 13
- 14
- 15
- 16
- 17
- 18
- 19
- 20
- 21
- 22
- 23
- 24
- 25
- 26
- 27
- 28

下面介绍如何更改表格中不同模块的颜色:
- 线的颜色。使用
\arrayrulecolor命令。在这个例子中,我们使用了一种HTML格式,你也可以使用其他可用的格式(参见xcolor的官方文档,见文末链接)。 - 单元格的背景色。使用
\cellcolor命令。你可以直接输入颜色的名字(红色、灰色、绿色等),你也可以使用其他的格式(例如HTML)。 - 行的背景色。使用
\rowcolor命令。 - 列的背景色。这个有一点麻烦。使用下面的命令来定义一种新的列类型:
\newcolumntype{s}{>{\columncolor[HTML]{AAACED}} p{3cm}}
- 1
这个命令定义了一种新的列,叫做s,对齐方式是p,宽度是3cm,颜色是AAACED(HTML格式)。这个新的列类型可以在tabular环境中使用。
参考指南
tabular环境中参数
你可以使用tabular环境来创建表格。
\begin{tabular}[pos]{cols}
 table content
\end{tabular}
- 1
- 2
- 3
它的参数包括:
-
pos:垂直位置。包含下面三种可选值:
t:顶部的线与文本的baseline对齐
b:底部的线与文本的baseline对齐
c或none:文本的baseline直接与表格居中对齐 -
cols:定义了每一列边界的对齐方式。包含下面几种可选值:
l:左对齐的列
c:居中对齐的列
r:右对齐的列
p{'width'}:段落列中的文字顶部水平对齐
m{'width'}:段落列中的文字中间水平对齐
b{'width'}:段落列中的文字底部水平对齐
|:垂直线
||:双垂直线
*{num}{form}:格式重复 num 次;例如*{3}{|l}等价于|l|l|l| -
新的行、单元格之间的间隔,使用下面命令:
&:列之间的分割符
\\:开始一个新行(行后的额外距离可以这样指定:\\[6pt])
\hline:水平线
newline:在段落列中的单元格中开始一个新行
\cline{i-j}:局部添加水平线,开始于第i列,终止于第j列
来自 Xovee 的一些私货
在科研论文写作中,三线表是一种非常流行的最佳实践。其有如下几个要点:
- 能不用竖线就不用
- 能不用横线就不用
- 表格尽量放置在首次引用之后的页首 [t] 或者页尾 [b]
下面是一个示例:
\usepackage{booktabs}

\begin{table*}[t]
    \centering
    \caption{A comparison between UESTC, Xidian University and BUPT.}
    \label{tab:univ-compa}
    \begin{tabular}{lcccrrr}
    \toprule
        \textbf{University} & \textbf{Double-Top (A)} & \textbf{985} & \textbf{211} & \textbf{ARWU Ranking} & \textbf{QS Ranking} & \textbf{US News Ranking} \\ \midrule
        UESTC & $\checkmark$ & $\checkmark$ & $\checkmark$ & 151-200 & 591-600 & 272 \\
        BUPT & & & $\checkmark$ & 601-700 & 801-1000 & 760 \\
        Xidian University & & & $\checkmark$ & 401-500 & n/a & 729 \\
    \bottomrule
    \end{tabular}
\end{table*}
- 1
- 2
- 3
- 4
- 5
- 6
- 7
- 8
- 9
- 10
- 11
- 12
- 13
- 14
- 15
- 16
效果如下:


