
热门标签
热门文章
- 1微信公众号jssdk ios第一次签名失败,刷新后签名成功_签名 首次进入失败 刷新才成功
- 2Android ViewBinding使用详解,圆我大厂梦_viewbinding-7.0.4.aar
- 3shell脚本每日一练(二)_:创建一个u1.txt文件,文件中存放你们小组名单,在计算机中自动创建对应的账户
- 4传奇大爷拿下“数学界诺贝尔奖”;陶哲轩祝贺:他本应更知名
- 5浅谈Winform程序的界面布局设计_winform admin界面布局
- 6Unity2019通过unity获取Android动态权限(不用在Android写插件)_unity permission
- 7一篇文章搞定deepfacelab练丹那些事_deepfacelab神丹
- 8使用 OpenSSL 加密和解密文件_openssl用公钥加密
- 9adb连接不上 daemon not running. starting it now on port 5037_linux中daemon not running; starting now at tcp:5037
- 10万能工具箱合集 小程序源码_软件工具箱源码
当前位置: article > 正文
c# wpf LiveCharts 绑定 多线条 简单试验
作者:AllinToyou | 2024-04-08 02:57:31
赞
踩
c# wpf LiveCharts 绑定 多线条 简单试验
1.概要
c# wpf LiveCharts 绑定 多线条 简单试验
2.代码
- <Window x:Class="WpfApp3.Window4"
- xmlns="http://schemas.microsoft.com/winfx/2006/xaml/presentation"
- xmlns:x="http://schemas.microsoft.com/winfx/2006/xaml"
- xmlns:d="http://schemas.microsoft.com/expression/blend/2008"
- xmlns:mc="http://schemas.openxmlformats.org/markup-compatibility/2006"
- xmlns:lvc="clr-namespace:LiveCharts.Wpf;assembly=LiveCharts.Wpf"
- xmlns:local="clr-namespace:WpfApp3"
- mc:Ignorable="d"
- Title="Window4" Height="450" Width="800">
- <Grid>
- <lvc:CartesianChart Margin="0,0,0,20" LegendLocation="Bottom" Height="220">
- <lvc:CartesianChart.Series>
- <lvc:LineSeries Stroke="#3BC8D7" Fill="#E1F2F6" Title="消费"
- PointGeometrySize="0" Values="{Binding LineValuesSale}" DataLabels="True"/>
- <lvc:LineSeries Stroke="#FF7261" Fill="#FFE3E0" Title="充值"
- PointGeometrySize="0" Values="{Binding LineValuesPay}" DataLabels="True"/>
- </lvc:CartesianChart.Series>
- <lvc:CartesianChart.AxisX>
- <lvc:Axis Labels="{Binding LineLabels}" Margin="10">
- <lvc:Axis.Separator>
- <lvc:Separator StrokeThickness="0.5" Step="1" />
- </lvc:Axis.Separator>
- </lvc:Axis>
- </lvc:CartesianChart.AxisX>
- <lvc:CartesianChart.AxisY>
- <lvc:Axis MinValue="0" ShowLabels="True"/>
- </lvc:CartesianChart.AxisY>
- </lvc:CartesianChart>
- </Grid>
- </Window>

- using LiveCharts;
- using System;
- using System.Collections.Generic;
- using System.Linq;
- using System.Text;
- using System.Threading.Tasks;
- using System.Windows;
- using System.Windows.Controls;
- using System.Windows.Data;
- using System.Windows.Documents;
- using System.Windows.Input;
- using System.Windows.Media;
- using System.Windows.Media.Imaging;
- using System.Windows.Shapes;
-
- namespace WpfApp3
- {
- /// <summary>
- /// Window4.xaml 的交互逻辑
- /// </summary>
- public partial class Window4 : Window
- {
- public Window4()
- {
- InitializeComponent();
- this.DataContext = new HomePgVM3();
- }
- }
- public class HomePgVM3 : NotifyPropertyBase
- {
-
- public string[] LineLabels { get; set; }
- public ChartValues<double> LineValuesSale { get; set; }
- public ChartValues<double> LineValuesPay { get; set; }
-
- public HomePgVM3()
- {
- GetLine();
- }
- private void GetLine()
- {
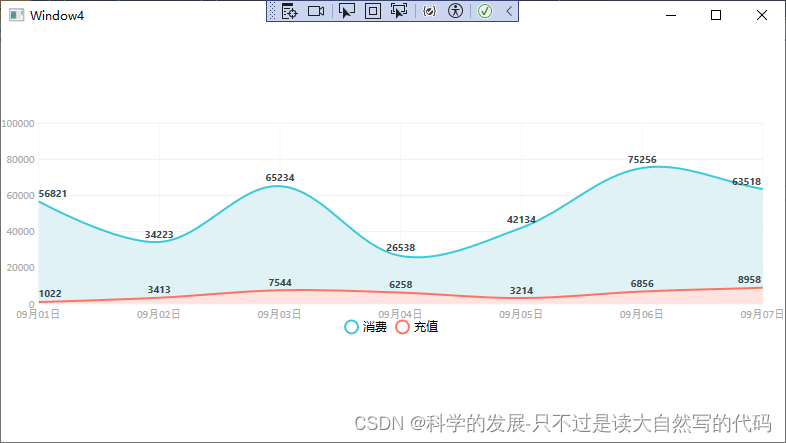
- LineLabels = new[] { "09月01日", "09月02日", "09月03日", "09月04日", "09月05日", "09月06日", "09月07日" };
-
- //消费数据
- LineValuesSale = new ChartValues<double>();
- double[] dValues = new double[] { 56821, 34223, 65234, 26538, 42134, 75256, 63518 };
- for (int i = 0; i < dValues.Length; i++)
- {
- LineValuesSale.Add(dValues[i]);
- }
-
- //充值数据
- LineValuesPay = new ChartValues<double>();
- double[] dValues2 = new double[] { 1022, 3413, 7544, 6258, 3214, 6856, 8958 };
- for (int i = 0; i < dValues2.Length; i++)
- {
- LineValuesPay.Add(dValues2[i]);
- }
- }
-
- }
- }
3.运行结果
声明:本文内容由网友自发贡献,不代表【wpsshop博客】立场,版权归原作者所有,本站不承担相应法律责任。如您发现有侵权的内容,请联系我们。转载请注明出处:https://www.wpsshop.cn/w/AllinToyou/article/detail/382491
推荐阅读
相关标签

