- 1..." to update what will be co" href="/w/你好赵伟/article/detail/264701" target="_blank">Git工具的基本使用(一)_(use "git add
..." to update what will be co - 2C1任务-10:域名解析_现需要为域名解析添加一条a记录:*.csdn.net -> 39.106.2
- 3Mac Homebrew 安装与卸载_homebrew卸载
- 4第04章 IDEA的安装与使用_ieda使用
- 5Best-Flutter-UI-Templates Best-Flutter-UI-模板
- 69实现操作系统里面的链表结构
- 7(三十六) 从dumpsys package看Android权限
- 8学习笔记:利用usb_cam进行单目标定与畸变矫正(笔记本摄像头 or usb相机)
- 9基于Android的电子书阅读器(Android studio毕业设计,Android课程设计)_安卓开发电子书阅读库
- 10安全小白的pikachu靶场学习笔记(三)---sql注入(II)_pikachu head 注入讲解
LiveCharts.Wpf 的使用
赞
踩
本文主要介绍LiveChart.WPF 中的图表的使用方法 类: 数据绑定, 数据显示样式等。
导入LiveChart.Wpf#
NuGet搜索LiveChart包, 安装LiveChart.Wpf即可。

在 XAML 中导入命名空间
xmlns:lvc=“clr-namespace:LiveCharts.Wpf;assembly=LiveCharts.Wpf”
基本框架
lvc:CartesianChart
lvc:CartesianChart.AxisX
<lvc:Axis Title=“” ShowLabels=“” Labels=“” LabelsRotation=“”>
lvc:Axis.Separator
<lvc:Separator Step=“”/>
</lvc:Axis.Separator>
</lvc:Axis>
</lvc:CartesianChart.AxisX>
<!-- Y 轴 -->
<lvc:CartesianChart.AxisY>
    <lvc:Axis Title="" MinValue="" MaxValue="" ShowLabels="" Labels="" LabelsRotation="">
        <lvc:Axis.Separator>
            <lvc:Separator Step=""/>
        </lvc:Axis.Separator>
    </lvc:Axis>
</lvc:CartesianChart.AxisY>

<!-- 图表类型 -->
<lvc:CartesianChart.Series>
    <lvc:xxxSeries DataLabels="" Stroke="" Values="">
        <!-- 填充颜色,可以使用渐变色 -->
        <lvc:xxxSeries.Fill>
            <LinearGradientBrush StartPoint="0,0" EndPoint="0,1">
                <GradientStop Color="" Offset="0"/>
                <GradientStop Color="" Offset="1"/>
            </LinearGradientBrush>
        </lvc:xxxSeries.Fill>
    </lvc:xxxSeries>
</lvc:CartesianChart.Series>

<!-- 图例中的圆点尺寸,图例默认需要鼠标瞄到图标才显示,可以用 StackPanel 手动设置图例样式,这样就可以显示在图表旁边了-->
<lvc:CartesianChart.ChartLegend>
    <lvc:DefaultLegend BulletSize=""/>
</lvc:CartesianChart.ChartLegend>
- 1
- 2
- 3
- 4
- 5
- 6
- 7
- 8
- 9
- 10
- 11
- 12
- 13
- 14
- 15
- 16
- 17
- 18
- 19
- 20
- 21
- 22
- 23
- 24
- 25
- 26
</lvc:CartesianChart>
lvc:Axis:
MinValue和MaxValue:设置图表显示的数据范围,可以不设置,可以靠 Step 和坐标系数的个数决定
ShowLabels和Labels:是否显示 X 或 Y 轴的系数,Labels 就是坐标系数
LabelsRotation:是坐标轴上系数的旋转角度
Title:坐标轴的标题
lvc:Axis.Separator:
lvc:Separator Step=“”:这个就是设置设置两个坐标系数之间的数据差距
lvc:Separator StrokeDashArray=“”:分割线虚线间隔,一般不设置
lvc:CartesianChart.Series:
DataLabels:是否在坐标上显示具体数据
LabelsPosition:设置DataLabels显示的位置,一般不用写,也不一定有这个属性
Values:数据的集合
柱状图
柱状图的类型是 ColumnSeries
<lvc:CartesianChart Margin=“10” FontWeight=“Bold” FontSize=“16”>
lvc:CartesianChart.AxisX
<lvc:Axis Title=“X轴” ShowLabels=“True” Labels=“1,2,3,4,5” LabelsRotation=“0”>
lvc:Axis.Separator
<lvc:Separator Step=“1”/>
</lvc:Axis.Separator>
</lvc:Axis>
</lvc:CartesianChart.AxisX>
lvc:CartesianChart.AxisY
<lvc:Axis Title=“Y轴” MinValue=“0” MaxValue=“5” ShowLabels=“True” Labels=“0,1,2,3,4,5” LabelsRotation=“0”>
lvc:Axis.Separator
<lvc:Separator Step=“1”/>
</lvc:Axis.Separator>
</lvc:Axis>
</lvc:CartesianChart.AxisY>
lvc:CartesianChart.Series
<lvc:ColumnSeries DataLabels=“True” Stroke=“Red” Values=“2,3,1,5,4”>
lvc:ColumnSeries.Fill
</lvc:ColumnSeries.Fill>
</lvc:ColumnSeries>
</lvc:CartesianChart.Series>
</lvc:CartesianChart>
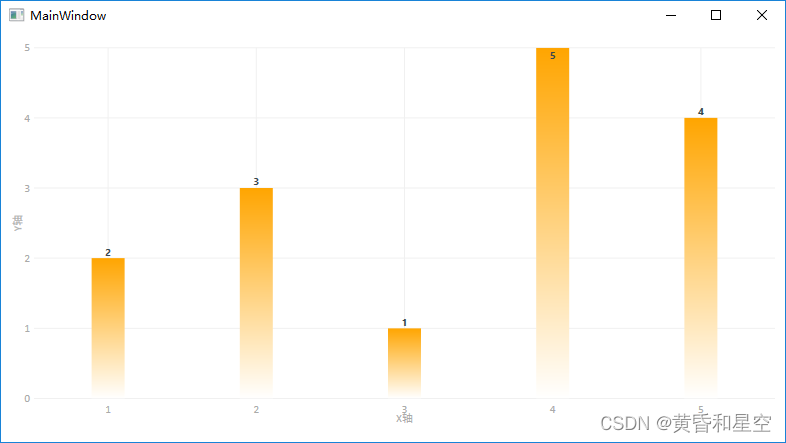
折线图
折线图的类型是LineSeries
<lvc:CartesianChart Margin=“10” FontWeight=“Bold” FontSize=“16”>
lvc:CartesianChart.AxisX
<lvc:Axis Title=“X轴” ShowLabels=“True” Labels=“1,2,3,4,5” LabelsRotation=“0”>
lvc:Axis.Separator
<lvc:Separator Step=“1”/>
</lvc:Axis.Separator>
</lvc:Axis>
</lvc:CartesianChart.AxisX>
lvc:CartesianChart.AxisY
<lvc:Axis Title=“Y轴” MinValue=“0” MaxValue=“5” ShowLabels=“True” Labels=“0,1,2,3,4,5” LabelsRotation=“0”>
lvc:Axis.Separator
<lvc:Separator Step=“1”/>
</lvc:Axis.Separator>
</lvc:Axis>
</lvc:CartesianChart.AxisY>
lvc:CartesianChart.Series
<lvc:LineSeries DataLabels=“True” Stroke=“Red” Values=“2,3,1,5,4”>
lvc:LineSeries.Fill
</lvc:LineSeries.Fill>
</lvc:LineSeries>
</lvc:CartesianChart.Series>
</lvc:CartesianChart>
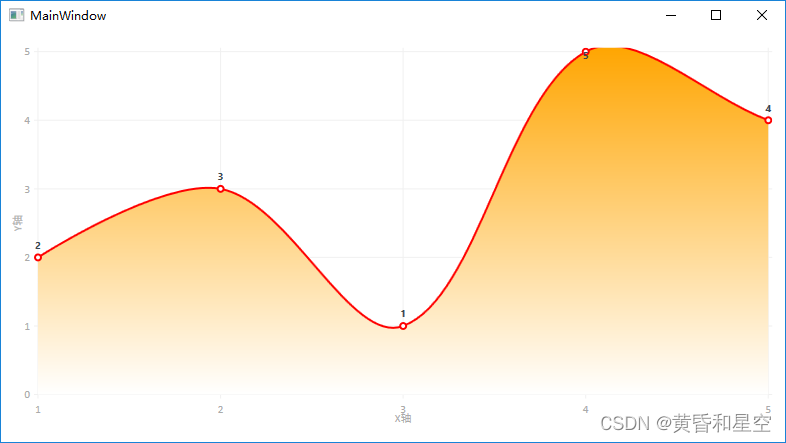
进度环
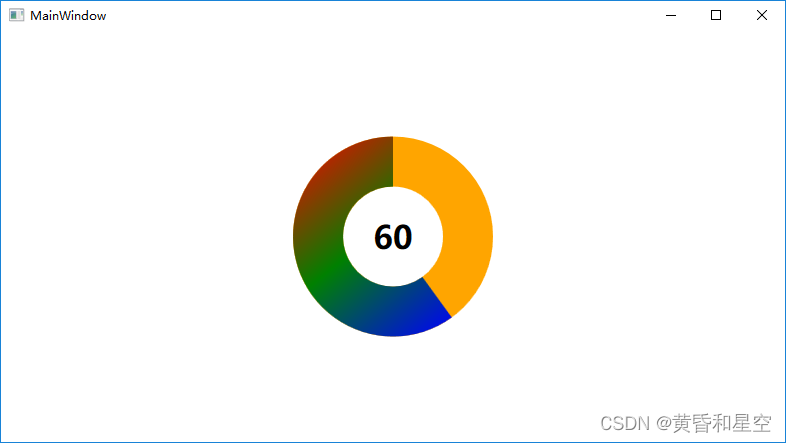
进度环的类型是Gauge
<lvc:Gauge Width=“200” Height=“200” From=“0” To=“100” InnerRadius=“50” Value=“60” Uses360Mode=“True” GaugeBackground=“Orange” HighFontSize=“32”>
lvc:Gauge.GaugeRenderTransform
</lvc:Gauge.GaugeRenderTransform>
lvc:Gauge.GaugeActiveFill
</lvc:Gauge.GaugeActiveFill>
</lvc:Gauge>
InnerRadius:这个是指饼状图中间的圆的半径,0 就是没有
Uses360Mode:是否使用完整的圆,默认是 false ,表示半圆
GaugeBackground:圆环背景颜色
HighFontSize:中间数字大小
From和To:最小值和最大值
RotateTransform:相对于默认情况下的旋转角度
ScaleTransform:大小变换,ScaleX可以为负数,这样旋转方向就会改变,默认顺时针
GaugeActiveFill:填充颜色,可以用渐变色
效果图
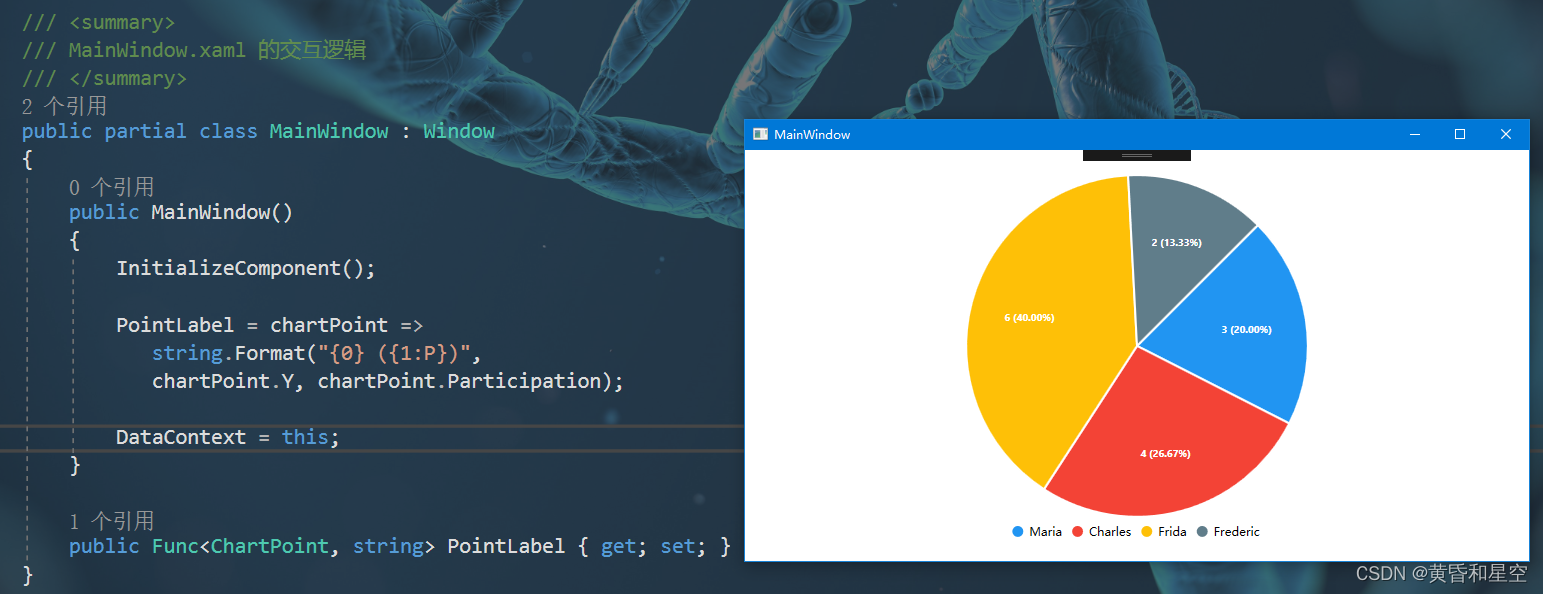
饼状图
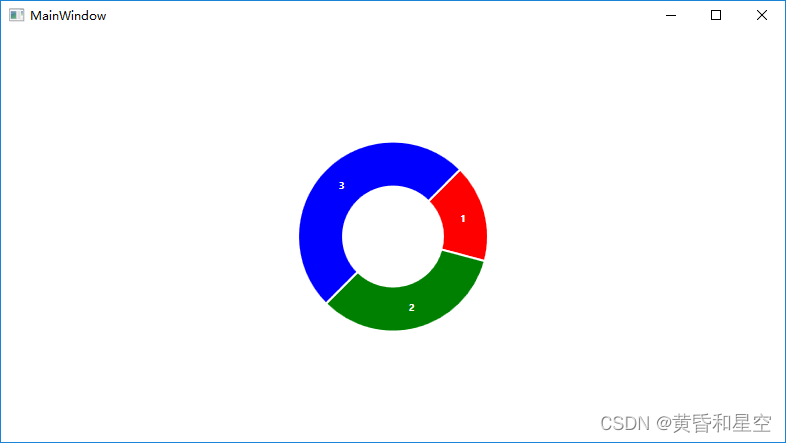
饼状图的类型是PieChart
<lvc:PieChart InnerRadius=“50” Width=“200” Height=“200”>
lvc:PieChart.Series
<lvc:PieSeries Values=“1” Fill=“Red” DataLabels=“True” Title=“红色”/>
<lvc:PieSeries Values=“2” Fill=“Green” DataLabels=“True” Title=“绿色”/>
<lvc:PieSeries Values=“3” Fill=“Blue” DataLabels=“True” Title=“蓝色”/>
</lvc:PieChart.Series>
</lvc:PieChart>
效果图
行图的类型是RowSeries,X轴和Y轴的处理方式与柱状图相反
lvc:CartesianChart
lvc:CartesianChart.AxisX
<lvc:Axis MinValue=“0” MaxValue=“5” ShowLabels=“True” Labels=“0,1,2,3,4,5”>
lvc:Axis.Separator
<lvc:Separator Stroke=“Red” StrokeDashArray=“10”/>
</lvc:Axis.Separator>
</lvc:Axis>
</lvc:CartesianChart.AxisX>
lvc:CartesianChart.AxisY
<lvc:Axis MinValue=“0” MaxValue=“5” ShowLabels=“True” Labels=“01,2,3,4,5”>
lvc:Axis.Separator
<lvc:Separator Stroke=“Green” StrokeDashArray=“10”/>
</lvc:Axis.Separator>
</lvc:Axis>
</lvc:CartesianChart.AxisY>
lvc:CartesianChart.Series
<lvc:RowSeries DataLabels=“True” LabelsPosition=“Parallel” Values=“2,3,1,5,4” Fill=“Orange”/>
</lvc:CartesianChart.Series>
</lvc:CartesianChart>
效果图
注意:行图可以生成甘特图,只需要将Values的类型要改成ChartValues,我就懒得写了
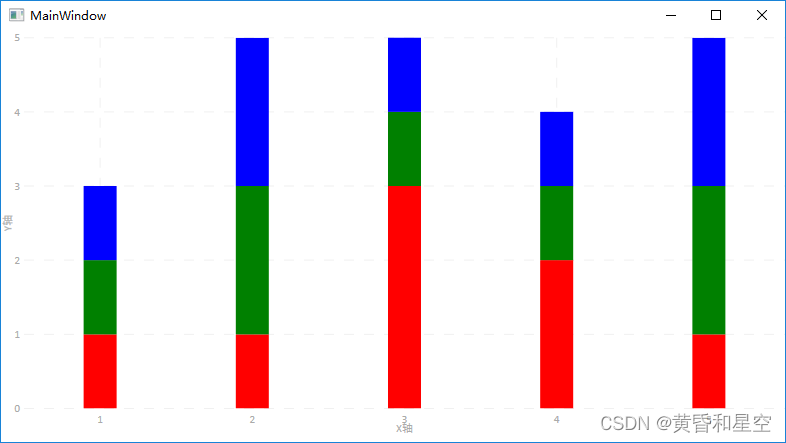
柱状堆积图
柱状堆积图的类型是StackedColumnSeries
lvc:CartesianChart
lvc:CartesianChart.AxisX
<lvc:Axis Title=“X轴” ShowLabels=“True” Labels=“1,2,3,4,5”>
lvc:Axis.Separator
<lvc:Separator Step=“1” StrokeDashArray=“10”/>
</lvc:Axis.Separator>
</lvc:Axis>
</lvc:CartesianChart.AxisX>
lvc:CartesianChart.AxisY
<lvc:Axis Title=“Y轴” MinValue=“0” MaxValue=“5” ShowLabels=“True” Labels=“0,1,2,3,4,5”>
lvc:Axis.Separator
<lvc:Separator Step=“1” StrokeDashArray=“10”/>
</lvc:Axis.Separator>
</lvc:Axis>
</lvc:CartesianChart.AxisY>
lvc:CartesianChart.Series
<lvc:StackedColumnSeries Fill=“Red” Title=“红色” Values=“1,1,3,2,1”>
    </lvc:StackedColumnSeries>
    <lvc:StackedColumnSeries Fill="Green" Title="绿色" Values="1,2,1,1,2">

    </lvc:StackedColumnSeries>
    <lvc:StackedColumnSeries Fill="Blue" Title="蓝色" Values="1,2,3,1,2">

    </lvc:StackedColumnSeries>
</lvc:CartesianChart.Series>
- 1
- 2
- 3
- 4
- 5
- 6
- 7
- 8
</lvc:CartesianChart>
效果图
