
热门标签
热门文章
- 1基于MATLAB的频谱、能量谱、三分之一倍频程分析_matlab倍频程
- 2Flink学习——Flink中的时间语义和窗口_formonotonoustimestamps
- 3oceanbase安装_linux 单机安装oceanbase
- 4网络编程套接字(三)之TCP服务器简单实现_tcp 服务器 简单
- 5Adobe Photoshop 操作_使用adobe photoshop csdn
- 6【16-Ⅰ】Head First Java 学习笔记
- 7点云配准SIFT+SI+RANSAC+ICP
- 8在vivado中如何写仿真文件(testbench)?_vivado仿真文件怎么写
- 9自动驾驶控制算法——纯跟踪算法(Pure Pursuit)_变预瞄距离纯跟踪算法
- 10FPGA高端项目:Xilinx Kintex7系列FPGA多路视频拼接 工程解决方案 提供6套工程源码和技术支持_fdma-buf
当前位置: article > 正文
plt.imshow()参数_plt.imshow参数
作者:Monodyee | 2024-05-07 03:34:13
赞
踩
plt.imshow参数
matplotlib.pyplot.imshow(X, cmap=None, norm=None, aspect=None, interpolation=None, alpha=None, vmin=None, vmax=None, origin=None, extent=None, shape=, filternorm=1, filterrad=4.0, imlim=, resample=None, url=None, \*, data=None, \*\*kwargs)
参数:此方法接受以下描述的参数:
- X:此参数是图像的数据。
- cmap:此参数是颜色图实例或注册的颜色图名称。
- norm:此参数是Normalize实例,将数据值缩放到规范的颜色图范围[0,1]以映射到颜色
- vmin, vmax:这些参数本质上是可选的,它们是颜色栏范围。
- alpha:此参数是颜色的强度。
- aspect:此参数用于控制轴的纵横比。
- interpolation:此参数是用于显示图像的插值方法。
- origin:此参数用于将数组的[0,0]索引放置在轴的左上角或左下角。
- resample:此参数是用于类似的方法。
- extent:此参数是数据坐标中的边界框。
- filternorm:此参数用于防颗粒图像调整大小过滤器。
- filterrad:此参数是具有半径参数的滤镜的滤镜半径。
- url:此参数设置创建的AxesImage的url。
返回值:这将返回以下内容:
- image:这将返回AxesImage
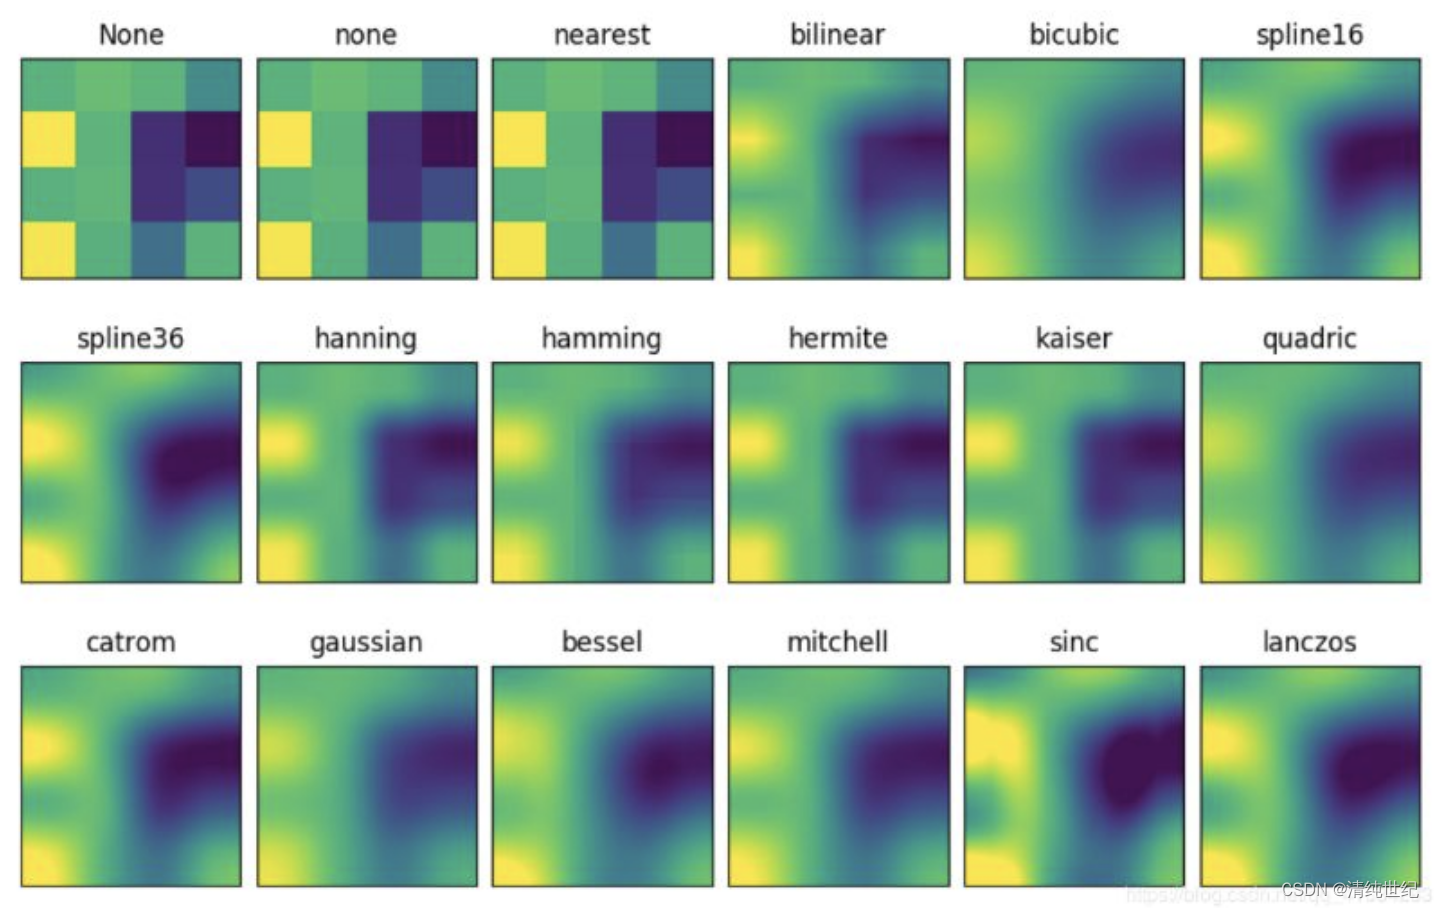
interplotation解释:
可为:‘none’,‘nearest’,‘bilinear’,‘bicubic’,‘spline16’, ‘spline36’, ‘hanning’, ‘hamming’,‘hermite’,‘kaiser’,‘quadric’,‘catrom’,‘gaussian’,‘bessel’,‘mitchell’, ‘sinc’,‘lanczos’
声明:本文内容由网友自发贡献,不代表【wpsshop博客】立场,版权归原作者所有,本站不承担相应法律责任。如您发现有侵权的内容,请联系我们。转载请注明出处:https://www.wpsshop.cn/w/Monodyee/article/detail/547252
推荐阅读
相关标签

