
热门标签
当前位置: article > 正文
导入seaborn的数据集方法load_datasets的问题_导入数据集seaborn
作者:不正经 | 2024-04-12 19:20:57
赞
踩
导入数据集seaborn
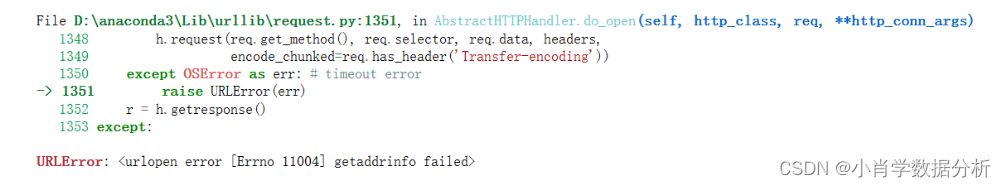
sns.load_dataset使用报错解决URLError: <urlopen error [Errno 11004] getaddrinfo failed>(windows))
- import seaborn as sns
- import matplotlib.pyplot as plt
-
- # 使用Seaborn自带的数据集
- tips = sns.load_dataset('tips')
-
- # 绘制柱状图
- sns.barplot(x='day', y='total_bill', data=tips)
-
- # 添加标题和标签
- plt.title('Bar Plot')
- plt.xlabel('Day')
- plt.ylabel('Total Bill')
-
- # 展示图表
- plt.show()

报错了。。。
这个原因是load_dataset()会先从本地的seaborn_data去监测,
我们通过这行代码看看seaborn_data的路径
sns.utils.get_data_home()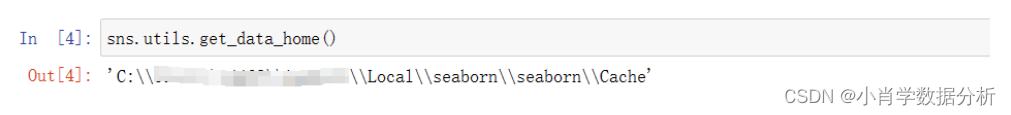
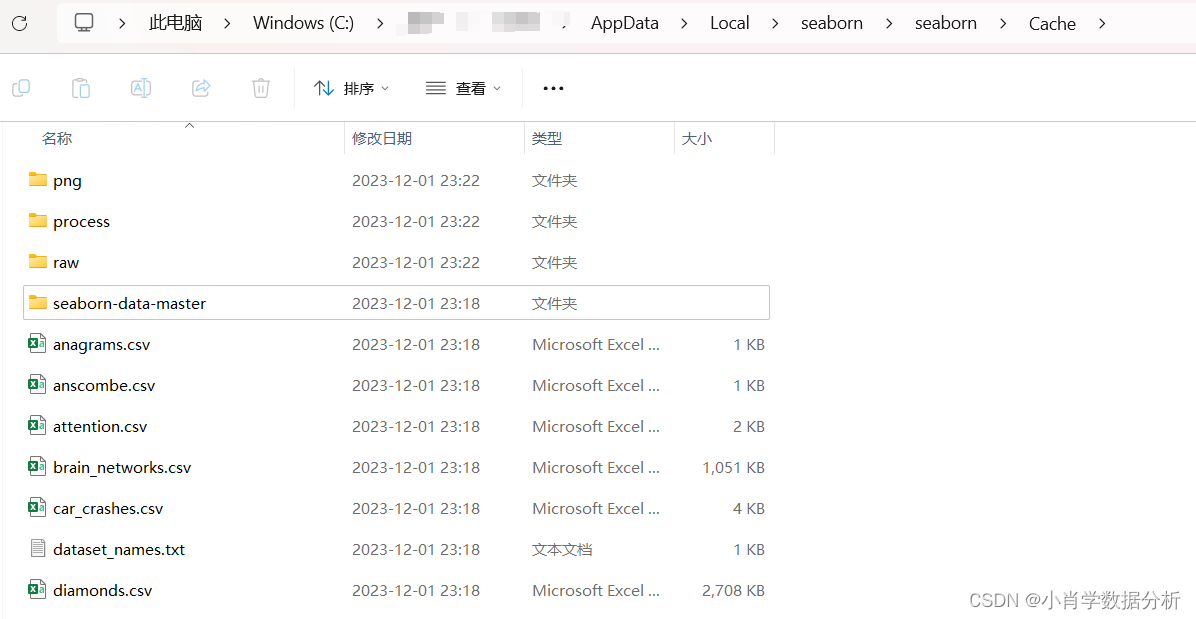
然后进入这个文件夹,发现什么数据都没有,如下图:

在源码里面。官方提供了github数据集https://github.com/mwaskom/seaborn-data如下图:

把数据部分下载下来,解压

解压后粘贴到seaborn_data的路径下
再次执行刚才的代码
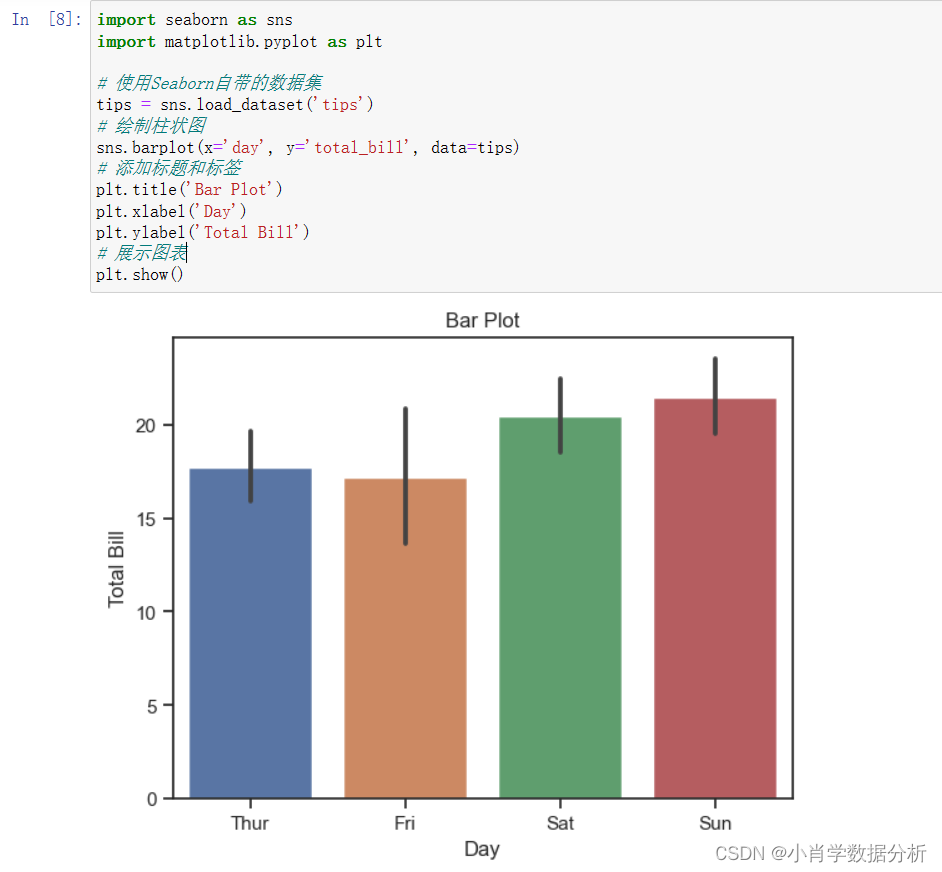
可以加载到数据了
声明:本文内容由网友自发贡献,不代表【wpsshop博客】立场,版权归原作者所有,本站不承担相应法律责任。如您发现有侵权的内容,请联系我们。转载请注明出处:https://www.wpsshop.cn/w/不正经/article/detail/412270
推荐阅读

相关标签

