
- 1MySQL多条语句同时执行_mysql支持多语句同时执行吗
- 2百度开源进行时
- 3com.mysql.jdbc.Driver 和 com.mysql.cj.jdbc.Driver的区别以及设定serverTimezone
- 4孙宇晨大举进驻NFT艺术的背后:区块链+艺术还能有怎样的玩法?_nft与实体
- 5微信自定义菜单的创建(微信账号绑定功能的实现 Java)_java 账号绑定微信
- 6解决recaptcha、cloudflare、incapsula验证问题_突然有了cloudflare验证
- 7二本4年测龄年仅25岁,五面阿里(定薪25K)....._阿里巴巴测试开发工程师工资
- 8微信小程序抢票脚本
- 9在mybatis中处理集合、循环、数组和in查询等语句的使用_mybatis 循环数组
- 10mysql同一机器安装8.3和5.73版本步骤_mysql安装5.7和8.3
Filebeat详细介绍,下载和启动,日志读取和模块设置等
赞
踩
Filebeat
介绍
Filebeat是一个轻量级的日志采集器
为什么要用Filebeat?
当面对成百上千、甚至成千上万的服务器、虚拟机和容器生成的日志时,Filebeat可以提供一种轻量型方法,用于转发和汇总日志与文件,关于Filebeat的记住以下两点:
- 轻量级日志采集器
- 输送至ElasticSearch或者Logstash,在Kibana中实现可视化
架构
用于监控、收集服务器日志文件.
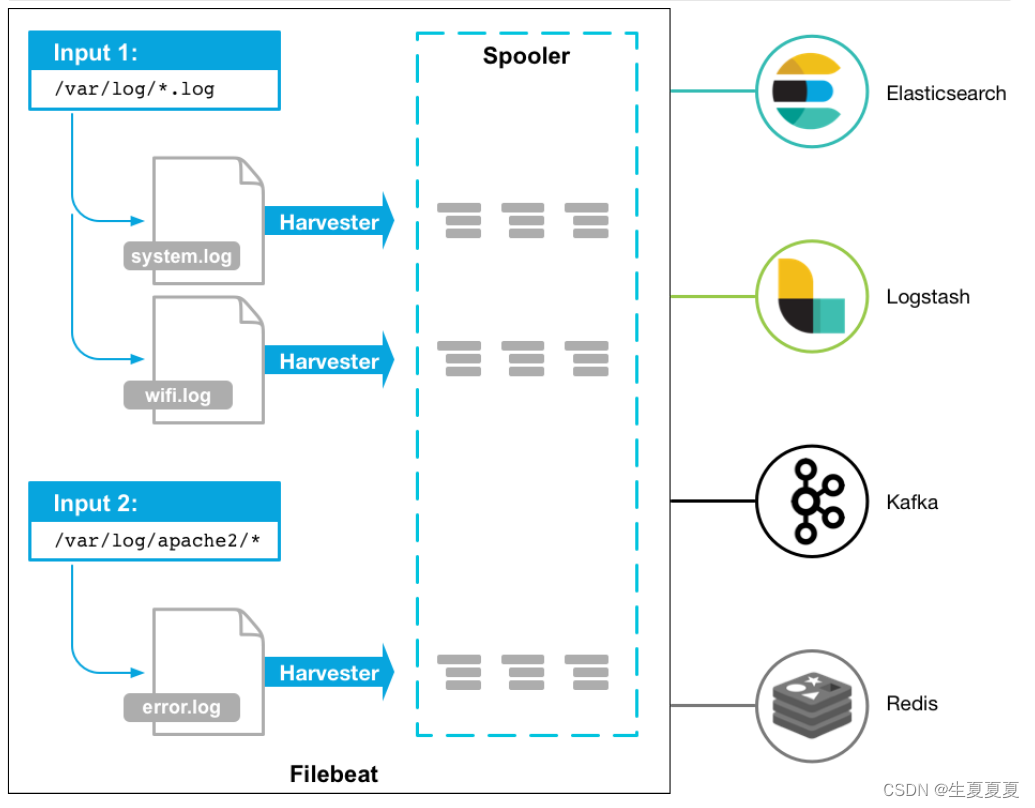
流程如下:
- 首先是input输入,可以指定多个数据输入源,然后通过通配符进行日志文件的匹配
- 匹配到日志后,就会使用Harvester(收割机),将日志源源不断的读取到来
- 然后收割机收割到的日志,就传递到Spooler(卷轴),然后卷轴就在将他们传到对应的地方
下载
可以直接wget下载
# 进入文件夹
cd /opt/elk/
# 下载
wget https://artifacts.elastic.co/downloads/beats/filebeat/filebeat-8.8.1-linux-x86_64.tar.gz
# 解压文件
tar -zxvf filebeat-8.8.1-linux-x86_64.tar.gz
# 重命名
mv filebeat-8.8.1-linux-x86_64  filebeat
- 1
- 2
- 3
- 4
- 5
- 6
- 7
- 8
然后进入到filebeat目录下,创建对应的配置文件
# 进入文件夹
cd filebeats
# 创建配置文件
vim shengxia.yml
- 1
- 2
- 3
- 4
添加如下内容
filebeat.inputs: # filebeat input输入
- type: stdin    # 标准输入
  enabled: true  # 启用标准输入
setup.template.settings:
  index.number_of_shards: 3 # 指定下载数
output.console:  # 控制台输出
  pretty: true   # 启用美化功能
  enable: true
- 1
- 2
- 3
- 4
- 5
- 6
- 7
- 8
启动
在我们添加完配置文件后,我们就可以对filebeat进行启动了
./filebeat -e -c shengxia.yml
- 1
然后我们在控制台输入hello,就能看到我们会有一个json的输出,是通过读取到我们控制台的内容后输出的,内容如下
{
  "@timestamp": "2023-05-31T22:57:58.700Z",
  "@metadata": {#元数据信息
    "beat": "filebeat",
    "type": "_doc",
    "version": "8.8.1"
  },
  "log": {
    "offset": 0,
    "file": {
      "path": ""
    }
  },
  "message": "hello",#元数据信息
  "input": {#控制台标准输入
    "type": "stdin"#元数据信息
  },
  "ecs": {
    "version": "8.0.0"
  },
  "host": {
    "name": "elk-node1"
  },
  "agent": {#版本以及主机信息
    "id": "5d5e4b99-8ee3-42f5-aae3-b0492d723730",
    "name": "elk-node1",
    "type": "filebeat",
    "version": "8.8.1",
    "ephemeral_id": "24b4fd16-5466-4d7e-b4b8-b73d41f77de0"
  }
}

- 1
- 2
- 3
- 4
- 5
- 6
- 7
- 8
- 9
- 10
- 11
- 12
- 13
- 14
- 15
- 16
- 17
- 18
- 19
- 20
- 21
- 22
- 23
- 24
- 25
- 26
- 27
- 28
- 29
- 30
- 31
读取文件
再次创建一个文件,叫 shengxia-log.yml,然后在文件里添加如下内容
filebeat.inputs:
- type: log
  enabled: true
  paths:
    - /opt/elk/logs/*.log
setup.template.settings:
  index.number_of_shards: 3
output.console:
  pretty: true
  enable: true
- 1
- 2
- 3
- 4
- 5
- 6
- 7
- 8
- 9
- 10
添加完成后,我们在到下面目录创建一个日志文件
# 创建文件夹
mkdir -p /opt/elk/logs

# 进入文件夹
cd /opt/elk/logs

# 追加内容
echo "hello world" >> test.log
- 1
- 2
- 3
- 4
- 5
- 6
- 7
- 8
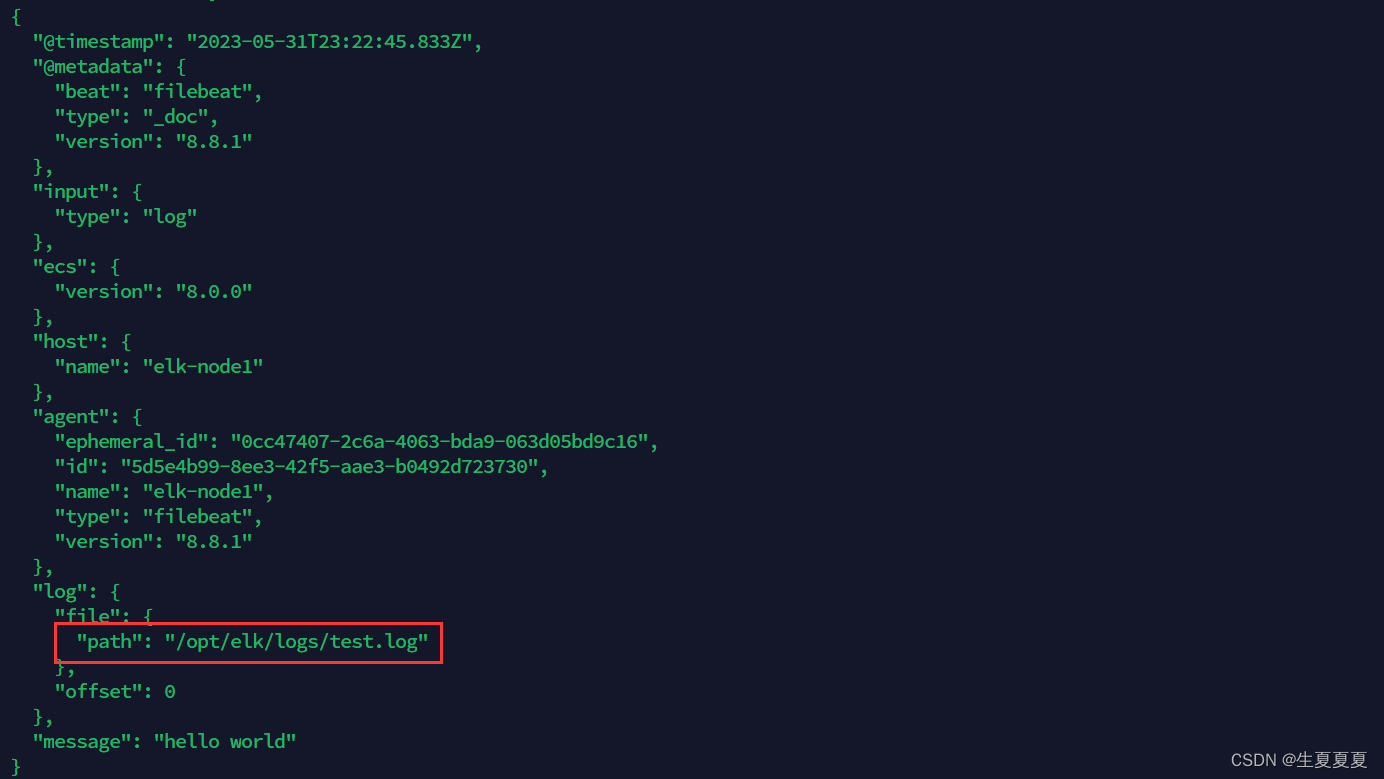
然后再次启动filebeat
./filebeat -e -c shengxia-log.yml
- 1
能够发现,它已经成功加载到了我们的日志文件 test.log
同时我们还可以继续往文件中追加内容
echo "are you ok ?" >> a.log
- 1
追加后,我们再次查看filebeat,也能看到刚刚我们追加的内容
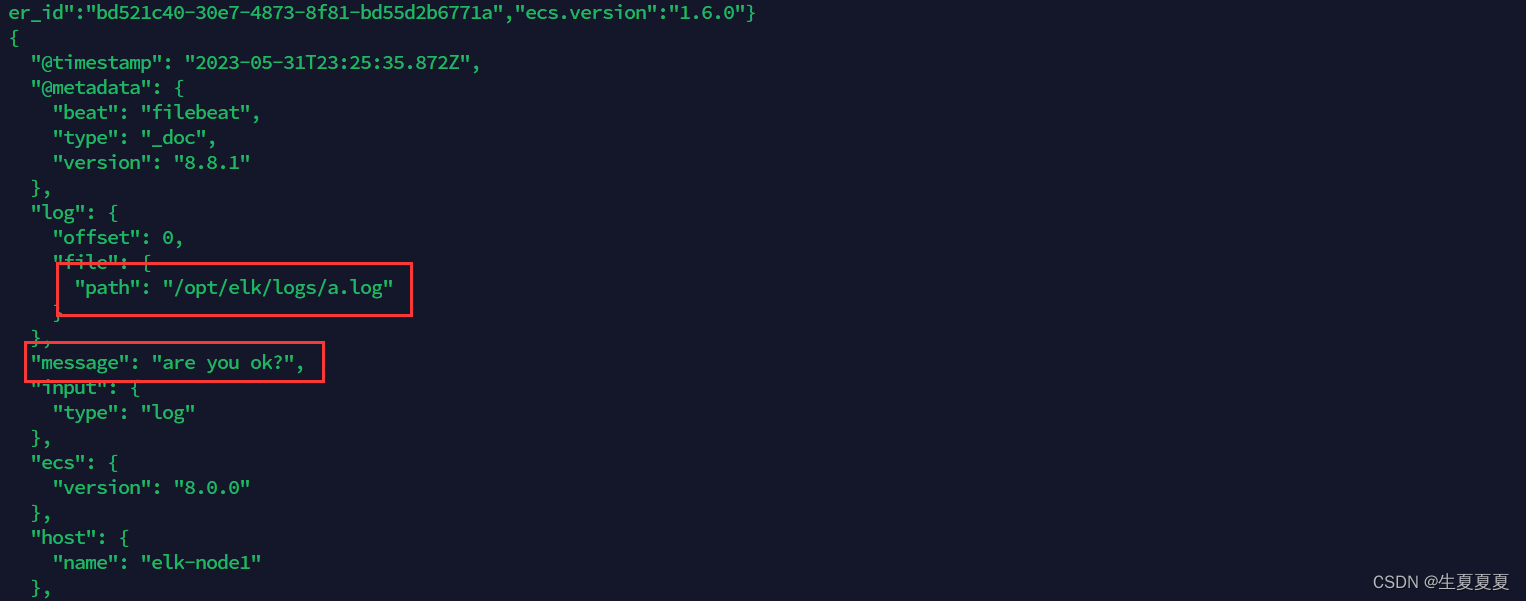
可以看出,已经检测到日志文件有更新,立刻就会读取到更新的内容,并且输出到控制台。
自定义字段
当我们的元数据没办法支撑我们的业务时,我们还可以自定义添加一些字段
filebeat.inputs:
- type: log
  enabled: true
  paths:
    - /opt/elk/logs/*.log
  tags: ["web", "test"]  #添加自定义tag,便于后续的处理
  fields:  #添加自定义字段
    from: web-test
  fields_under_root: true #true为添加到根节点,false为添加到子节点中
setup.template.settings:
  index.number_of_shards: 3
output.console:
  pretty: true
  enable: true
- 1
- 2
- 3
- 4
- 5
- 6
- 7
- 8
- 9
- 10
- 11
- 12
- 13
- 14
添加完成后,重启 filebeat
./filebeat -e -c shengxia-log.yml
- 1
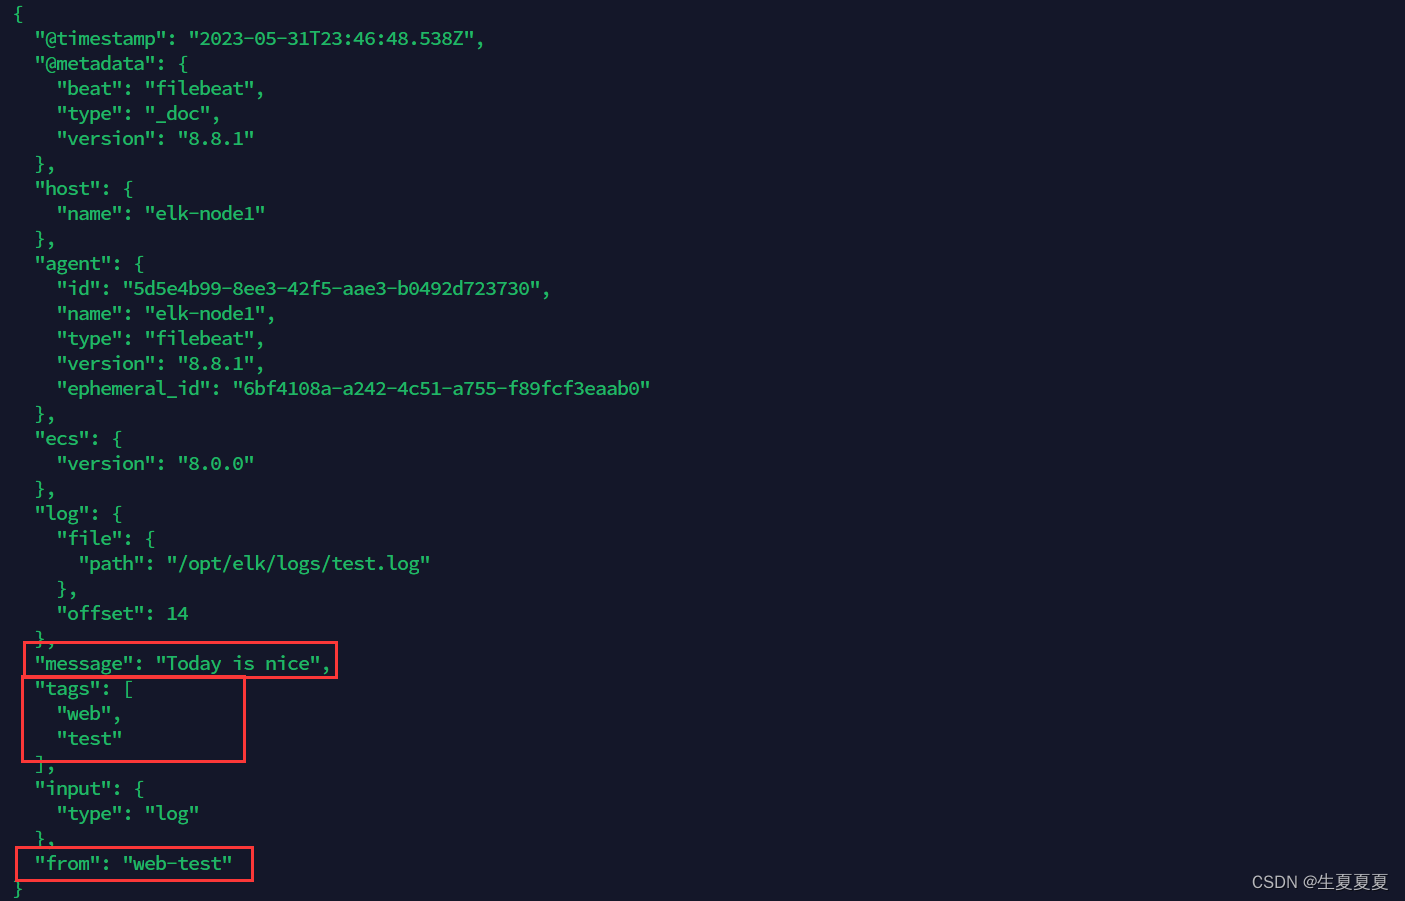
然后添加新的数据到 test.log中
echo "Today is nice" >> test.log
- 1
我们就可以看到字段在原来的基础上,增加了两个
输出到ElasticSearch
我们可以通过配置,将修改成如下所示
filebeat.inputs:
- type: log
  enabled: true
  paths:
    - /opt/elk/logs/*.log
  tags: ["web", "test"]
  fields:
    from: web-test
  fields_under_root: false
setup.template.settings:
  index.number_of_shards: 1
output.elasticsearch:
  hosts: ["192.168.40.150:9200","192.168.40.137:9200","192.168.40.138:9200"]
- 1
- 2
- 3
- 4
- 5
- 6
- 7
- 8
- 9
- 10
- 11
- 12
- 13
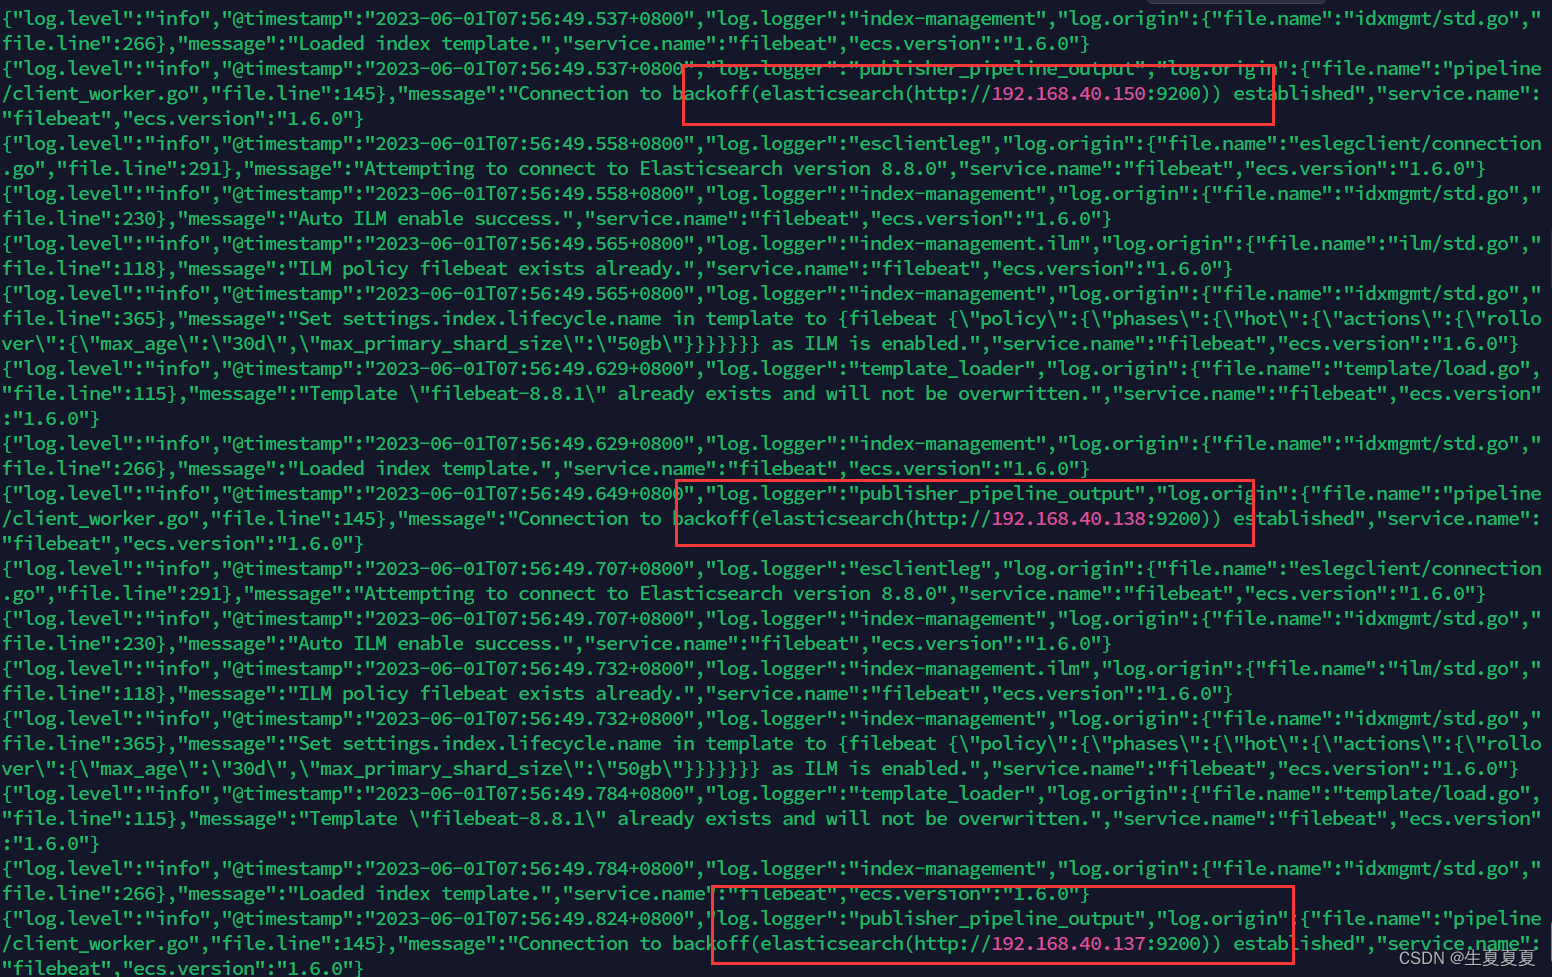
启动成功后,我们就能看到它已经成功连接到了es了
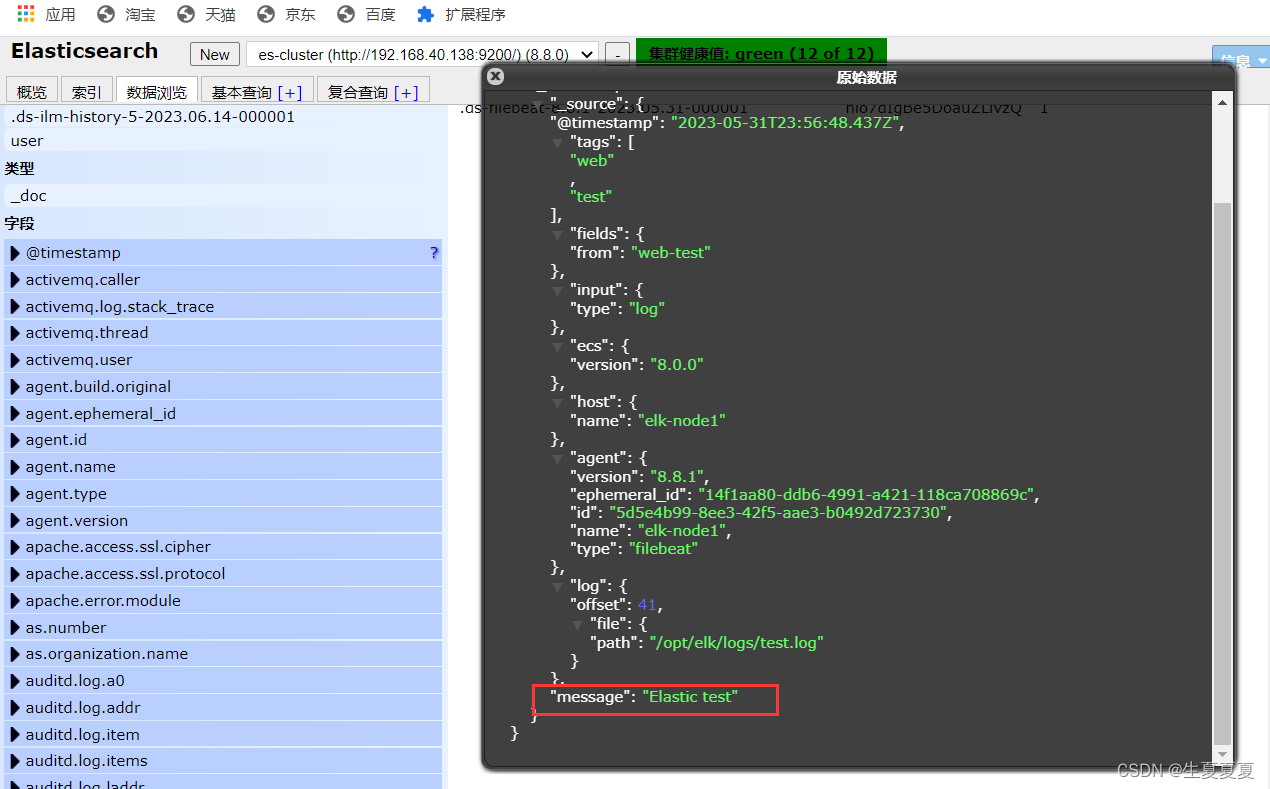
然后我们到刚刚的 logs文件夹向 a.log文件中添加内容
echo "Elastic test" >> test.log
- 1
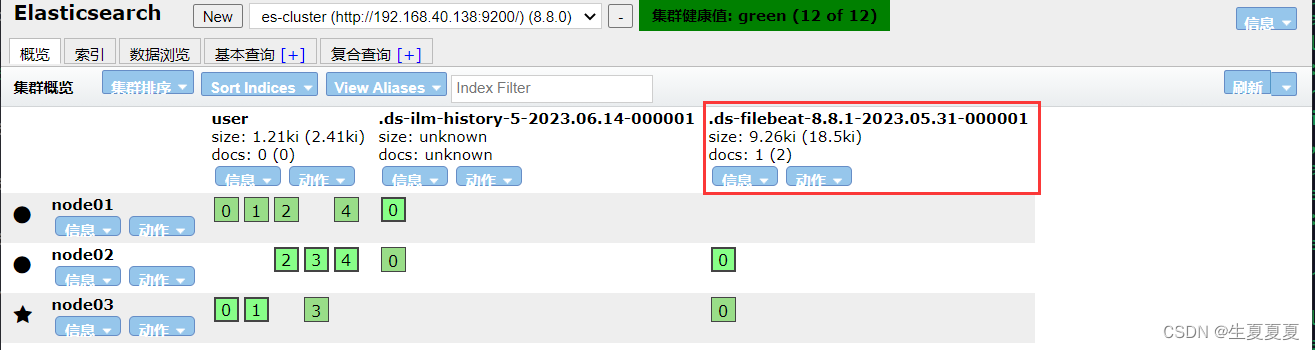
在ES中,我们可以看到,多出了一个 filebeat的索引库
然后我们浏览对应的数据,看看是否有插入的数据内容
Filebeat工作原理
Filebeat主要由下面几个组件组成: harvester、prospector 、input
harvester
- 负责读取单个文件的内容
- harvester逐行读取每个文件(一行一行读取),并把这些内容发送到输出
- 每个文件启动一个harvester,并且harvester负责打开和关闭这些文件,这就意味着harvester运行时文件描述符保持着打开的状态。
- 在harvester正在读取文件内容的时候,文件被删除或者重命名了,那么Filebeat就会续读这个文件,这就会造成一个问题,就是只要负责这个文件的harvester没有关闭,那么磁盘空间就不会被释放,默认情况下,Filebeat保存文件打开直到close_inactive到达
prospector
-
prospector负责管理harvester并找到所有要读取的文件来源
-
如果输入类型为日志,则查找器将查找路径匹配的所有文件,并为每个文件启动一个harvester
-
Filebeat目前支持两种prospector类型:log和stdin
-
Filebeat如何保持文件的状态
- Filebeat保存每个文件的状态并经常将状态刷新到磁盘上的注册文件中
- 该状态用于记住harvester正在读取的最后偏移量,并确保发送所有日志行。
- 如果输出(例如ElasticSearch或Logstash)无法访问,Filebeat会跟踪最后发送的行,并在输出再次可以用时继续读取文件。
- 在Filebeat运行时,每个prospector内存中也会保存的文件状态信息,当重新启动Filebat时,将使用注册文件的数量来重建文件状态,Filebeat将每个harvester在从保存的最后偏移量继续读取
- 文件状态记录在data/registry文件中
input
-
一个input负责管理harvester,并找到所有要读取的源
-
如果input类型是log,则input查找驱动器上与已定义的log路径匹配的所有文件,并为每个文件启动一个harvester
-
每个input都在自己的Go例程中运行
-
下面的例子配置Filebeat从所有匹配指定的log模式的文件中读取行
filebeat.inputs:
- type: log
  paths:
    - /var/log/*.log
    - /var/path2/*.log
- 1
- 2
- 3
- 4
- 5
启动命令
./filebeat -e -c shengxia-es.yml
./filebeat -e -c shengxia-es.yml -d "publish"
- 1
- 2
参数说明
- -e:输出到标准输出,默认输出到syslog和logs下
- -c:指定配置文件
- -d:输出debug信息
部署Nginx
部署教程可以参考这篇博客:Nginx的安装启动和停止_
启动完成后,我们通过下面命令,就可以获取到nginx中的内容了
[root@elk-node1 sbin]# tail -f /usr/local/nginx1/logs/access.log
192.168.40.1 - - [01/Jun/2023:05:13:23 +0800] "GET / HTTP/1.1" 200 615 "-" "Mozilla/5.0 (Windows NT 10.0; Win64; x64) AppleWebKit/537.36 (KHTML, like Gecko) Chrome/114.0.0.0 Safari/537.36 Edg/114.0.1823.43"
192.168.40.1 - - [01/Jun/2023:05:13:23 +0800] "GET /favicon.ico HTTP/1.1" 404 555 "http://192.168.40.150:8080/" "Mozilla/5.0 (Windows NT 10.0; Win64; x64) AppleWebKit/537.36 (KHTML, like Gecko) Chrome/114.0.0.0 Safari/537.36 Edg/114.0.1823.43"
- 1
- 2
- 3
读取Nginx中的配置文件
创建一个 nginx-log.yml配置文件,启动nginx的模块功能
./filebeat modules enable nginx
- 1
nginx-log.yml配置文件内容
filebeat.inputs:
- type: log
  enabled: true
  paths:
    - /usr/local/nginx1/logs/*.log #nginx日志存放路径
  tags: ["nginx"]
  fields_under_root: false
setup.template.settings:
  index.number_of_shards: 1
output.elasticsearch:
  hosts: ["192.168.40.150:9200","192.168.40.137:9200","192.168.40.138:9200"]
- 1
- 2
- 3
- 4
- 5
- 6
- 7
- 8
- 9
- 10
- 11
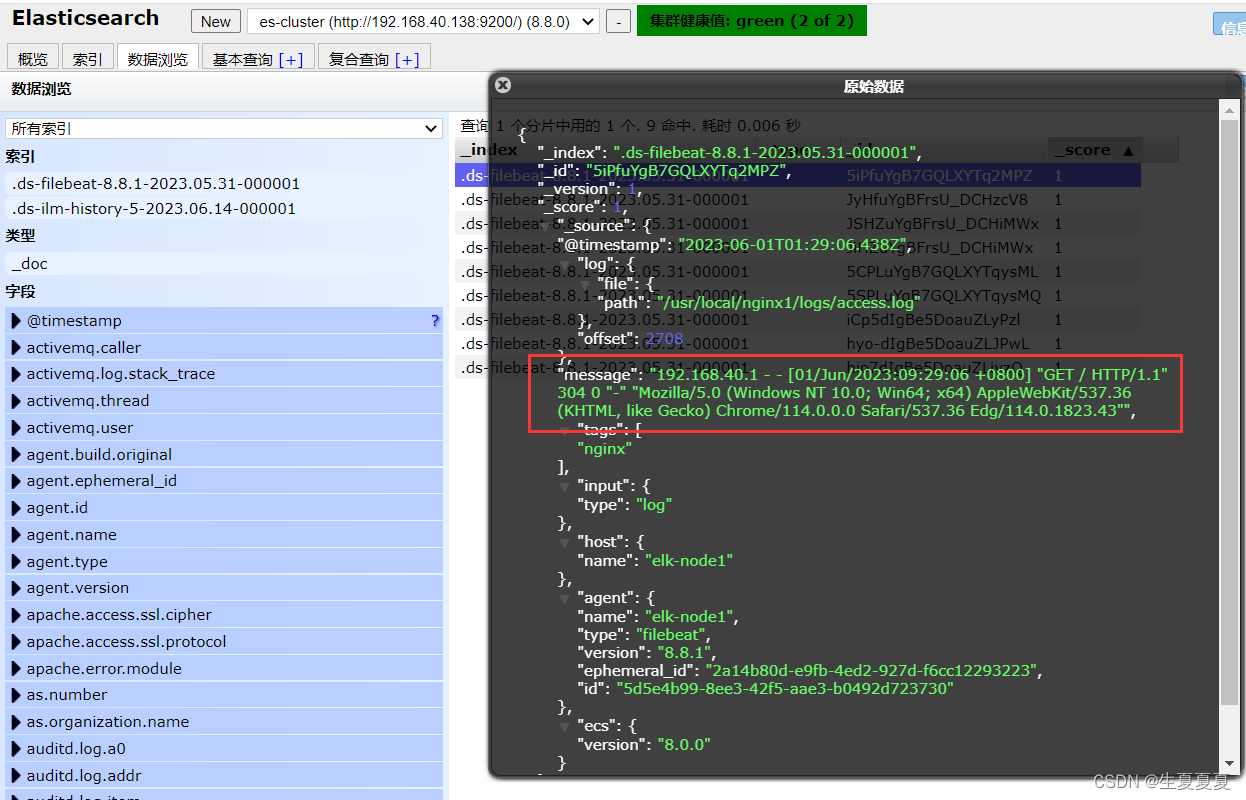
可以看到,在message中已经获取到了nginx的日志,但是,内容并没有经过处理,只是读取到原数据。
Module
要想实现日志数据的读取以及处理都是自己手动配置的,其实,在Filebeat中,有大量的Module,可以简化我们的配置,直接就可以使用,如下:
查看模块列表
./filebeat modules list
- 1
你可以看到,内置了很多的module,但是都没有启用,如果需要启用需要进行enable操作:
#启动
./filebeat modules enable nginx
#禁用
./filebeat modules disable nginx
- 1
- 2
- 3
- 4
nginx module 配置
我们到下面的目录,就能看到module的配置了
# 进入到module目录
cd modules.d/
#查看文件
vim nginx.yml
- 1
- 2
- 3
- 4
得到的文件内容如下所示
# Module: nginx
# Docs: https://www.elastic.co/guide/en/beats/filebeat/7.9/filebeat-module-nginx.html

- module: nginx
  # Access logs
  access:
    enabled: true
    # 添加日志文件
    var.paths: ["/usr/local/nginx1/logs/access.log*"]

    # Set custom paths for the log files. If left empty,
    # Filebeat will choose the paths depending on your OS.
    #var.paths:

  # Error logs
  error:
    enabled: true
    var.paths: ["/usr/local/nginx1/logs/error.log*"]
- 1
- 2
- 3
- 4
- 5
- 6
- 7
- 8
- 9
- 10
- 11
- 12
- 13
- 14
- 15
- 16
- 17
- 18
配置filebeat
我们需要修改刚刚的nginx-log.yml文件,然后添加到我们的module
filebeat.inputs:
setup.template.settings:
  index.number_of_shards: 1
output.elasticsearch:
  hosts: ["192.168.40.150:9200","192.168.40.137:9200","192.168.40.138:9200"]
filebeat.config.modules:
  path: ${path.config}/modules.d/*.yml
  reload.enabled: false
- 1
- 2
- 3
- 4
- 5
- 6
- 7
- 8
测试
我们启动我们的filebeat
./filebeat -e -c nginx-log.yml
- 1
如果启动的时候发现出错
错误1
#只要执行下面两条命令就可以,新版本的ES不会报错
ERROR fileset/factory.go:142 Error loading pipeline: Error loading pipeline for
fileset nginx/access: This module requires the following Elasticsearch plugins:
ingest-user-agent, ingest-geoip. You can install them by running the following
commands on all the Elasticsearch nodes:
  sudo bin/elasticsearch-plugin install ingest-user-agent
  sudo bin/elasticsearch-plugin install ingest-geoip
- 1
- 2
- 3
- 4
- 5
- 6
- 7
- 8
错误2
#将elasticsearch.yaml文件进行修改成以下内容
#node.roles: [master,data,ingest]
500 Internal Server Error: {\"error\":{\"root_cause\":[{\"type\":\"illegal_state_exception\",\"reason\":\"There are no ingest nodes in this cluster, unable to forward request to an ingest node.\"}],\"type\":\"illegal_state_exception\",\"reason\":\"There are no ingest nodes in this cluster, unable to forward request to an ingest node.\"},\"status\":500}","service.name":"filebeat","ecs.version":"1.6.0"}
- 1
- 2
- 3
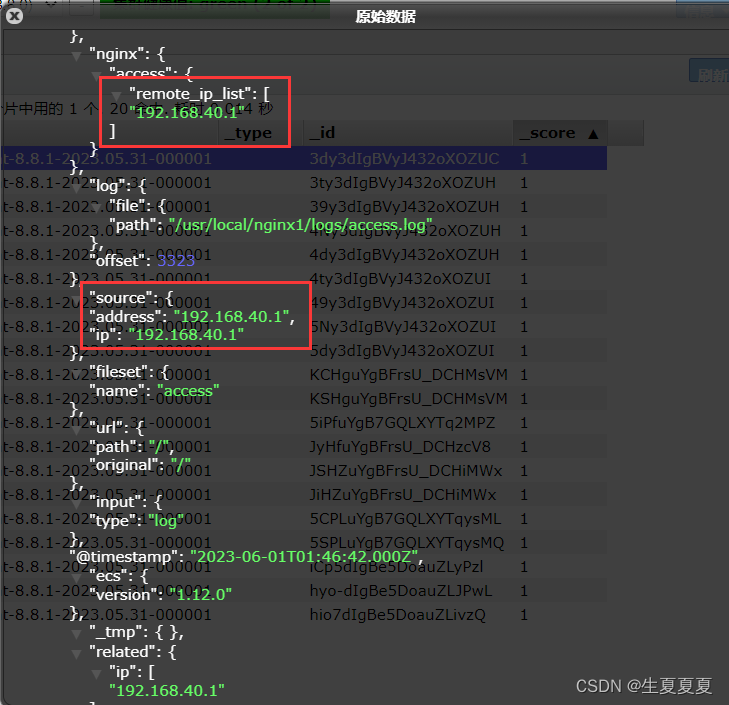
启动成功后,能看到日志记录已经成功刷新进去了
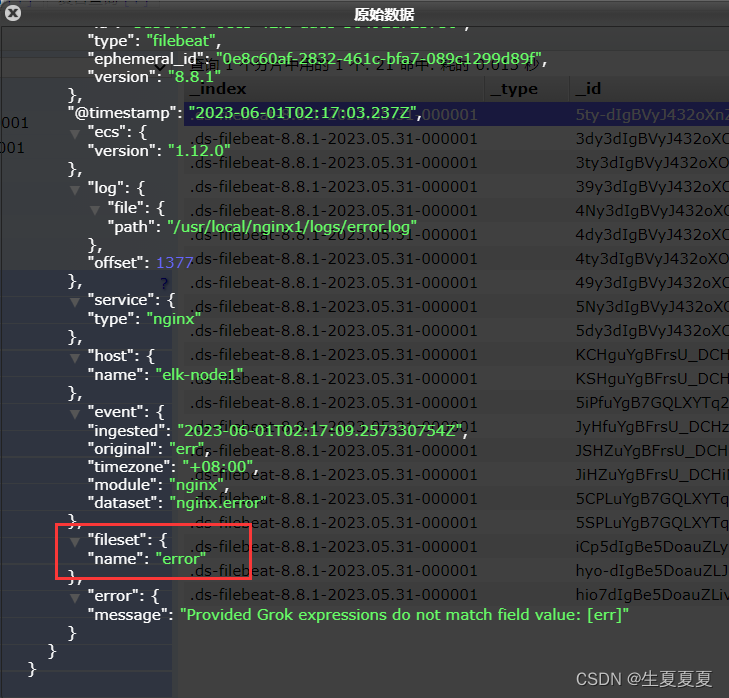
我们可以测试一下,刷新nginx页面,或者向错误日志中,插入数据
echo "err" >> error.log
- 1
能够看到,刚刚的记录已经成功插入了
关于module的其它使用,可以参考文档:

