
热门标签
热门文章
- 1黄仁勋:打破摩尔定律,机器人时代来了_打破摩尔定律,机器人时代来了
- 2kafka三节点集群2.8.0平滑升级到3.4.0过程指导_kafka 版本升级
- 3分布式锁的三种解决方案 数据库、redis、zookeeper_插入,没有redis 数据库做分布式锁
- 4Python高级数据结构_python提供高效的高级数据结构还能简单有效的面向
- 5嵌入式STM32入门之一个简单STM32汇编程序的编写_stm32嵌入汇编程序
- 6jvm与java体系结构
- 7RedisConnectionException: Unable to connect to 127.0.0.1:6379
- 8AudioLM音频生成模型
- 92024最新D卷 华为OD统一考试题库清单(按算法分类),如果你时间紧迫,就按这个刷
- 10自然语言处理的文本生成与文本模型
当前位置: article > 正文
目标检测VOC标注格式中,将斜框标注转化为水平框_bndbox
作者:凡人多烦事01 | 2024-06-15 12:37:19
赞
踩
bndbox
目标检测VOC格式数据集obb标注向hbb标注的转换(polygon 2 bndbox)
polygon(obb)和bndbox(hbb)介绍
polygon(obb)
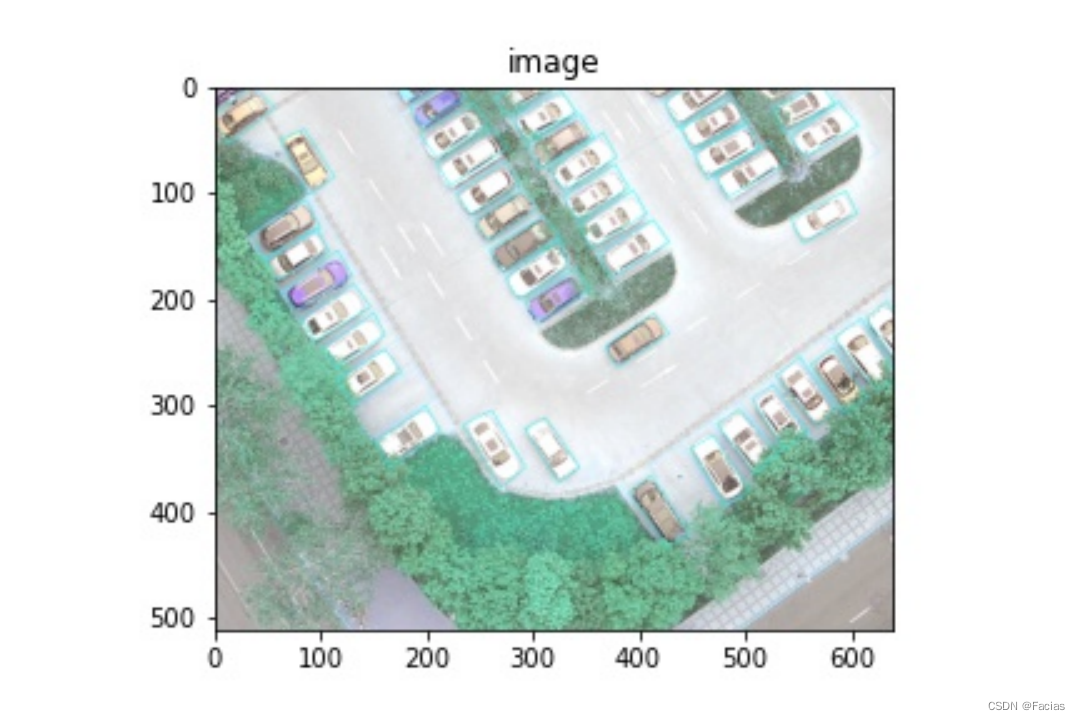
一般来说polygon标注是用来检测航拍图像,标注框的样式是斜着的四边形,因此xml文件里的描述信息为四边形的四个顶点的坐标,即每个目标一共用8个值来描述坐标信息,如下图所示:

对应标注可视化效果为(蓝色框):
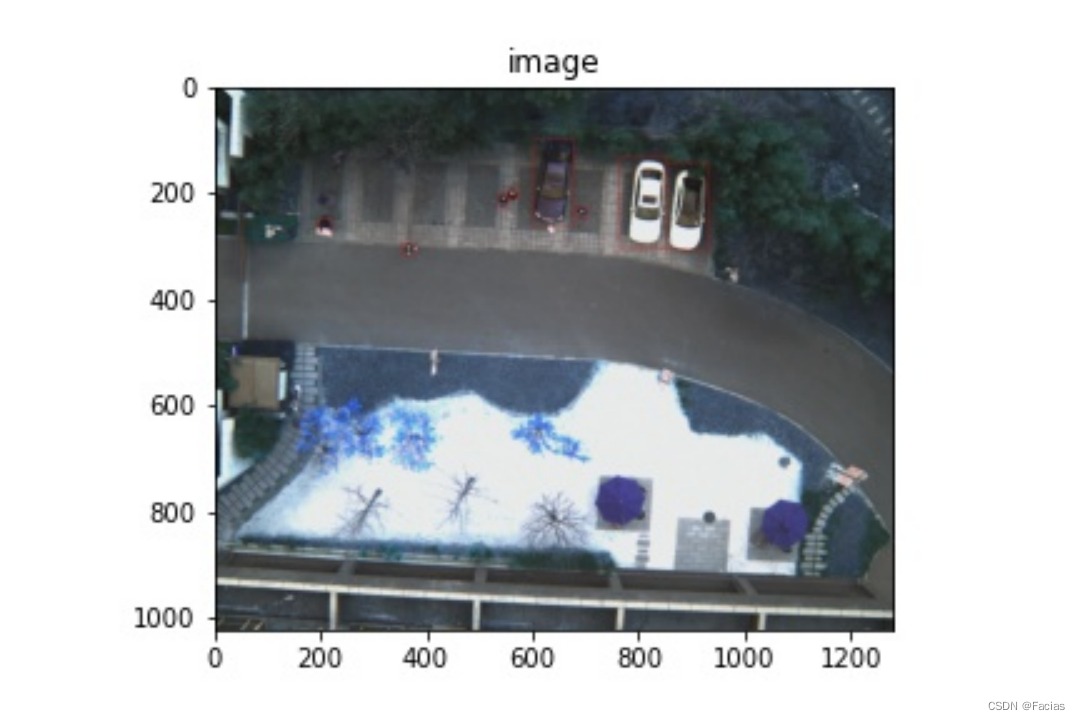
bndbox(hbb)
这个标注方式就是做目标检测经常见到的水平框,一般xml的描述信息为:

可视化效果:

本人做项目时需要将polygon格式转换为bndbox格式,所以在此将转换过程记录一下,附上代码,需要自取。
polygon2bndbox转换原理
已知polygon四个顶点的信息,可以任选两个对角线上的点,当作bndbox的矩形的两个顶点。由于bndbox的两个点为矩形左下角(x_min,y_min)和右上角(x_max,y_max),所以对于polygon我们也找出其左下角(x_min,y_min)和右上角(x_max,y_max)。
对于一个斜着的四边形。在找其左下角和右上角时分三种情况:
- 中心点左边有两个点 ,此时比较左边点的y坐标,大的为左上角,小的为左下角。右边两点y坐标大的为右上角;

2. 中心点左边有一个点 ,此时比较左边点为左下角。右边点为右上角;

polygon2bndbox转换代码
import xml.dom.minidom
import os.path

path = "/Users/dijia/Desktop/RGB-Infrared/RGB-Infrared/labels/modalA/DJI_2019050801_0002.xml"#路径
xmlfile = os.path.basename(path)
name1 = xmlfile.split('.')[0]
print(name1)

dom = xml.dom.minidom.parse(path)
root = dom.documentElement
movies = root.getElementsByTagName("object")  #获得所有该xml文件下所有object,返回为list形式
count = 0

def bndbox_func(lis):     #传入有一个元素的列表,其中每个元素是一个列表形式的坐标

    #将坐标的每一个元素映射为float
    for i in range(0,len(lis)):
        lis[i] = list(map(float,lis[i]))

    #将lis转为array,格式为[[198. 301.],[151. 335.],[164. 359.],[212. 325.]]
    coordinate = np.array(lis)

    #求中心点坐标(array相当于矩阵,可以直接进行类似矩阵的运算)
    center = coordinate[0]
    for _ in range(1, 4):
        center = center + coordinate[_]
    center = center / 4

    # 复制一份坐标,避免原坐标被破坏
    coordinate_temp = coordinate.copy()

    #找出x轴小于中心坐标点的点 left_coordinate,两个点就是左上和左下,一个点就是左下
    left_coordinate = [] # 用于存储x轴小于中心坐标点的点
    delete_index = []
    for _ in range(4):   # 将 x轴小于中心坐标点的点存储进left_coordinate
        if(coordinate[_][0] < center[0]):
            left_coordinate.append(coordinate[_])  #list(array1,array2)
            delete_index.append(_)   #list(index1,index2)

    # 若上面找出有两个点,其余点即为右上和右下
    right_coordinate = np.delete(coordinate_temp, delete_index, axis=0)  #array
    # 若上面找出有一个点
    coordinate_temp = np.delete(coordinate_temp, delete_index, axis=0)  #array

    # 将left_coordinate做备份
    left_coordinate_temp = left_coordinate.copy()

    #此时对角线和x轴斜交
    if(len(left_coordinate_temp) == 2):
        # 比较左边两个点的y轴,大的为左上
        if(left_coordinate[0][1] < left_coordinate[1][1]):
            left_bottom = left_coordinate[0]  #array
            left_top = left_coordinate[1]     #array
        elif(left_coordinate[0][1] > left_coordinate[1][1]):
            left_bottom = left_coordinate[1]  #array
            left_top = left_coordinate[0]     #array

        # 比较右边两个点的y轴,大的为右上
        if(right_coordinate[0][1] < right_coordinate[1][1]):
            right_bottom = right_coordinate[0]#array
            right_top = right_coordinate[1]   #array
        elif(right_coordinate[0][1] > right_coordinate[1][1]):
            right_bottom = right_coordinate[1]#array
            right_top = right_coordinate[0]   #array

    #此时对角线和x轴垂直
    elif(len(left_coordinate_temp) == 1):
        left_bottom = left_coordinate[0]  #左下
        delete_index = []

        for _ in range(3):
            if(coordinate_temp[_][0] == center[0] and coordinate_temp[_][1] > center[1]):
                left_top = coordinate_temp[_] #左上
                delete_index.append(_)
            if(coordinate_temp[_][0] == center[0] and coordinate_temp[_][1] < center[1]):
                right_bottom = coordinate_temp[_] #右下
                delete_index.append(_)

        coordinate_temp = np.delete(coordinate_temp, delete_index, axis=0)
        right_top = coordinate_temp[0]  #右上

    return left_top[0],left_top[1],right_bottom[0],right_bottom[1]


if __name__ == "__main__":

    for movie in movies:

        print("*****Movie*****:" + str(count))
        print(movie)
        z = movie.getElementsByTagName('polygon')[0].childNodes #每个object只有一个polygon,movie.getElementsByTagName('polygon')得到
                                                   #一个[<DOM Element: polygon at 0x7fb5402bd9c8>]形式nodelist,而[0]得到
                                                   #<DOM Element: polygon at 0x7fb5402bd9c8>
        x1 = movie.getElementsByTagName('polygon')[0].getElementsByTagName('x1')[0].childNodes[0].data
        y1 = movie.getElementsByTagName('polygon')[0].getElementsByTagName('y1')[0].childNodes[0].data
        x2 = movie.getElementsByTagName('polygon')[0].getElementsByTagName('x2')[0].childNodes[0].data
        y2 = movie.getElementsByTagName('polygon')[0].getElementsByTagName('y2')[0].childNodes[0].data
        x3 = movie.getElementsByTagName('polygon')[0].getElementsByTagName('x3')[0].childNodes[0].data
        y3 = movie.getElementsByTagName('polygon')[0].getElementsByTagName('y3')[0].childNodes[0].data
        x4 = movie.getElementsByTagName('polygon')[0].getElementsByTagName('x4')[0].childNodes[0].data
        y4 = movie.getElementsByTagName('polygon')[0].getElementsByTagName('y4')[0].childNodes[0].data

        # 所需要确定位置的四个坐标
        coordinate = [[x1, y1], [x2, y2], [x3, y3], [x4, y4]]  # 常规矩形坐标

        # 将四个顶点的polygon形式转化成左上和右下的bndbox形式
        x_min,y_min,x_max,y_max = bndbox_func(coordinate)    # 转化后的矩形坐标
        #print(x_min,y_min,x_max,y_max)

        movie.removeChild(movie.getElementsByTagName('polygon')[0])
        #print(movie.childNodes)

        zd = movie.ownerDocument
        bbox = zd.createElement('bndbox')
        #添加新的节点“bndbox”
        movie.appendChild(bbox)
        #新节点里添加新的元素
        xx = zd.createElement('xmax')
        xn = zd.createElement('xmin')
        yx = zd.createElement('ymax')
        yn = zd.createElement('ymin')

        xn_text = zd.createTextNode(str(x_min))
        xn.appendChild(xn_text)
        bbox.appendChild(xn)

        yn_text = zd.createTextNode(str(y_min))
        yn.appendChild(yn_text)
        bbox.appendChild(yn)

        xx_text = zd.createTextNode(str(x_max))
        xx.appendChild(xx_text)
        bbox.appendChild(xx)

        yx_text = zd.createTextNode(str(y_max))
        yx.appendChild(yx_text)
        bbox.appendChild(yx)

        count = count + 1

        try:
            with open(path, 'w', encoding='UTF-8') as fh:
                # 4.writexml()第一个参数是目标文件对象,第二个参数是根节点的缩进格式,第三个参数是其他子节点的缩进格式,
                # 第四个参数制定了换行格式,第五个参数制定了xml内容的编码。
                dom.writexml(fh, indent = '\t', addindent = '\t', newl='\n', encoding='UTF-8')
                print('OK')
                fh.close()
        except Exception as err:
            print('错误:{err}'.format(err=err))

- 1
- 2
- 3
- 4
- 5
- 6
- 7
- 8
- 9
- 10
- 11
- 12
- 13
- 14
- 15
- 16
- 17
- 18
- 19
- 20
- 21
- 22
- 23
- 24
- 25
- 26
- 27
- 28
- 29
- 30
- 31
- 32
- 33
- 34
- 35
- 36
- 37
- 38
- 39
- 40
- 41
- 42
- 43
- 44
- 45
- 46
- 47
- 48
- 49
- 50
- 51
- 52
- 53
- 54
- 55
- 56
- 57
- 58
- 59
- 60
- 61
- 62
- 63
- 64
- 65
- 66
- 67
- 68
- 69
- 70
- 71
- 72
- 73
- 74
- 75
- 76
- 77
- 78
- 79
- 80
- 81
- 82
- 83
- 84
- 85
- 86
- 87
- 88
- 89
- 90
- 91
- 92
- 93
- 94
- 95
- 96
- 97
- 98
- 99
- 100
- 101
- 102
- 103
- 104
- 105
- 106
- 107
- 108
- 109
- 110
- 111
- 112
- 113
- 114
- 115
- 116
- 117
- 118
- 119
- 120
- 121
- 122
- 123
- 124
- 125
- 126
- 127
- 128
- 129
- 130
- 131
- 132
- 133
- 134
- 135
- 136
- 137
- 138
- 139
- 140
- 141
- 142
- 143
- 144
- 145
- 146
- 147
- 148
- 149
- 150
- 151
- 152
可视化效果
bndbox标注可视化代码
#用opencv画polygon
import cv2
import os
import numpy as np
import xml.etree.ElementTree as ET
import matplotlib.pyplot as plt

xml_file = '/Users/dijia/Desktop/原始数据/xml/000617_303.735857.xml'
tree = ET.parse(xml_file)
root = tree.getroot()
imgfile = '/Users/dijia/Desktop/原始数据/rgb/000617_303.735857.jpg'
im = cv2.imread(imgfile)

polygon_list = []
for object in root.findall('object'):
    li = []
    object_name = object.find('name').text
    Xmin = int(float(object.find('bndbox').find('xmin').text))
    Ymin = int(float(object.find('bndbox').find('ymin').text))
    Xmax = int(float(object.find('bndbox').find('xmax').text))
    Ymax = int(float(object.find('bndbox').find('ymax').text))
    cv2.rectangle(im, (Xmin, Ymin), (Xmax, Ymax), (255,0,0), True)
    #cv2.circle(im, (Xmin, Ymin), radius=5, color=(255, 0, 0))
    #cv2.circle(im, (Xmax, Ymax), radius=5, color=(255, 0, 0))
plt.figure("Image") # 图像窗口名称
plt.imshow(im)
plt.axis('on') # 关掉坐标轴为 off
plt.title('image') # 图像题目
plt.savefig('/Users/dijia/Desktop/test4.jpg')
plt.show()
- 1
- 2
- 3
- 4
- 5
- 6
- 7
- 8
- 9
- 10
- 11
- 12
- 13
- 14
- 15
- 16
- 17
- 18
- 19
- 20
- 21
- 22
- 23
- 24
- 25
- 26
- 27
- 28
- 29
- 30
可视化效果(红色框):
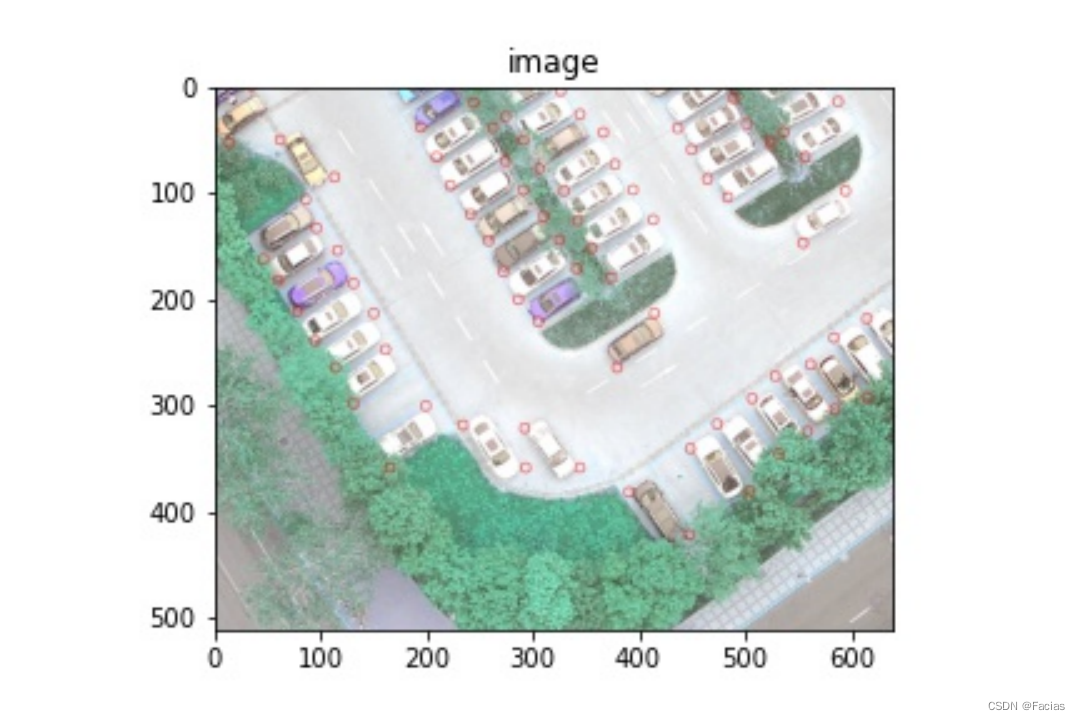
转换后可以用可视化代码查看效果,polygon的可视化稍微改一下就行,这里不贴相关代码了。
将polygon标注的对角线点找到,效果如图:
将其画成bndbox:
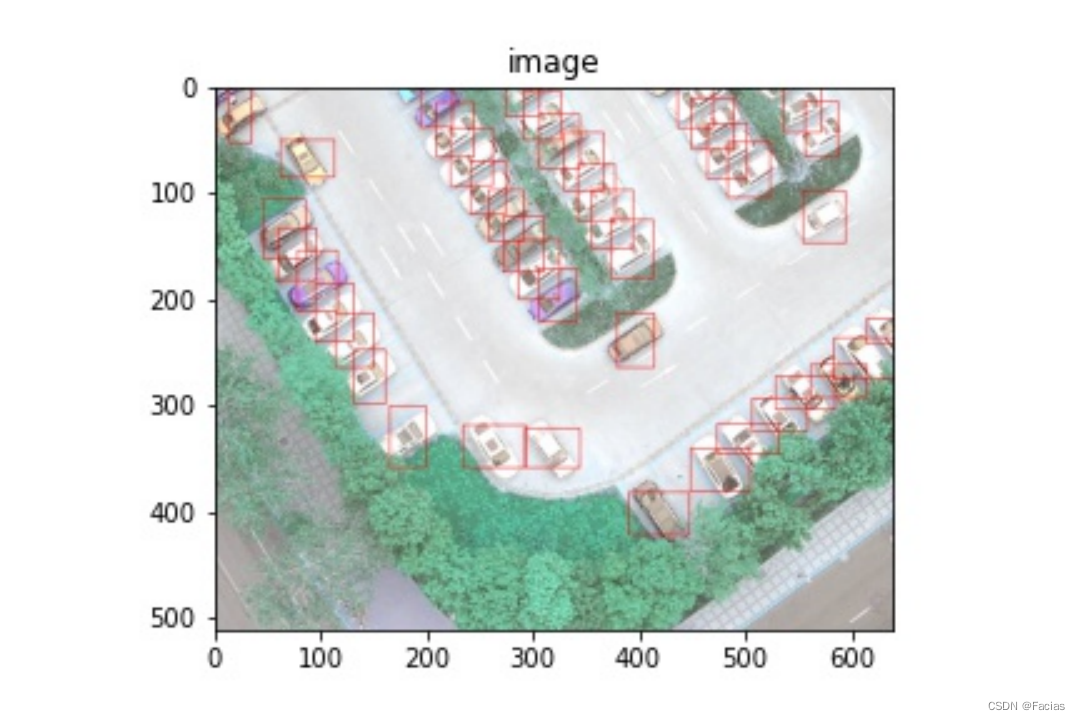
虽然目标有些区域被圈出去了,不过能凑活着训练。这里还是建议在标注数据前就构思好需要用什么标注信息。
声明:本文内容由网友自发贡献,转载请注明出处:【wpsshop博客】
推荐阅读
相关标签

