热门标签
热门文章
- 1【分布式websocket】IM系统中为什么要做心跳!Netty中如何做心跳,客户端如何做断线重连!_netty websocket心跳
- 2erlang rabbitmq源码解析_RabbitMQ面试宝典,赶紧收藏!
- 3〖Python零基础入门篇㉘〗- Python中不同数据类型间的转换_python不同类型数据转换
- 4flowable表梳理
- 5TensorFlow vs PyTorch:深度学习框架的比较研究_tensorflow和pytorch哪个好
- 6hadoop 3.x 无法访问hdfs(50070,8088)的web界面
- 7大模型安全测试入门指南
- 8chatgpt赋能python:Python中出现NaN的原因及相关处理方法_python nan
- 9k-means聚类算法详解_kmeans算法_应用k-means算法解决聚类问题
- 10Android开发者必看避坑指南,字节跳动Android面试全套真题解析在互联网火了
当前位置: article > 正文
基于spark的大数据分析预测地震受灾情况的系统设计_基于spark的预测分析_基于地震数据的spark数据分析与预测
作者:寸_铁 | 2024-06-26 12:11:09
赞
踩
基于地震数据的spark数据分析与预测
基于spark的大数据分析预测地震受灾情况的系统设计
在本篇博客中,我们将介绍如何使用Apache Spark框架进行地震受灾情况的预测。我们将结合数据分析、特征工程、模型训练和评估等步骤,最终建立一个预测模型来预测地震造成的破坏程度,同时使用可视化大屏的方式展示数据的分布。
1、数据来源和准备
我们使用了合并后的地震数据作为我们的数据集。首先,让我们来看一下我们的数据集
# 读取数据
data = spark.read.csv("../data\_ana/merged\_data.csv", header=True, inferSchema=True).sample(False, 0.1, seed=42)

data.show()
- 1
- 2
- 3
- 4
- 5

2、数据预处理和特征工程
在数据预处理和特征工程阶段,我们将对数据进行清洗、转换和特征提取等操作。具体步骤如下:
# 数据预处理和特征工程
string_cols = ['gender\_individual', 'presence\_in\_household', 'disability\_individual',
               'education\_level\_individual','marital\_status\_individual', 'legal\_ownership\_status',
               'land\_surface\_condition', 'foundation\_type','roof\_type', 'ground\_floor\_type',
               'other\_floor\_type', 'position', 'plan\_configuration','condition\_post\_eq',
               'damage\_grade\_x', 'technical\_solution\_proposed\_x', 'area\_assesed',
               'technical\_solution\_proposed\_y','vdcmun\_name', 'district\_name']

# 创建 StringIndexer 和 OneHotEncoder 对象
indexers = [StringIndexer(inputCol=column, outputCol=column+"\_index",handleInvalid="skip") for column in string_cols]
encoder = OneHotEncoder(inputCols=[column+"\_index" for column in string_cols],
                        outputCols=[column+"\_encoded" for column in string_cols])

# 创建特征向量
assembler = VectorAssembler(inputCols=encoder.getOutputCols(), outputCol="features")

# 创建Pipeline
pipeline = Pipeline(stages=indexers + [encoder, assembler])
data_final = pipeline.fit(data).transform(data)

data_final.show()
- 1
- 2
- 3
- 4
- 5
- 6
- 7
- 8
- 9
- 10
- 11
- 12
- 13
- 14
- 15
- 16
- 17
- 18
- 19
- 20
- 21
- 22

3、异常数据处理
在异常数据处理阶段,我们将处理可能存在的异常情况,确保数据的完整性和准确性:
# 使用正则表达式提取数字部分
data_final = data_final.withColumn("damage\_grade\_y\_numeric", regexp_extract(data_final["damage\_grade\_y"], r'\d+', 0))

# 将列转换为 numeric 类型
data_final = data_final.withColumn("damage\_grade\_y\_numeric", data_final["damage\_grade\_y\_numeric"].cast("int"))

# 显示转换后的结果
data_final.select("damage\_grade\_y", "damage\_grade\_y\_numeric").show()
- 1
- 2
- 3
- 4
- 5
- 6
- 7
- 8
- 9

4、标题模型训练和评估
在模型训练和评估阶段,我们将使用随机森林分类器进行模型训练,并评估模型在测试集上的表现:
# 划分数据集为训练集和测试集
(train_data, test_data) = data_final.randomSplit([0.8, 0.2], seed=1234)

# 初始化随机森林分类器
rf = RandomForestClassifier(labelCol="damage\_grade\_y\_numeric", featuresCol="features", numTrees=10)

# 训练模型
model = rf.fit(train_data)

# 在测试集上进行预测
predictions = model.transform(test_data)

# 模型评估
evaluator = MulticlassClassificationEvaluator(labelCol="damage\_grade\_y\_numeric", predictionCol="prediction", metricName="accuracy")
accuracy = evaluator.evaluate(predictions)

print("Test Accuracy = {:.2f}%".format(accuracy \* 100))
- 1
- 2
- 3
- 4
- 5
- 6
- 7
- 8
- 9
- 10
- 11
- 12
- 13
- 14
- 15
- 16
- 17
- 18

标题5、可视化大屏实现与展示
为了更直观地展示预测结果,我们设计了一个可视化大屏。该大屏将包括地图展示、受灾情况分布图以及预测结果展示等内容,以帮助用户更好地理解地震造成的破坏程度。
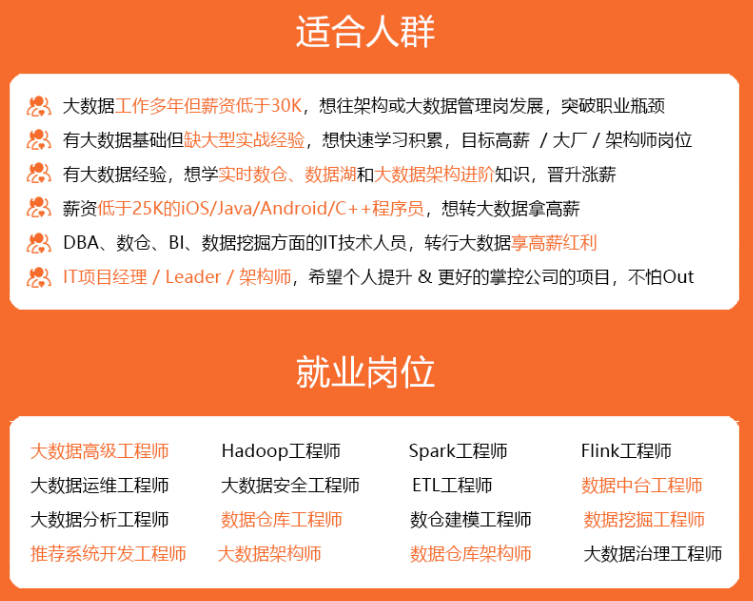
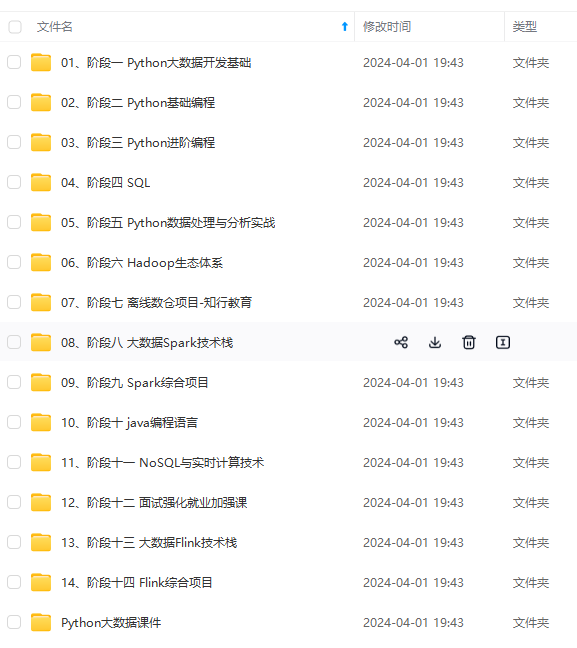
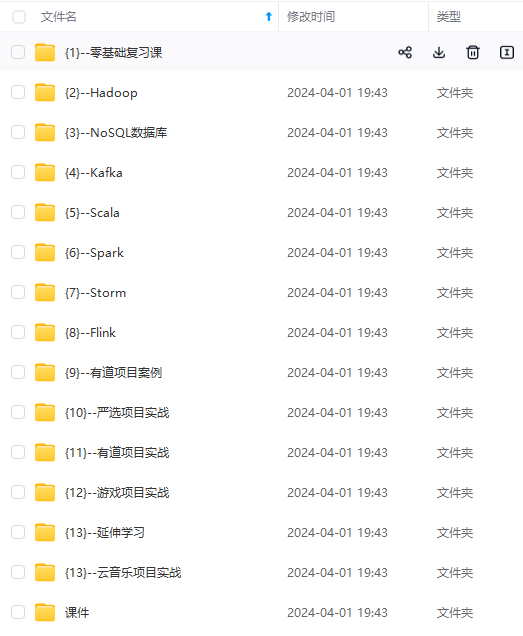
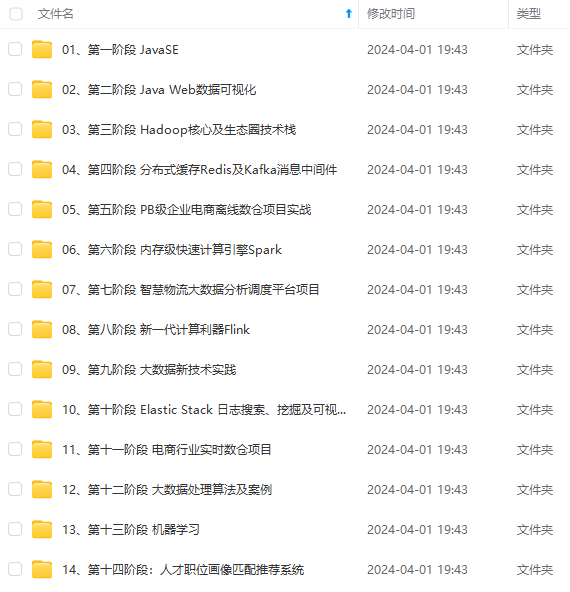
<html><head> <meta charset="utf-8"> <title>www.husonghe.com</title> <style> html { height: 100%; background-image: -webkit-radial-gradient(ellipse farthest-corner at center center, #1b44e4 0%, #020f3a 100%); background-image: radial-gradient(ellipse farthest-corner at center center, #1b44e4 0%, #020f3a 100%); cursor: move; } body { width: 100%; margin: 0; overflow: hidden; } </style> </head> <body> <canvas id="canv" width="1920" height="572"></canvas> <script> var num = 200; var w = window.innerWidth; var h = window.innerHeight; var max = 100; var \_x = 0; var \_y = 0; var \_z = 150; var dtr = function(d) { return d \* Math.PI / 180; }; var rnd = function() { return Math.sin(Math.floor(Math.random() \* 360) \* Math.PI / 180); }; var dist = function(p1, p2, p3) { return Math.sqrt(Math.pow(p2.x - p1.x, 2) + Math.pow(p2.y - p1.y, 2) + Math.pow(p2.z - p1.z, 2)); }; var cam = { obj: { x: \_x, y: \_y, z: \_z }, dest: { x: 0, y: 0, z: 1 }, dist: { x: 0, y: 0, z: 200 }, ang: { cplane: 0, splane: 0, ctheta: 0, stheta: 0 }, zoom: 1, disp: { x: w / 2, y: h / 2, z: 0 }, upd: function() { cam.dist.x = cam.dest.x - cam.obj.x; cam.dist.y = cam.dest.y - cam.obj.y; cam.dist.z = cam.dest.z - cam.obj.z; cam.ang.cplane = -cam.dist.z / Math.sqrt(cam.dist.x \* cam.dist.x + cam.dist.z \* cam.dist.z); cam.ang.splane = cam.dist.x / Math.sqrt(cam.dist.x \* cam.dist.x + cam.dist.z \* cam.dist.z); cam.ang.ctheta = Math.sqrt(cam.dist.x \* cam.dist.x + cam.dist.z \* cam.dist.z) / Math.sqrt(cam.dist.x \* cam.dist.x + cam.dist.y \* cam.dist.y + cam.dist.z \* cam.dist.z); cam.ang.stheta = -cam.dist.y / Math.sqrt(cam.dist.x \* cam.dist.x + cam.dist.y \* cam.dist.y + cam.dist.z \* cam.dist.z); } }; var trans = { parts: { sz: function(p, sz) { return { x: p.x \* sz.x, y: p.y \* sz.y, z: p.z \* sz.z }; }, rot: { x: function(p, rot) { return { x: p.x, y: p.y \* Math.cos(dtr(rot.x)) - p.z \* Math.sin(dtr(rot.x)), z: p.y \* Math.sin(dtr(rot.x)) + p.z \* Math.cos(dtr(rot.x)) }; }, y: function(p, rot) { return { x: p.x \* Math.cos(dtr(rot.y)) + p.z \* Math.sin(dtr(rot.y)), y: p.y, z: -p.x \* Math.sin(dtr(rot.y)) + p.z \* Math.cos(dtr(rot.y)) }; }, z: function(p, rot) { return { x: p.x \* Math.cos(dtr(rot.z)) - p.y \* Math.sin(dtr(rot.z)), y: p.x \* Math.sin(dtr(rot.z)) + p.y \* Math.cos(dtr(rot.z)), z: p.z }; } }, pos: function(p, pos) { return { x: p.x + pos.x, y: p.y + pos.y, z: p.z + pos.z }; } }, pov: { plane: function(p) { return { x: p.x \* cam.ang.cplane + p.z \* cam.ang.splane, y: p.y, z: p.x \* -cam.ang.splane + p.z \* cam.ang.cplane }; }, theta: function(p) { return { x: p.x, y: p.y \* cam.ang.ctheta - p.z \* cam.ang.stheta, z: p.y \* cam.ang.stheta + p.z \* cam.ang.ctheta }; }, set: function(p) { return { x: p.x - cam.obj.x, y: p.y - cam.obj.y, z: p.z - cam.obj.z }; } }, persp: function(p) { return { x: p.x \* cam.dist.z / p.z \* cam.zoom, y: p.y \* cam.dist.z / p.z \* cam.zoom, z: p.z \* cam.zoom, p: cam.dist.z / p.z }; }, disp: function(p, disp) { return { x: p.x + disp.x, y: -p.y + disp.y, z: p.z + disp.z, p: p.p }; }, steps: function(\_obj\_, sz, rot, pos, disp) { var \_args = trans.parts.sz(\_obj\_, sz); \_args = trans.parts.rot.x(\_args, rot); \_args = trans.parts.rot.y(\_args, rot); \_args = trans.parts.rot.z(\_args, rot); \_args = trans.parts.pos(\_args, pos); \_args = trans.pov.plane(\_args); \_args = trans.pov.theta(\_args); \_args = trans.pov.set(\_args); \_args = trans.persp(\_args); \_args = trans.disp(\_args, disp); return \_args; } }; (function() { "use strict"; var threeD = function(param) { this.transIn = {}; this.transOut = {}; this.transIn.vtx = (param.vtx); this.transIn.sz = (param.sz); this.transIn.rot = (param.rot); this.transIn.pos = (param.pos); }; threeD.prototype.vupd = function() { this.transOut = trans.steps( this.transIn.vtx, this.transIn.sz, this.transIn.rot, this.transIn.pos, cam.disp ); }; var Build = function() { this.vel = 0.04; this.lim = 360; this.diff = 200; this.initPos = 100; this.toX = \_x; this.toY = \_y; this.go(); }; Build.prototype.go = function() { this.canvas = document.getElementById("canv"); this.canvas.width = window.innerWidth; this.canvas.height = window.innerHeight; this.$ = canv.getContext("2d"); this.$.globalCompositeOperation = 'source-over'; this.varr = []; this.dist = []; this.calc = []; for (var i = 0, len = num; i < len; i++) { this.add(); } this.rotObj = { **自我介绍一下,小编13年上海交大毕业,曾经在小公司待过,也去过华为、OPPO等大厂,18年进入阿里一直到现在。** **深知大多数大数据工程师,想要提升技能,往往是自己摸索成长或者是报班学习,但对于培训机构动则几千的学费,着实压力不小。自己不成体系的自学效果低效又漫长,而且极易碰到天花板技术停滞不前!** **因此收集整理了一份《2024年大数据全套学习资料》,初衷也很简单,就是希望能够帮助到想自学提升又不知道该从何学起的朋友。**      **既有适合小白学习的零基础资料,也有适合3年以上经验的小伙伴深入学习提升的进阶课程,基本涵盖了95%以上大数据开发知识点,真正体系化!** **由于文件比较大,这里只是将部分目录大纲截图出来,每个节点里面都包含大厂面经、学习笔记、源码讲义、实战项目、讲解视频,并且后续会持续更新** **如果你觉得这些内容对你有帮助,可以添加VX:vip204888 (备注大数据获取)**  图片转存中...(img-HqE5HJn3-1712886791201)] [外链图片转存中...(img-bQEpxvPD-1712886791202)] [外链图片转存中...(img-xRpXvMRh-1712886791202)] **既有适合小白学习的零基础资料,也有适合3年以上经验的小伙伴深入学习提升的进阶课程,基本涵盖了95%以上大数据开发知识点,真正体系化!** **由于文件比较大,这里只是将部分目录大纲截图出来,每个节点里面都包含大厂面经、学习笔记、源码讲义、实战项目、讲解视频,并且后续会持续更新** **如果你觉得这些内容对你有帮助,可以添加VX:vip204888 (备注大数据获取)** [外链图片转存中...(img-NzhGuk8J-1712886791202)]
- 1
- 2
- 3
- 4
- 5
- 6
- 7
- 8
- 9
- 10
- 11
- 12
- 13
- 14
- 15
- 16
- 17
- 18
- 19
- 20
- 21
- 22
- 23
- 24
- 25
- 26
- 27
- 28
- 29
- 30
- 31
- 32
- 33
- 34
- 35
- 36
- 37
- 38
- 39
- 40
- 41
- 42
- 43
- 44
- 45
- 46
- 47
- 48
- 49
- 50
- 51
- 52
- 53
- 54
- 55
- 56
- 57
- 58
- 59
- 60
- 61
- 62
- 63
- 64
- 65
- 66
- 67
- 68
- 69
- 70
- 71
- 72
- 73
- 74
- 75
- 76
- 77
- 78
- 79
- 80
- 81
- 82
- 83
- 84
- 85
- 86
- 87
- 88
- 89
- 90
- 91
- 92
- 93
- 94
- 95
- 96
- 97
- 98
- 99
- 100
- 101
- 102
- 103
- 104
- 105
- 106
- 107
- 108
- 109
- 110
- 111
- 112
- 113
- 114
- 115
- 116
- 117
- 118
- 119
- 120
- 121
- 122
- 123
- 124
- 125
- 126
- 127
- 128
- 129
- 130
- 131
- 132
- 133
- 134
- 135
- 136
- 137
- 138
- 139
- 140
- 141
- 142
- 143
- 144
- 145
- 146
- 147
- 148
- 149
- 150
- 151
- 152
- 153
- 154
- 155
- 156
- 157
- 158
- 159
- 160
- 161
- 162
- 163
- 164
- 165
- 166
- 167
- 168
- 169
- 170
- 171
- 172
- 173
- 174
- 175
- 176
- 177
- 178
- 179
- 180
- 181
- 182
- 183
- 184
- 185
- 186
- 187
- 188
- 189
- 190
- 191
- 192
- 193
- 194
- 195
- 196
- 197
- 198
- 199
- 200
- 201
- 202
- 203
- 204
- 205
- 206
- 207
- 208
- 209
- 210
- 211
- 212
- 213
- 214
- 215
- 216
- 217
- 218
- 219
- 220
- 221
- 222
- 223
- 224
- 225
- 226
- 227
- 228
- 229
- 230
- 231
- 232
- 233
- 234
- 235
- 236
- 237
- 238
- 239
- 240
- 241
- 242
- 243
- 244
- 245
- 246
- 247
- 248
- 249
- 250
- 251
- 252
- 253
本文内容由网友自发贡献,转载请注明出处:https://www.wpsshop.cn/w/寸_铁/article/detail/759316
推荐阅读
相关标签


