
热门标签
热门文章
- 12023年4月Web3行业月度发展报告区块链篇 | 陀螺科技会员专享
- 2ubuntu20.04安装完没有连接wifi的选项,ubuntu网卡驱动_ubuntu20.04没有连接wifi选项
- 3解决subprocess.CalledProcessError: Command ‘[‘dot‘, ‘-Tpdf‘, ‘-O‘, ‘Digraph.gv‘]‘ returned non-zero
- 4使用Golang创建windows GUI图形界面并添加图标_golang 图形界面
- 5Linux TCP/IP 网络工具对比:net-tools 和 iproute2_linux tcptool
- 6【就业必备知识】大学毕业如何处理档案和户口,小心变成死档和黑户_毕业户口没转出会变成黑户吗
- 7mqtt集群搭建并使用nginx做负载均衡_亲测得结论_mqtt负载均衡
- 8Unity 从0开始编写一个技能编辑器_01_分析需求_技能编辑器 unity
- 9【Python爬虫】基于selenium库爬取京东商品数据——以“七夕”为例_京东图书 selenium
- 10【C++基础入门】cLion的安装、搭建C++环境_clion创建c++项目
当前位置: article > 正文
Grafana 获取MySQL数据展示报表_gradio 分页表格
作者:我家小花儿 | 2024-02-16 14:40:20
赞
踩
gradio 分页表格
Grafana 安装
wget https://s3-us-west-2.amazonaws.com/grafana-releases/release/grafana-4.6.2-1.x86_64.rpm
配置文件 /etc/grafana/grafana.ini
日志目录 /var/log/grafana
启动命令 sudo service grafana-server start
Grafana 元数据存储 sqlite3 /var/lib/grafana/grafana.db
Grafana启动到80端口
http://www.cnblogs.com/creazylinux/p/7206942.html
报错信息
grafana使用介绍
msg=”Fail to start server” logger=server error=”listen tcp 0.0.0.0:80: bind: permission denied”
解决办法
setcap ‘cap_net_bind_service=+ep’ /usr/sbin/grafana-server
service grafana-server restart
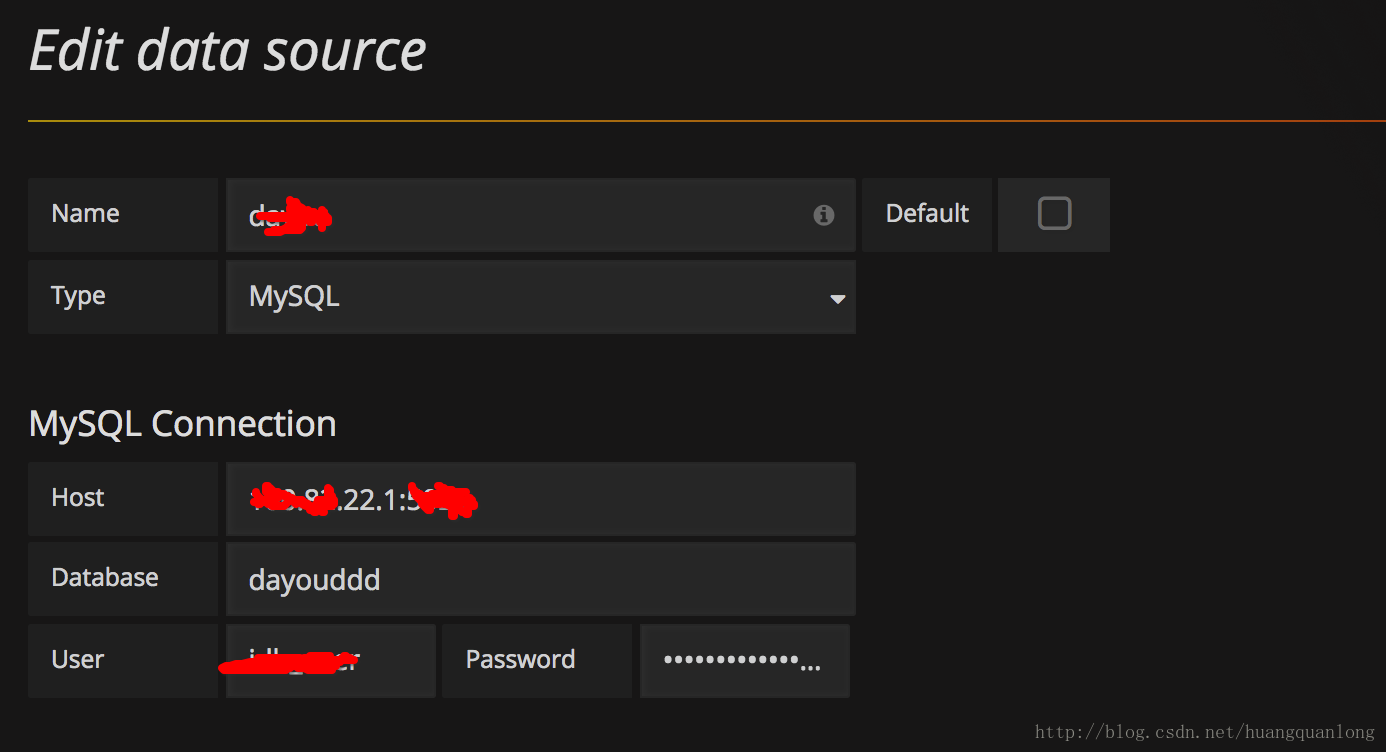
配置MySQL数据源
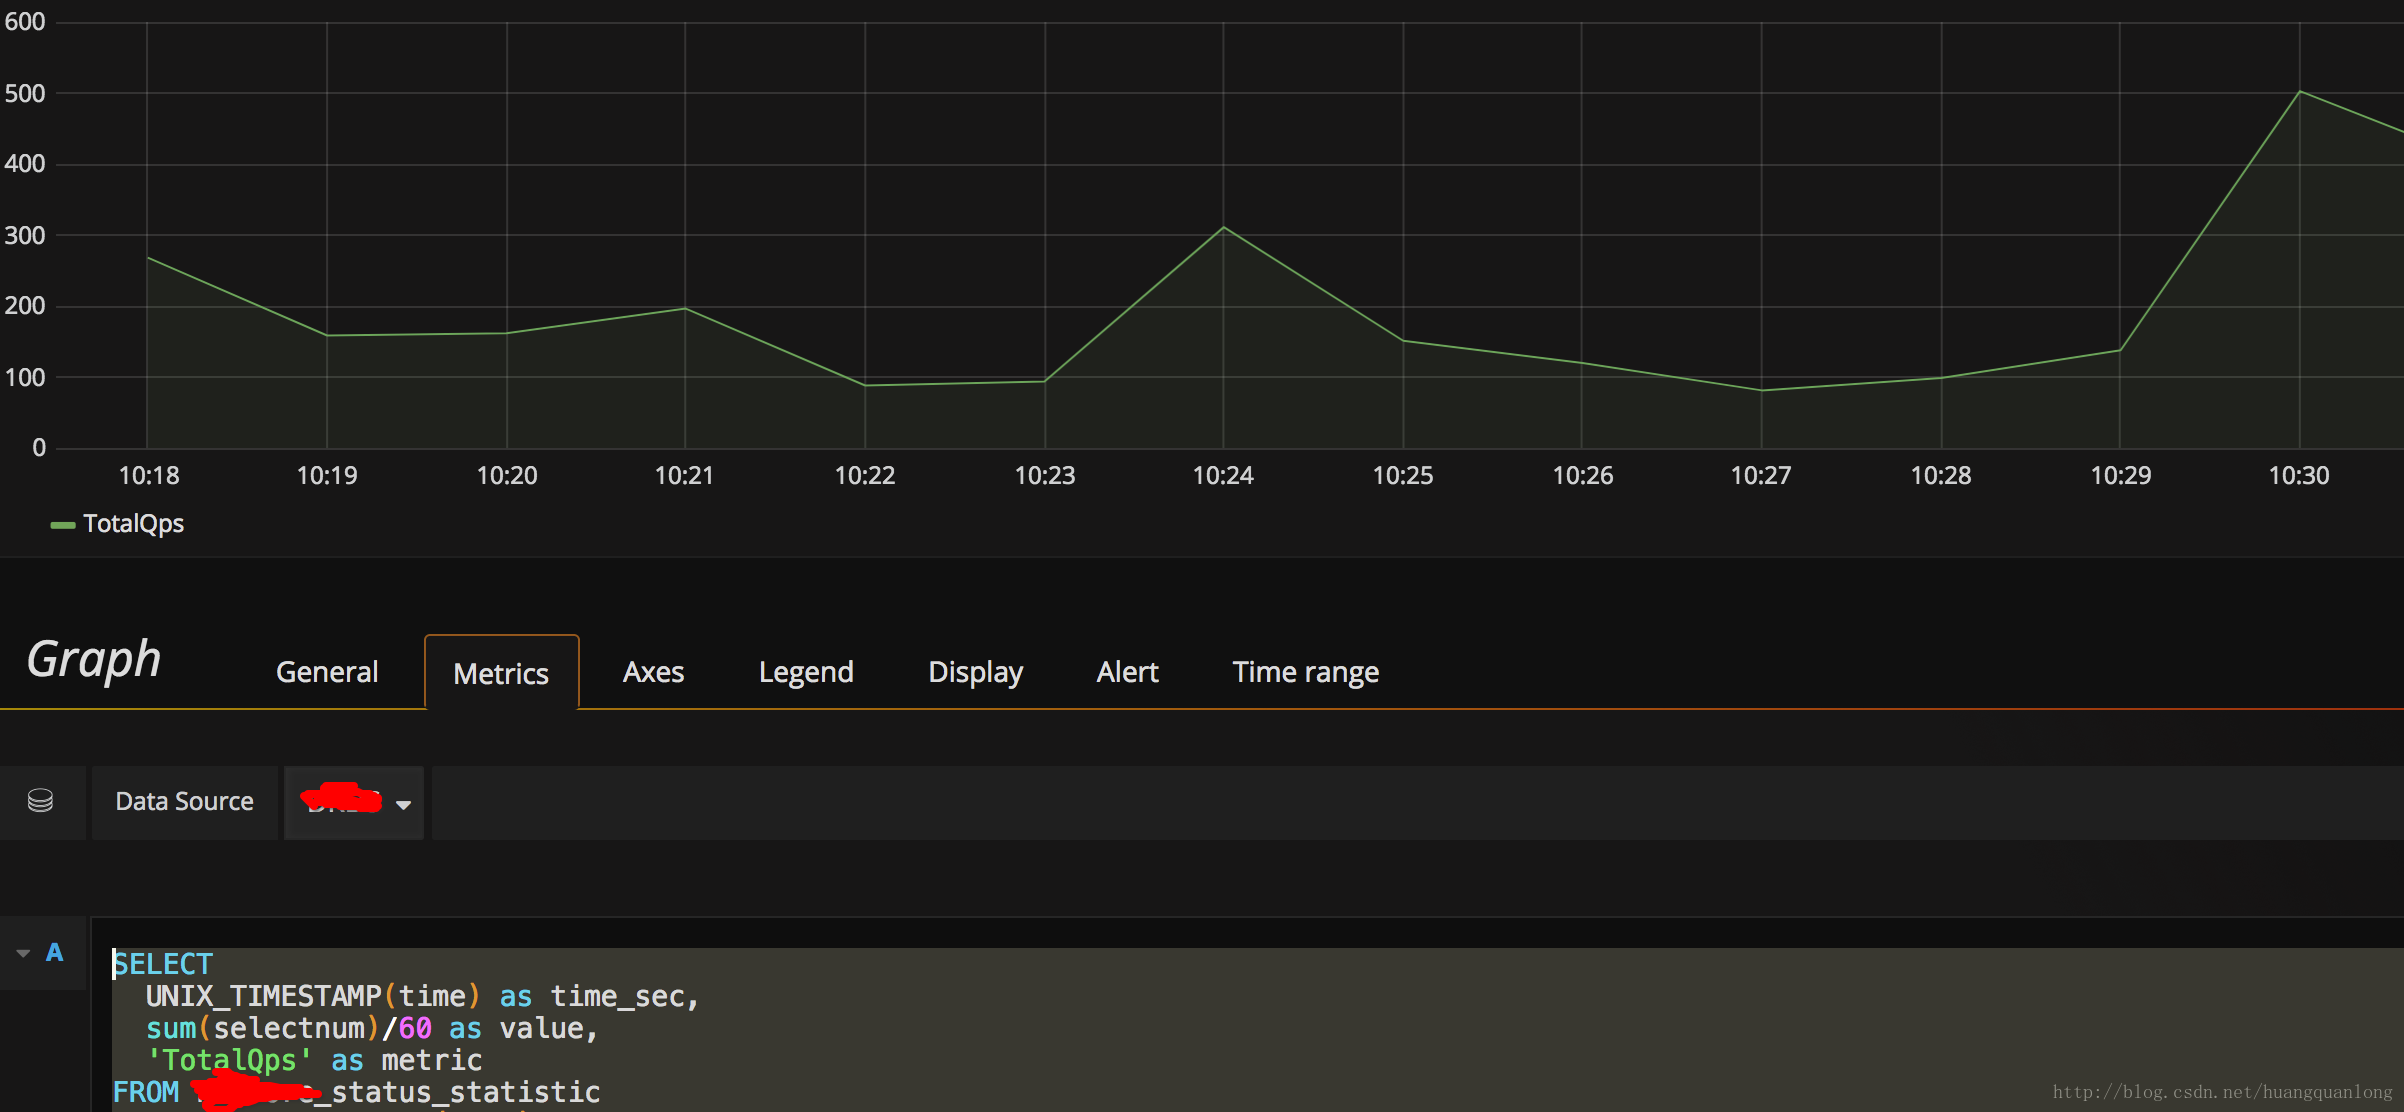
增加DashBoard 选择metric
SELECT
  UNIX_TIMESTAMP(time) as time_sec,
  sum(selectnum)/60 as value,
  'TotalQps' as metric
FROM _status_statistic
WHERE $__timeFilter(time)
group by  time
ORDER BY time ASC

实际下发的SQL
select UNIX_TIMESTAMP(`_status_statistic`.`time`) as `time_sec`,(SUM(`_status_statistic`.`selectnum`) / 60) as `value`,('TotalQps') as `metric` from `_status_statistic_20171121_0` `_status_statistic` where ((`_status_statistic`.`time` >= '2017-11-21 10:03:29') AND (`_status_statistic`.`time` <= '2017-11-21 10:18:29')) group by `_status_statistic`.`time` order by `_status_statistic`.`time` asc


 CREATE TABLE `_status_statistic` (
  `time` datetime DEFAULT NULL,
  `serverip` varchar(32) DEFAULT NULL COMMENT 'ip',
  `selectNum` bigint(20) DEFAULT NULL,
  `loadNum` bigint(20) DEFAULT NULL,
  `insertNum` bigint(20) DEFAULT NULL,
  `failedInsertNum` bigint(20) DEFAULT NULL
) ENGINE= DEFAULT CHARSET=utf8mb4
- 1
- 2
- 3
- 4
- 5
- 6
- 7
- 8
- 9
- 10
- 11
- 12
- 13
- 14
- 15
- 16
- 17
- 18
- 19
- 20
- 21
声明:本文内容由网友自发贡献,不代表【wpsshop博客】立场,版权归原作者所有,本站不承担相应法律责任。如您发现有侵权的内容,请联系我们。转载请注明出处:https://www.wpsshop.cn/w/我家小花儿/article/detail/94352
推荐阅读
相关标签

