- 1Ubuntu 18.04 环境下编译Android 源码_ubuntu18.04编译android8
- 2Redhat 8更换yum网络源(aliyun)_redhat8更换yum源
- 3Adobe Media Encoder ME v24.3.0 解锁版 (视频和音频编码渲染工具)
- 4OfficeToolPlus工具分享
- 5[第四课笔记]XTuner 大模型单卡低成本微调实战_大模型微调需要什么配置
- 6Hadoop集群环境搭建与应用回顾_基于hadoop平台的搭建和应用
- 7android studio使用教程_android studio怎么做在线客服
- 8git拉取远程分支到本地(本地不存在的分支)_git切换到本地没有的分支
- 9头歌(educoder)第 4 章 Java入门之方法 Java入门 - 方法的使用_头歌java入门方法的使用答案
- 10考研经验分享
openlayers学习记录,持续更新..._openlayers学习笔记
赞
踩
一、加载地图
以加载天地图为例:
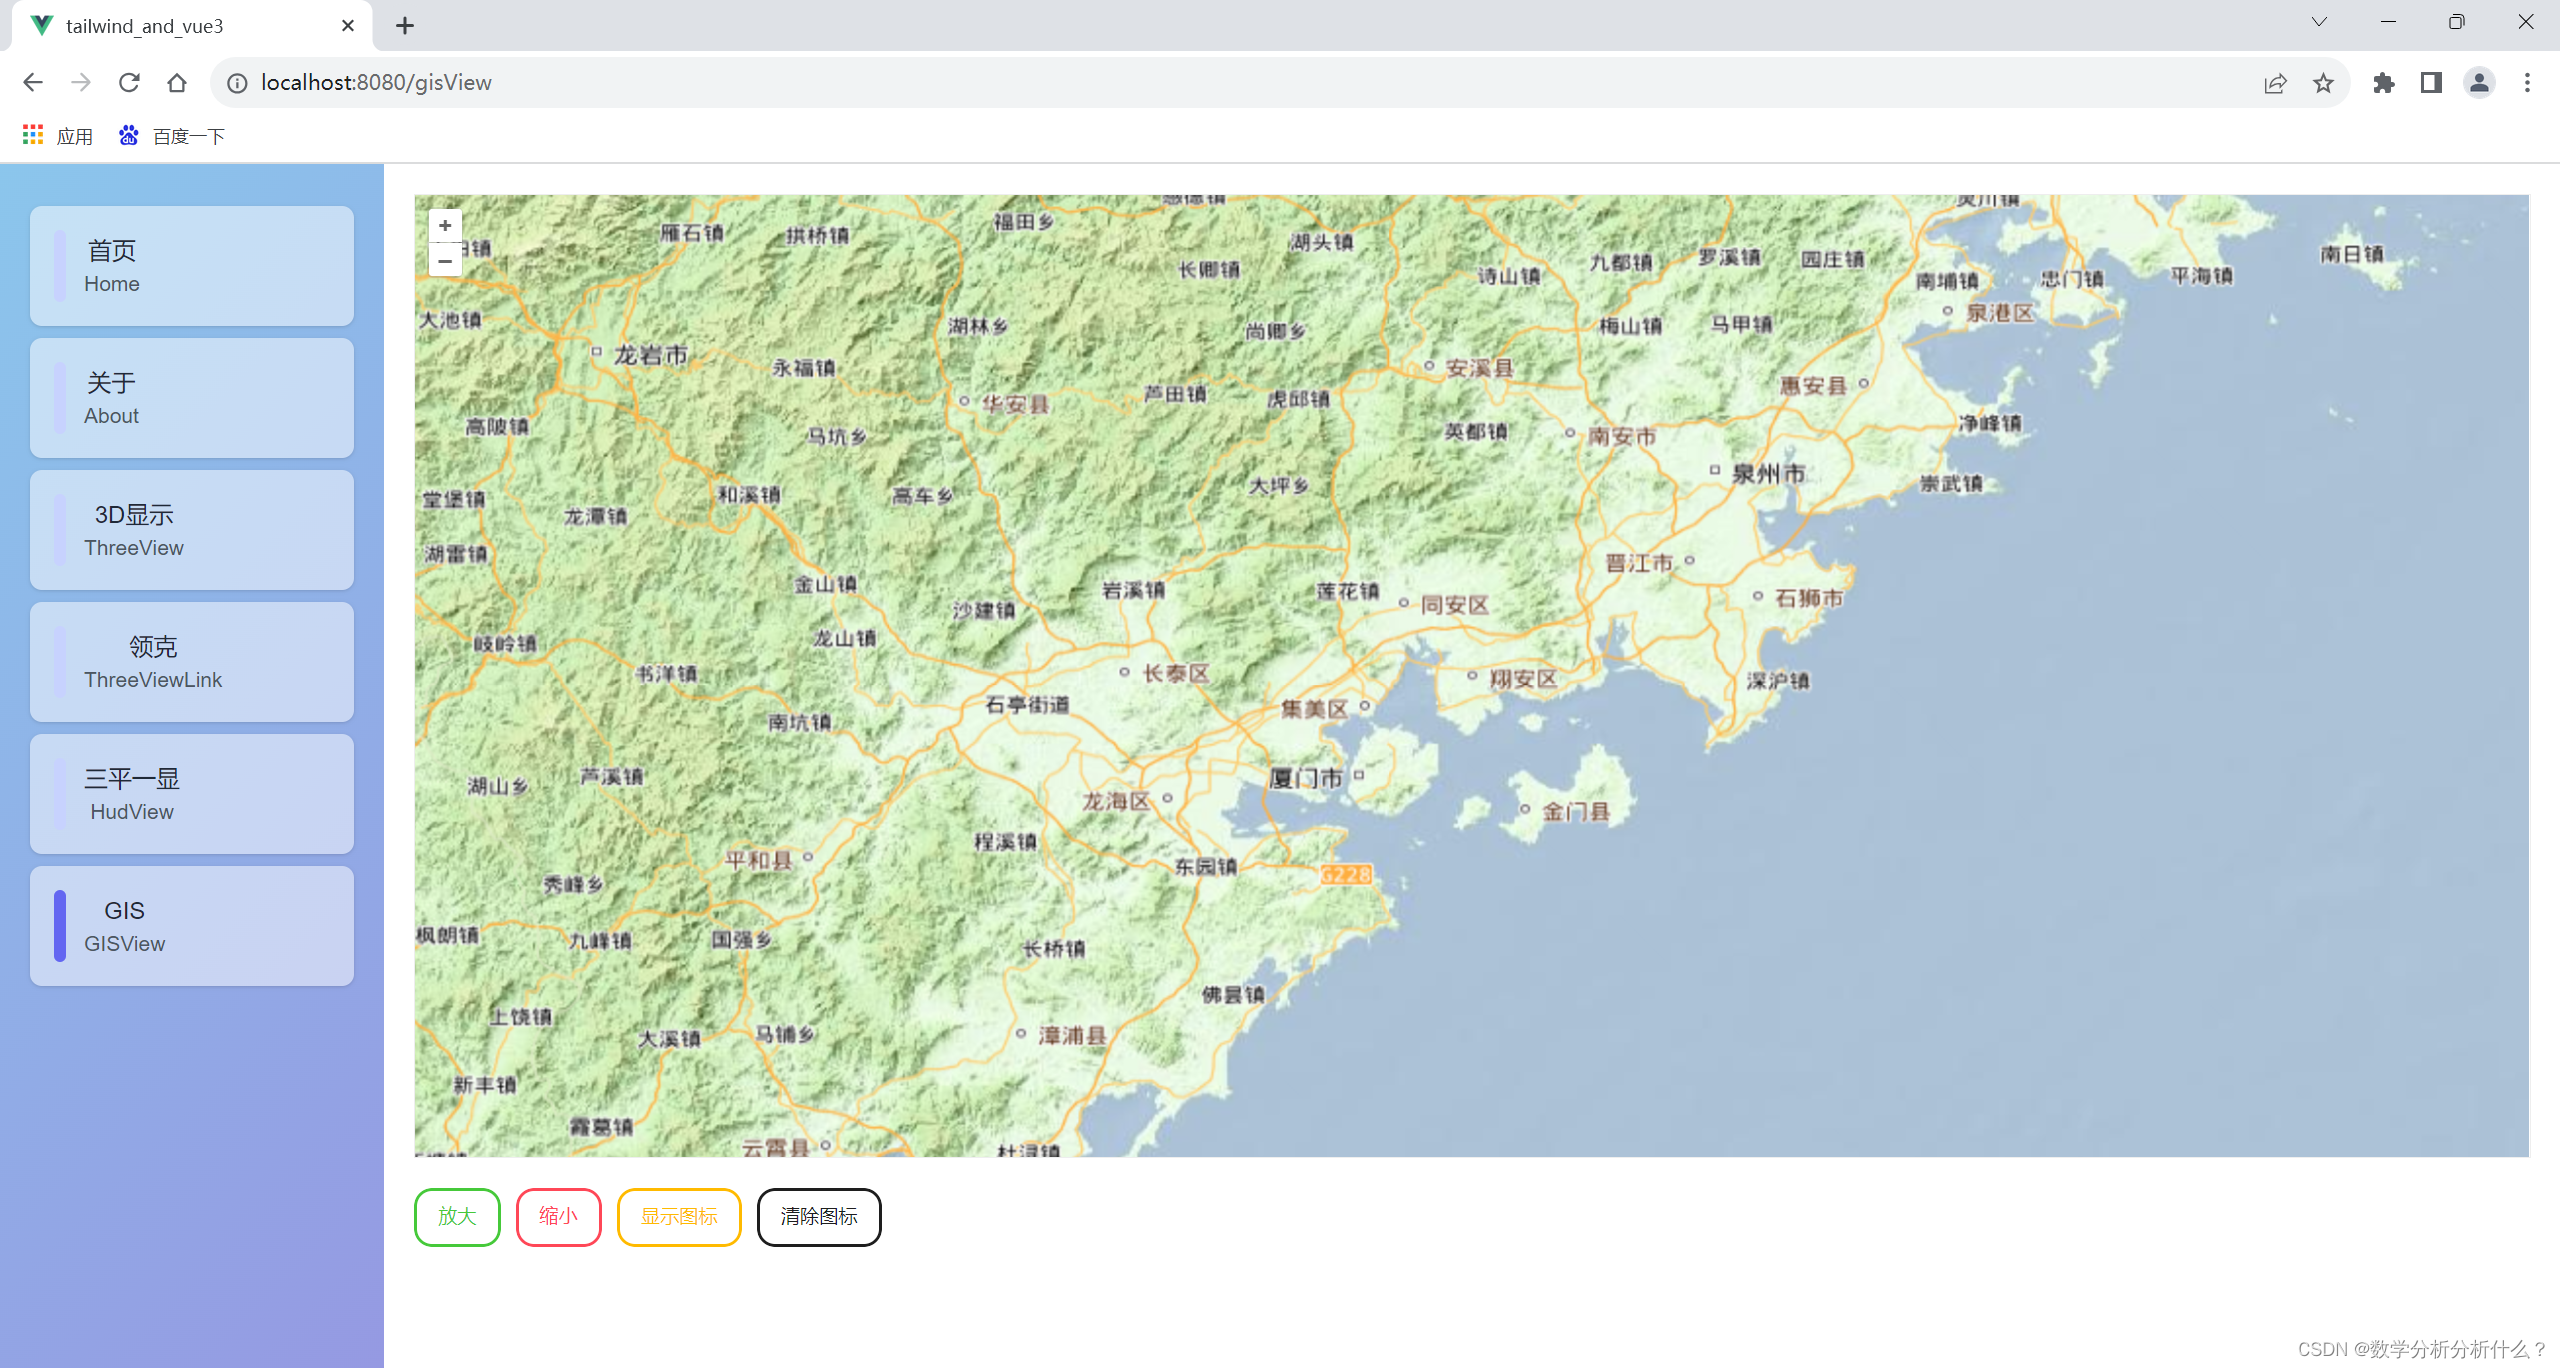
1.1 视图层
- <template>
- <div id="map" class="map_x"> </div>
- </template>
1.2 逻辑层
1.2.1 引入所需对象
- import { Map, View } from 'ol' // 地图实例方法、视图方法
- import Tile from 'ol/layer/Tile' // 瓦片渲染方法
- import XYZ from 'ol/source/XYZ'
1.2.2 初始化地图方法
- const map = ref(null) // 存放地图实例
-
- //*****************************************************
- onMounted(() => {
- initMap()
- })
- /**
- * 初始化地图
- */
- function initMap() {
- // 引入天地图
- let source = new XYZ({
- url: 'http://t4.tianditu.com/DataServer?T=ter_w&tk=************************&x={x}&y={y}&l={z}',
- })
- let tileLayer = new Tile({
- title: '天地图',
- source: source,
- })
- // 标注图层(就是我们所看见的行政区名称,道路)
- let sourceMark = new XYZ({
- url: 'http://t4.tianditu.com/DataServer?T=cta_w&tk=*************************&x={x}&y={y}&l={z}',
- })
- let tileMark = new Tile({
- title: '标注图层',
- source: sourceMark,
- })
- // 地图实例
- map.value = new Map({
- target: 'map', // 对应页面里 id 为 map 的元素
- layers: [tileLayer, tileMark],
- view: new View({
- // 地图视图
- projection: 'EPSG:4326', // 坐标系,有EPSG:4326和EPSG:3857
- center: [118.05, 24.61], // 中心坐标
- zoom: 12, // 地图缩放级别(打开页面时默认级别)
- // minZoom: 10, // 地图缩放最小级别
- maxZoom: 18,
- }),
- })
- }

其中tk=后的参数放入天地图开发者控制台中申请的密钥即可。
1.3 核心要素
XYZ Tile Map View
二、显示图标
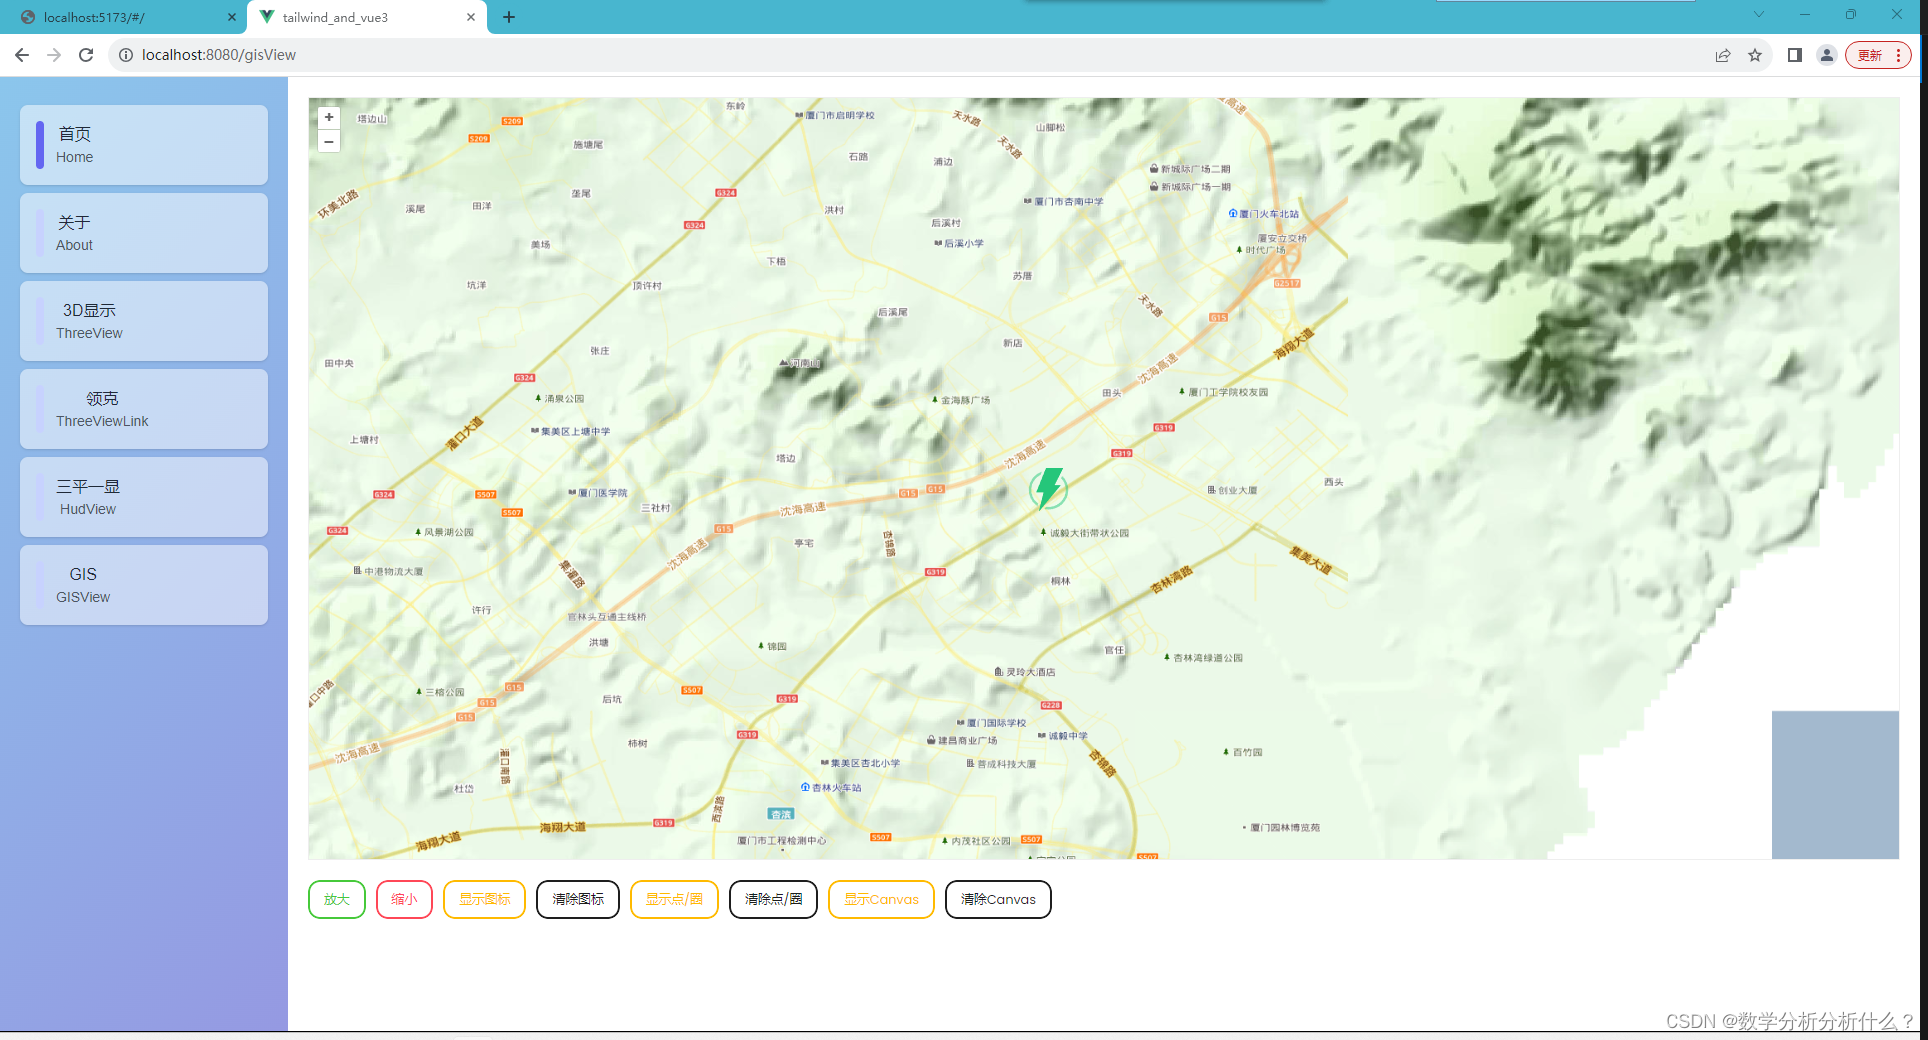
2.1 逻辑层
2.1.1 引入所需对象
- import VectorSource from "ol/source/Vector";
- import { Vector as VectorLayer } from "ol/layer";
- import Feature from "ol/Feature";
- import Style from "ol/style/Style";
- import { Point } from "ol/geom";
- import Icon from "ol/style/Icon";
2.1.2 显示图标方法
- /**
- * 新增图标
- */
- function addIcon() {
- removeIcon();
-
- let vectorSource = new VectorSource();
- iconLayer.value = new VectorLayer({
- source: vectorSource,
- });
-
- // 添加图层
- map.value.addLayer(iconLayer.value);
-
- // 设置图片位置
- iconFeature.value = new Feature({
- geometry: new Point([118.05, 24.61]),
- });
-
- // 设置图标样式与路径
- iconFeature.value.setStyle(
- new Style({
- image: new Icon({
- src: require("@/assets/icon_powerView.svg"),
- anchor: [0.5, 0.5], // 设置图标位置
- }),
- })
- );
-
- // 设置图标与地图缩放同步缩放
- let style = iconFeature.value.getStyle();
- style.getImage().setScale(realZoom.value / 10);
- iconFeature.value.setStyle(style);
-
- // 将图片Feature添加到Source
- iconLayer.value.getSource().addFeature(iconFeature.value);
- }
-
- /**
- * 移除图标
- */
- function removeIcon() {
- if (iconLayer.value) {
- map.value.removeLayer(iconLayer.value);
- iconLayer.value = null;
- }
- }

其中,使用anchor对图标位置进行设置时需要注意:
默认情况下,位置坐标是按照比例的方式来设置的,范围从0到1,x轴上0表示最左边,1表示最右边,y轴上0表示最上边,1表示最下边。 如代码所示,x设置为0.5可以让图片在x方向上居中,y设置为1可以让图片在y方向上移动到最底端。
补充:当设置图标与地图缩放同步缩放时,需要提前触发地图缩放监听,方法如下 :
- /**
- * 监听缩放调整图标大小
- */
- function zoomChange() {
- map.value.getView().on("change:resolution", function (res) {
- let autoZoom = res.target.values_.zoom;
- realZoom.value = autoZoom;
- if (iconFeature.value) {
- let style = iconFeature.value.getStyle();
- style.getImage().setScale(autoZoom / 10);
- iconFeature.value.setStyle(style);
- }
- });
- }
2.2 核心要素
VectorSource VectorLayer Feature Point Style Icon
三、显示几何图形、Cancas图形与图形点击事件
 3.1 逻辑层
3.1.1 引入所需对象
- import { VectorSourceEvent } from "ol/source/Vector";
- import VectorSource from "ol/source/Vector";
- import { Vector as VectorLayer } from "ol/layer";
- import Feature from "ol/Feature";
- import { Point, Circle as CircleGeo } from "ol/geom";
- import Style from "ol/style/Style";
- import Icon from "ol/style/Icon";
- import Fill from "ol/style/Fill";
- import Circle from "ol/style/Circle"; //注意circle引入
- // import { Circle } from 'ol/geom' //错误引入示例 需要注意
3.1.2 显示圆形方法
- /**
- * 画点/圈
- */
- function addPoint() {
- removePoint();
-
- // 画多个圆心示例
- let pointArr = [];
- for (let i = 0; i < 265; i++) {
- let pointF = new Feature({
- geometry: new Point([Number(118.05 + i / 100), Number(24.61 - i / 560)]),
- });
- // 设置特殊类型,以便在点击事件时进行过滤
- pointF.set("type", "circleClick");
- pointArr.push(pointF);
- }
-
- // 画单个圆示例
- // let pointFerture = new Feature({
- // geometry: new Point([118.05, 24.61]),
- // });
-
- let source = new VectorSource({
- features: pointArr, // [pointFerture],//单个圆时注意仍需要传入数组[]
- });
-
- pointLayer.value = new VectorLayer({
- source: source,
- style: new Style({
- image: new Circle({
- radius: 15, //圆半径
- fill: new Fill({
- color: "#765BBD", //圆填充颜色
- }),
- }),
- }),
- });
-
- map.value.addLayer(pointLayer.value);
- }
-
-
- /**
- * 清除点/圈
- */
- function removePoint() {
- if (pointLayer.value) {
- map.value.removeLayer(pointLayer.value);
- pointLayer.value = null;
- }
- }

3.1.3 点击图形事件
该节主要用于展示图形状态可动态变化,具体点击事件与其他事件的使用见 章节四 地图事件。
以点击圆形后改变大小与颜色为例:
- /**
- * 监听地图点击事件
- */
- function changePoint() {
- map.value.on("click", function (event) {
- let feature = map.value.forEachFeatureAtPixel(
- event.pixel,
- function (feature) {
- return feature;
- }
- );
- if (feature) {
- let json = feature.getStyle();
- let type = feature.get("type");
- let color = null;
- console.log("监听事件", json);
- // 过滤特殊类型
- if (type == "circleClick") {
- try {
- color = json.image_.fill_.color_;
- } catch {}
- } else {
- return false;
- }}
- // let color = feature.style_.image_.fill_.color_;
- // 点击后将切换⚪颜色
- feature.setStyle(
- new Style({
- image: new Circle({
- radius: color == "#FFF000" ? 15 : 20, //圆半径
- fill: new Fill({
- color: color == "#FFF000" ? "#765BBD" : "#FFF000", //圆填充颜色
- }),
- }),
- })
- );
- }
- });
- }

3.1.4 显示Canvas图形方法
- /**
- * 新增canvas图标
- */
- function addCanvas() {
- removeCanvas();
-
- let vectorSource = new VectorSource();
- canvasLayer.value = new VectorLayer({
- source: vectorSource,
- });
-
- // 使用canvas绘制一个不规则几何图形
- var canvas = document.createElement("canvas");
- canvas.width = 20;
- canvas.height = 20;
- var context = canvas.getContext("2d");
- context.strokeStyle = "red";
- context.lineWidth = 1;
- context.beginPath();
- context.moveTo(0, 0);
- context.lineTo(20, 10);
- context.lineTo(0, 20);
- context.lineTo(10, 10);
- context.lineTo(0, 0);
- context.fill();
-
- // 把绘制了的canvas设置到style里面
- canvasLayer.value.setStyle(
- new Style({
- image: new Icon({
- img: canvas,
- imageSize: [canvas.width, canvas.height],
- rotation: (90 * Math.PI) / 180,
- }),
- })
- );
-
- let shape = new Feature({
- geometry: new Point([118.05, 24.61]),
- });
- canvasLayer.value.getSource().addFeature(shape);
-
- map.value.addLayer(canvasLayer.value);
- }
-
- /**
- * 清楚canvas图标
- */
- function removeCanvas() {
- if (canvasLayer.value) {
- map.value.removeLayer(canvasLayer.value);
- canvasLayer.value = null;
- }
- }

3.1.5 显示多类型图形方法
- /**
- * 显示多类型图形
- */
- function addMultiType() {
- removeMultiType();
- let source = new VectorSource();
- multiTypeLayer.value = new VectorLayer({
- source: source,
- style: layerStyle,
- });
-
- let rect = new Feature({
- geometry: new Point([118.15, 24.61]),
- });
- multiTypeLayer.value.getSource().addFeature(rect);
-
- let circle = new Feature({
- geometry: new Point([118.25, 24.61]),
- });
- circle.set("type", "circle");
- multiTypeLayer.value.getSource().addFeature(circle);
-
- let point = new Feature({
- geometry: new Point([118.35, 24.61]),
- });
- point.set("type", "point");
- multiTypeLayer.value.getSource().addFeature(point);
- map.value.addLayer(multiTypeLayer.value);
- }
-
- /**
- * 清除多类型图形
- */
- function removeMultiType() {
- if (multiTypeLayer.value) {
- map.value.removeLayer(multiTypeLayer.value);
- multiTypeLayer.value = null;
- }
- }
-
- /**
- * 创建不同形状
- * @param {*} feature
- * @param {*} resolution
- */
- function layerStyle(feature, resolution) {
- let type = feature.get("type");
- console.log("接收类型参数", feature, type);
- let style = null;
-
- if (type === "point") {
- style = new Style({
- image: new Circle({
- radius: 20,
- fill: new Fill({
- color: "red",
- }),
- }),
- });
- } else if (type === "circle") {
- style = new Style({
- image: new Circle({
- radius: 20,
- stroke: new Stroke({
- color: "red",
- size: 1,
- }),
- }),
- });
- } else {
- style = new Style({
- image: new RegularShape({
- points: 5,
- radius: 20,
- fill: new Fill({
- color: "blue",
- }),
- }),
- });
- }
- return [style];
- }

3.2 核心要素
VectorSource VectorLayer Feature Point Style Icon Fill Circle
四、常用地图事件
4.1 点击事件
4.1.1 事件
click 点击
singleclick 单击
dblclick 双击
注意:单击事件singleclick与双击事件dblclick均会先触发点击事件click。
4.1.2 示例
- function changeClick() {
- map.value.on("click", function (event) {
- console.log('click事件');
- })
- }
由于使用单击事件singleclick或双击事件dblclick均会先触发click事件,因此在同一页面存在多个点击事件时,尽量不使用click事件以免事件混淆。
4.2 地图渲染、移动事件
4.2.1事件
precompose 准备渲染
postcompose 开始渲染
postrender 完成渲染
moveend 地图移动结束
注意: 移动地图、缩放层级均会触发moveend事件,可使用map.getView().calculateExtent(map.getSize());获取屏幕左右对角坐标。
4.2.2 示例
- function changeMap(){
- map.value.on('precompose', function (event) {
- console.log('准备渲染');
- });
- }
- function changeMoveMap() {
- map.value.on('moveend', function (event) {
- // 获取当前屏幕范围坐标
- let extent = map.value.getView().calculateExtent(map.value.getSize());
- let xmin = extent[0];//左下角x
- let ymin = extent[1];//左下角y
- let xmax = extent[2];//右上角x
- let ymax = extent[3];//右上角y
- // 若需要使用相关经纬度则需要对上述坐标进行转化
- })
- }
4.3 鼠标事件
4.3.1 事件
pointermove 鼠标移动
pointerdrag 鼠标拖拽
4.3.2 示例
- function changePointer(){
- map.value.on('pointermove', function (event) {
- console.log('鼠标移动');
- });
- }
4.4 属性事件
4.4.1 事件
change:size 尺寸变更
change:view 视图变更
change:target 地图容器变更
propertychange 属性变更
注意:
1.地图首次加载就会触发change:size和propertychange事件;
2.change:size、change:target、change:view都会触发propertychange事件。
4.4.2 示例
- function changeMap(){
- // change:size事件
- map.value.on('change:size', function (event) {
- console.log('size事件');
- });
-
- // change:view事件
- map.value.on('change:view', function (event) {
- console.log('view事件');
- });
-
- // change:target事件
- map.value.on('change:target', function (event) {
- console.log('target事件');
- });
-
- // propertychange事件
- map.value.on('propertychange', function (event) {
- console.log('property事件');
- });
- }
-
- /*****************触发上述监听之事件*****************/
-
- // 更改Div
- function changeSize() {
- console.log('-----------');
- let div = document.getElementById('map');
- div.style.width = '250px';
- map.value.updateSize();
- }
-
- // 更改Target
- function changeTarget() {
- map.value.setTarget('map1');
- }
-
- // 更改View
- function changeView() {
- let view = new ol.View({
- projection: 'EPSG:4326',
- center: [118.05, 24.61],
- zoom: 5
- });
- map.value.setView(view);
- }

4.5 销毁监听事件
4.5.1 销毁方法
un( )
unBykey( )
4.5.2 示例
- /**
- * 监听双击事件
- */
- function clickChange() {
- // 双击事件方法
- dblclickFun.value = function (evt) {
- console.log("点击事件", evt);
- };
- // 开启双击事件监听
- map.value.on("dblclick", dblclickFun.value);
- }
-
- /**
- * 取消监听双击事件
- */
- function cancelDblclick() {
- map.value.un("dblclick", dblclickFun.value);
- }

- // 需要先引入unByKey方法
- import { unByKey } from "ol/Observable";
-
- /**
- * 监听双击事件
- */
- function clickChange() {
- // 双击事件方法
- dblclickFun.value = function (evt) {
- console.log("点击事件", evt);
- };
- // 开启方法监听
- dblclickListener.value = map.value.on("dblclick", dblclickFun.value);
- }
-
- /**
- * 取消监听双击事件
- */
- function cancelDblclick() {
- unByKey(dblclickListener.value);
- }

注意:
若仅需要触发一次事件,则可以使用 map.value.once("dblclick", dblclickFun.value);替换原来map.value.on("dblclick", dblclickFun.value);的开启监听方法,使用once函数,只会响应一次事件,之后自动注销事件监听。
五、信息弹窗
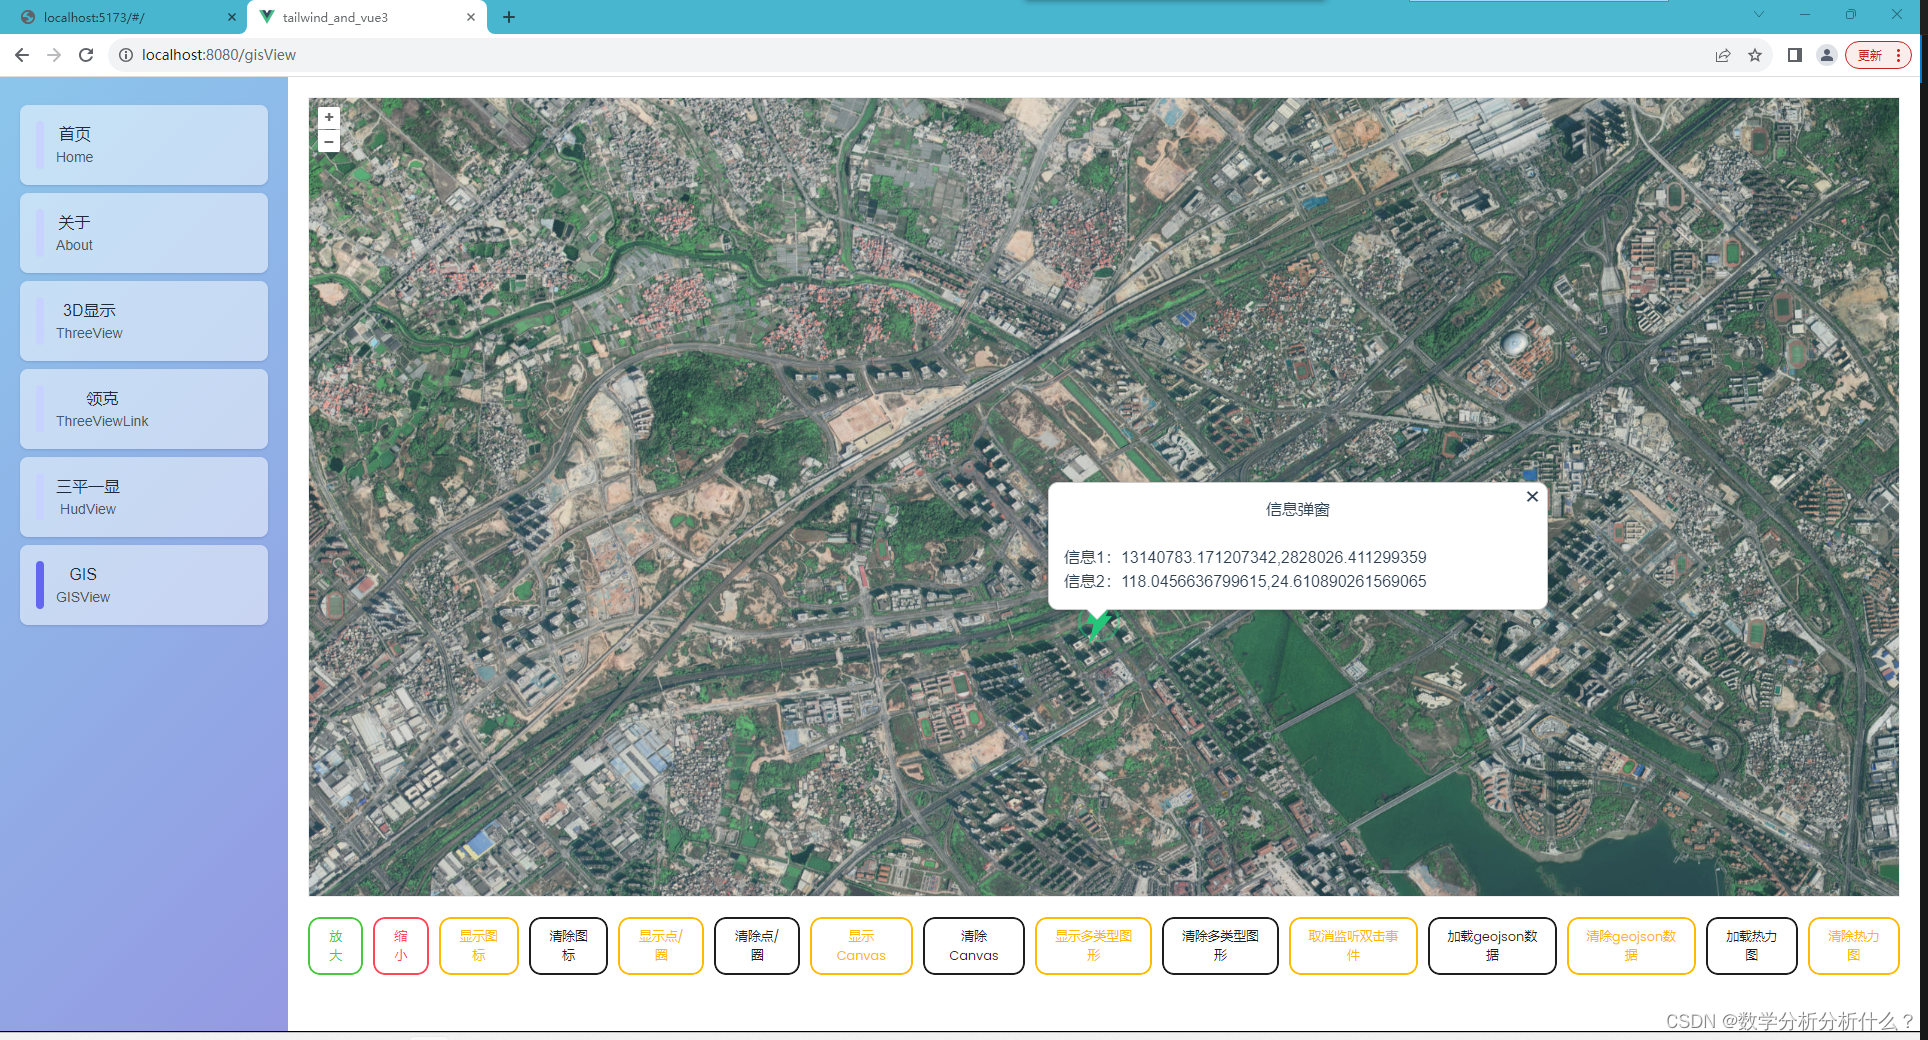
5.1 视图层
- <template>
- <div
- id="map"
- class="map_x"
- ></div>
-
- <!-- 信息弹窗 -->
- <div
- id="popup"
- class="ol-popup"
- v-show="clickCoordinate!=null"
- >
- <a
- href="#"
- id="popup-closer"
- class="ol-popup-closer"
- @click="removePopup"
- />
- <div id="popup-content" />
- </div>
- </template>
-
- <style>
- .ol-popup {
- position: absolute;
- background-color: white;
- box-shadow: 0 1px 4px rgba(0, 0, 0, 0.2);
- padding: 15px;
- border-radius: 10px;
- border: 1px solid #cccccc;
- bottom: 12px;
- left: -50px;
- min-width: 500px;
- }
- .ol-popup:after,
- .ol-popup:before {
- top: 100%;
- border: solid transparent;
- content: " ";
- height: 0;
- width: 0;
- position: absolute;
- pointer-events: none;
- }
- .ol-popup:after {
- border-top-color: white;
- border-width: 10px;
- left: 48px;
- margin-left: -10px;
- }
- .ol-popup:before {
- border-top-color: #cccccc;
- border-width: 11px;
- left: 48px;
- margin-left: -11px;
- }
- .ol-popup-closer {
- text-decoration: none;
- position: absolute;
- top: 2px;
- right: 8px;
- }
- .ol-popup-closer:after {
- content: "✖";
- }
- <style>

5.2 逻辑层
5.2.1 引入所需对象
- import Overlay from "ol/Overlay";
- import { transform } from "ol/proj";
5.2.2 双击地图显示信息窗方法
- /**
- * 创建弹出窗层
- * @param {*} ctn
- */
- function addPopup() {
- removePopup();
- let container = document.getElementById("popup");
- let content = document.getElementById("popup-content");
- if (overLayer.value === null) {
- overLayer.value = new Overlay({
- element: container,
- autoPan: true,
- autoPanAnimation: {
- duration: 250,
- },
- });
- map.value.addOverlay(overLayer.value);
- console.log("创建图层对象");
- }
- clickChange(content);
- }
-
- /**
- * 监听双击事件
- */
- function clickChange(content) {
- clickCoordinate.value = null;
- // 双击事件方法
- dblclickFun.value = function (evt) {
- // console.log("点击事件", evt);
- let coordinate = evt.coordinate;
- clickCoordinate.value = coordinate;
- let coordinateT = transform(coordinate, "EPSG:4326", "EPSG:3857");
- content.innerHTML = `
- <h3>信息弹窗</h3>
- <br/>
- <table>
- <tr>
- <th>信息1:</th>
- <td>${coordinateT}</td>
- </tr>
- <tr>
- <th>信息2:</th>
- <td>${coordinate}</td>
- </tr>
- </table>
- `;
- overLayer.value.setPosition(coordinate);
- };
- // 开启方法监听
- dblclickListener.value = map.value.on("dblclick", dblclickFun.value);
- }
-
- /**
- * 取消监听双击事件
- */
- function cancelDblclick() {
- // map.value.un("dblclick", dblclickFun.value);
- unByKey(dblclickListener.value);
- console.log("取消监听双击事件");
- }
-
- /**
- * 清除弹出层
- */
- function removePopup() {
- if (overLayer.value) {
- overLayer.value.setPosition(undefined);
- }
- }

5.3 核心要素
Overlay
六 、GeoJson行政区域边界显示
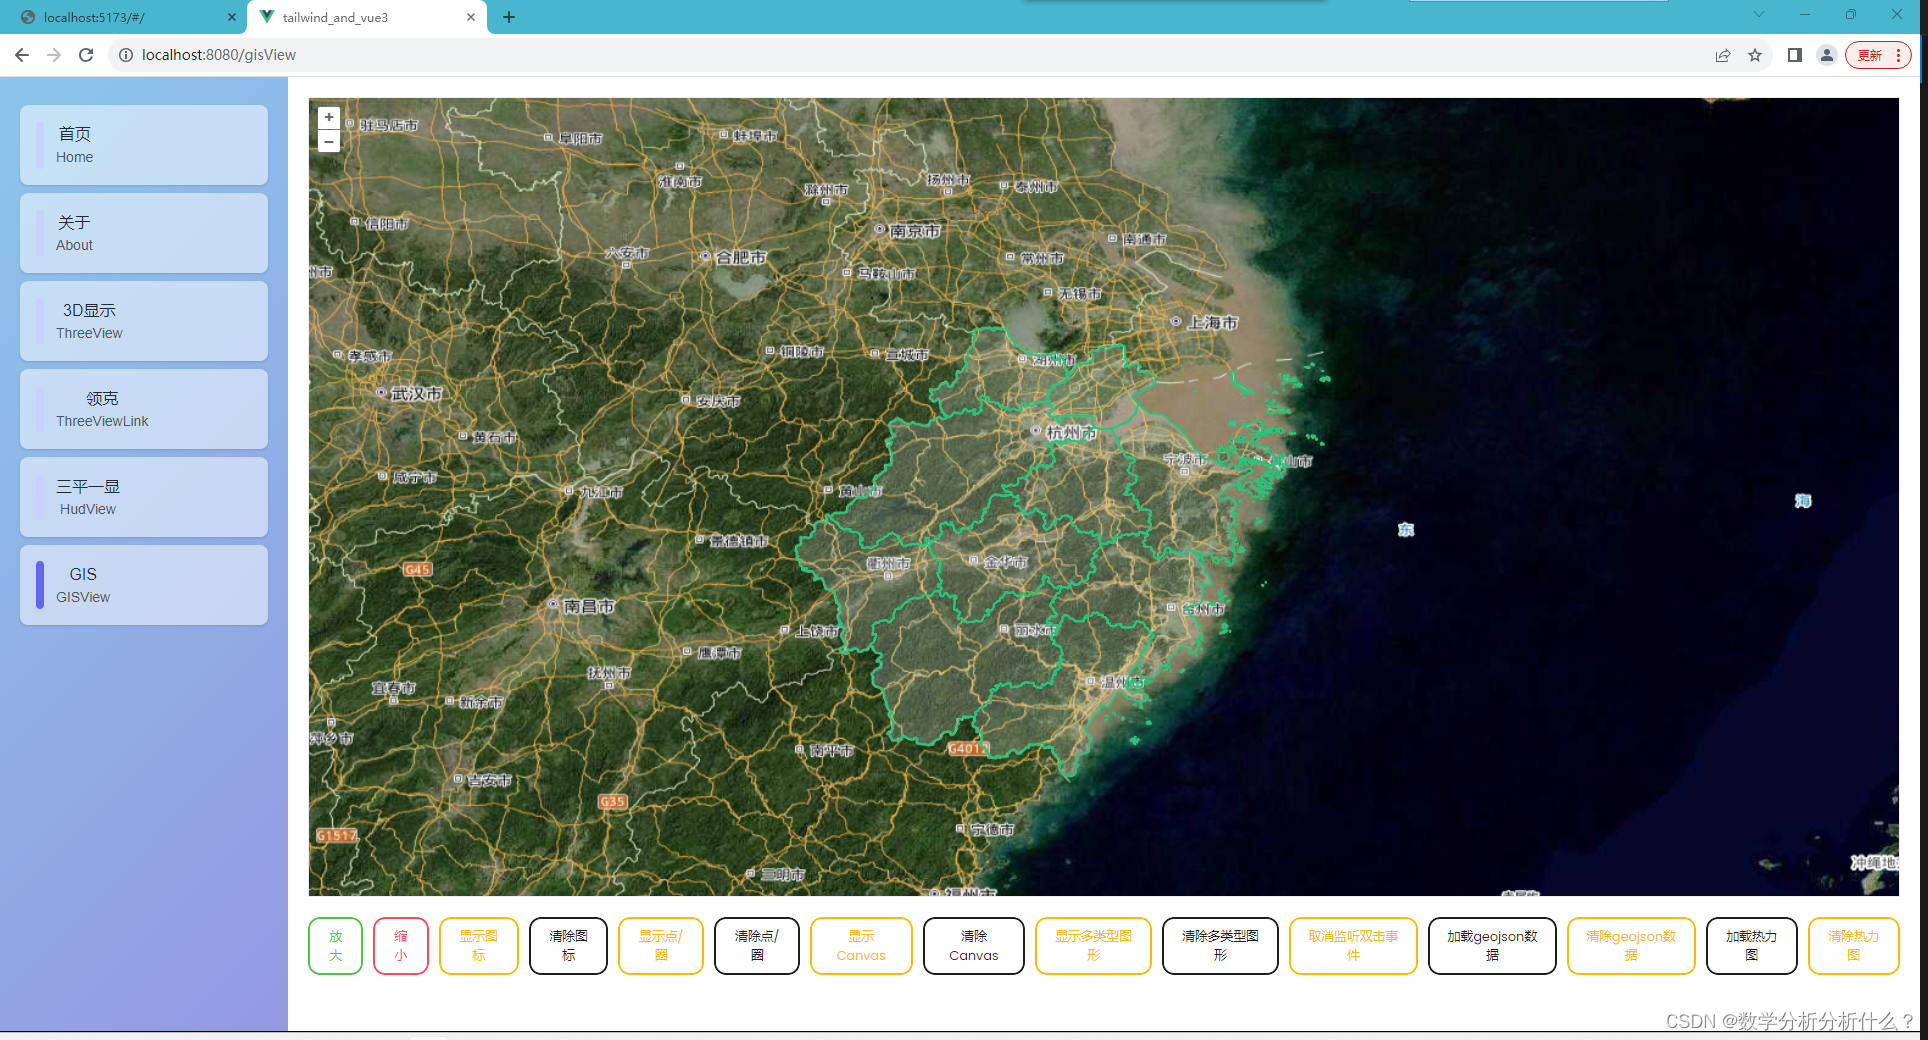
6.1 逻辑层
6.1.1 引入所需对象
- import GeoJSON from "ol/format/GeoJSON";
- import { GEOJSON_CONST } from "@/assets/geojson/zhejian.js";
注意:其中zhejian.js文件中,抛出GEOJSON_CONST方法返回geojson数据即可,在本地运行时直接读取json文件可能产生跨域问题。
6.1.2 显示GeoJSon数据方法
- /**
- * 加载geojson数据
- */
- function addGeojson() {
- clearGeojson();
- let geojson = GEOJSON_CONST();
- // 载入数据
- let source = new VectorSource({
- features: new GeoJSON().readFeatures(geojson),
- });
-
- geojsonLayer.value = new VectorLayer({
- source: source,
- style: new Style({
- // 数据边界颜色与描边宽度
- stroke: new Stroke({
- color: "#25C67A",
- width: 2,
- }),
- // 内部填充色
- fill: new Fill({
- color: "rgba(255,255,255,0.2)",
- }),
- }),
- });
-
- map.value.addLayer(geojsonLayer.value);
- }
-
- /**
- * 清除geojson数据
- */
- function clearGeojson() {
- if (geojsonLayer.value) {
- map.value.removeLayer(geojsonLayer.value);
- geojsonLayer.value = null;
- }
- }

6.2 核心要素
GeoJSON VectorSource VectorLayer Style Stroke Fill
七、加热力图
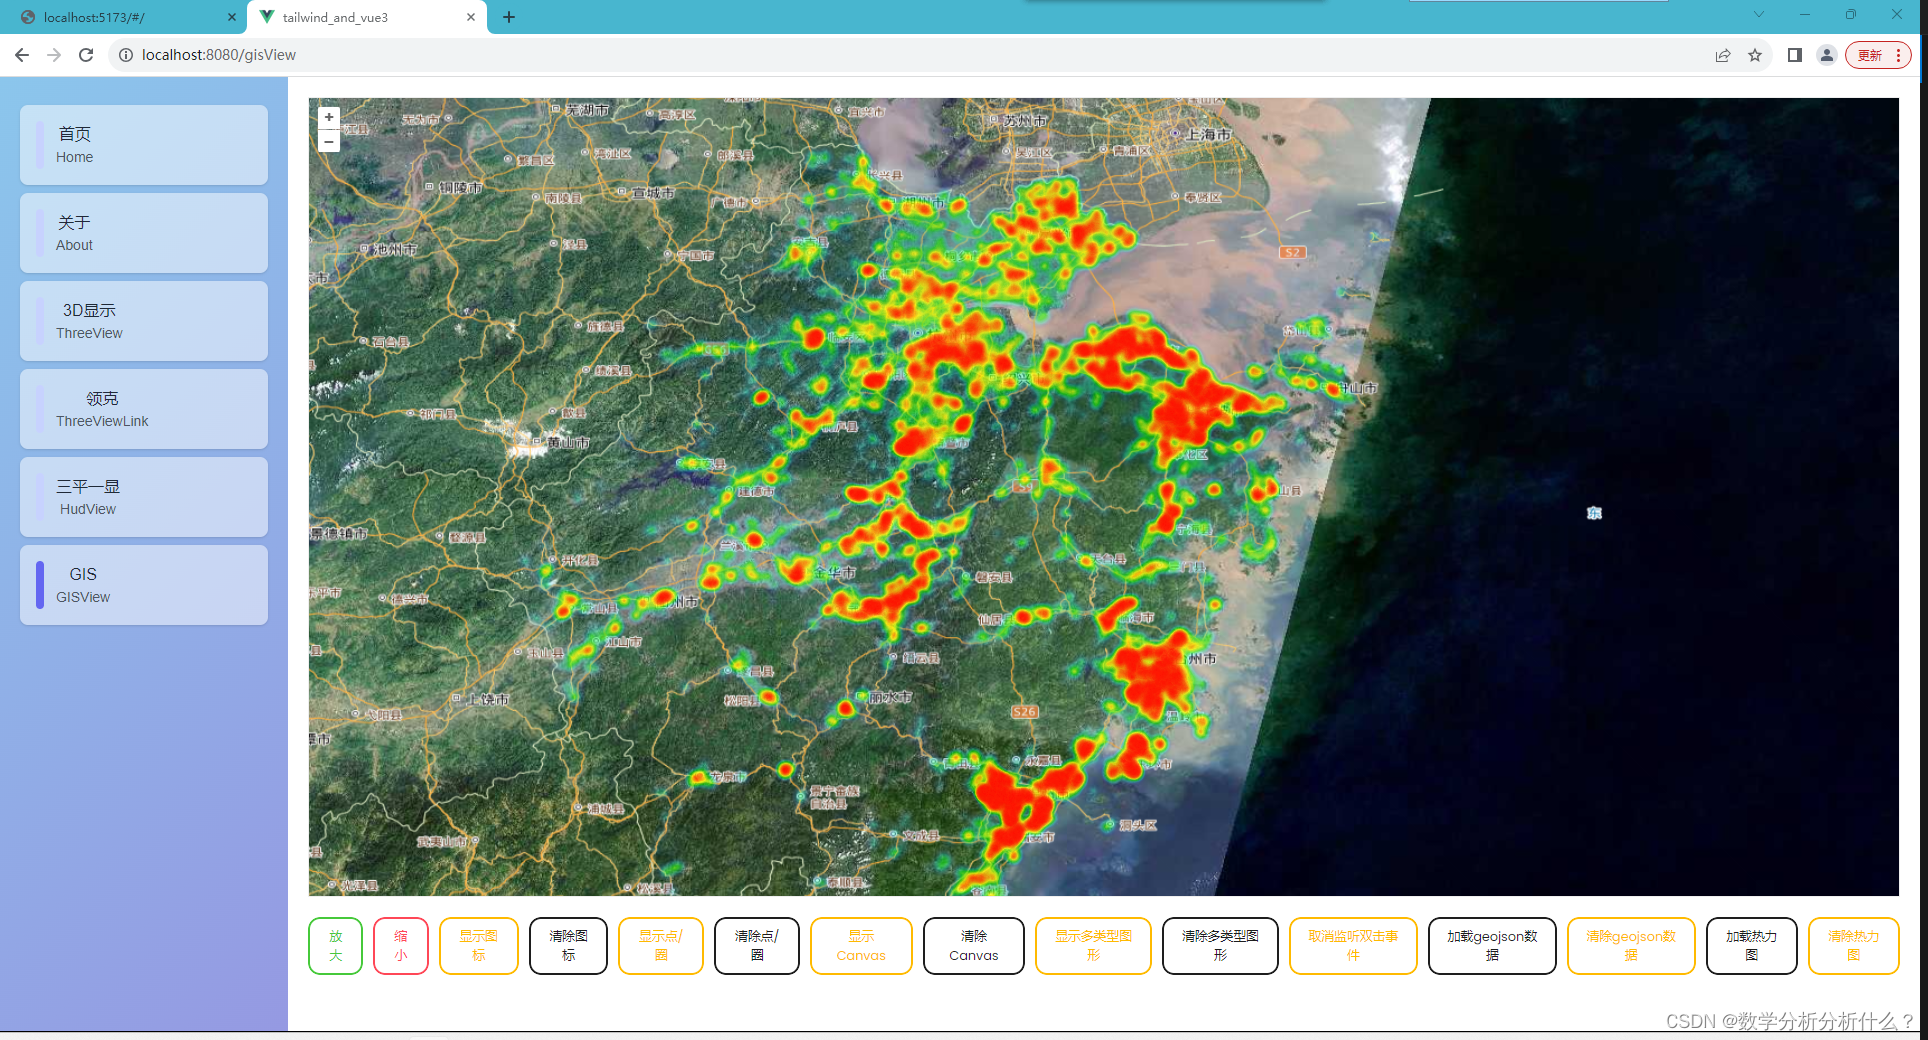
7.1 逻辑层
7.1.1 引入所需对象
- import { Heatmap } from "ol/layer";
- import QYWZ from "@/assets/geojson/qywz.json";//热力图数据
-
- //热力图数据部分示例
- /*{"type":"FeatureCollection", "features": [
- *{"type":"Feature","geometry":{"type":"Point","coordinates":
- * [121.57605318350262,29.84480421358972]},"properties":{"OBJECTID":1}},]}
- */
7.1.2 显示热力图方法
- /**
- * 加载热力图数据
- */
- function addHotmap() {
- clearHotmap();
- let source = new VectorSource({
- features: new GeoJSON().readFeatures(QYWZ),
- });
-
- hotmapLayer.value = new Heatmap({
- source: source,
- blur: 10, //模糊程度
- radius: 2,
- });
- map.value.addLayer(hotmapLayer.value);
- }
-
- /**
- * 清除热力图
- */
- function clearHotmap() {
- if (hotmapLayer.value) {
- map.value.removeLayer(hotmapLayer.value);
- hotmapLayer.value = null;
- }
- }

注意:该部分未完善,重点在于热力图数据的生成,后续完善
7.2 核心要素
Heatmap GeoJSON VectorSource
参考链接
[1].WangConvey文章 WangConvey_开发常见问题,openlayers学习之路-CSDN博客;
[2].OpenLayers 3指南 OpenLayers 3 介绍 | OpenLayers 3 Primer;
[3].OplenLayers中文文档 OpenLayers Examples;
[4].OplenLayers文档 OpenLayers - Welcome。


