
热门标签
热门文章
- 1【求助贴】临危受命,如何救火做到一半的项目?
- 2聊一聊,嵌入式那些事?
- 3【LSTM回归预测】基于开普勒算法优化多头注意力机制的卷积神经网络结合长短记忆神经网络实现温度预测KOA-CNN-LSTM-Multihead-Attention附matlab代码_罗顺桦
- 4linux编译2020uboot,移植uboot[2020.10.r4]--Apple的学习笔记
- 5软件测试-为什么我们的自动化测试做不起来?_自动化测试中录制脚步轻松搞定,为何没有成为功能测试
- 6yarn的安装与配置(基础技能篇)
- 7新型开发语言的试用感受-仓颉语言发布之际_仓颉跟golang很像
- 8【Rust光年纪】Rust 中常用的数据库客户端库:核心功能与使用场景
- 9大数据数仓基础知识学习笔记【1】_通过数据库只读账号抽取数据是否有风险
- 10OneFox系列之配置_onefox集成工具箱
当前位置: article > 正文
数据分析实战
作者:木道寻08 | 2024-07-12 10:12:12
赞
踩
数据分析实战
数据分析项目实战
1. 背景
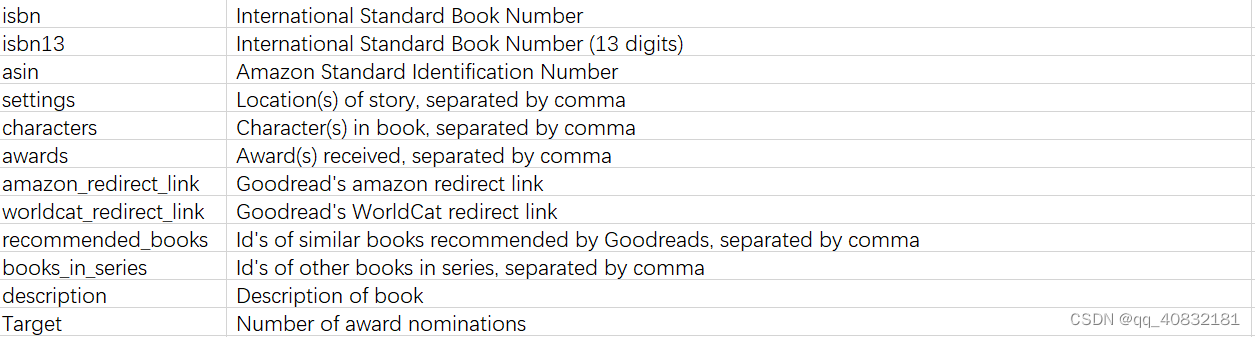
数据集包括从Goodreads收集的书籍信息。所有的书都来自Goodreads中的 "史上最佳书籍 "列表。任务就是预测该书是否赢得/被提名为奖项。
1.1 字段描述

2. 数据分析
2.1 数据清洗
标准化在划分训练集,测试集之后进行
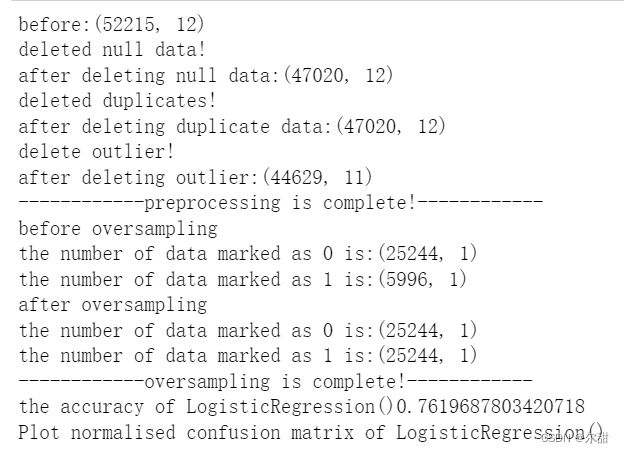
def preprocessing(df):

    print('before:'+str(df.shape))
    #source: https://errorsea.com/how-to-convert-string-to-integer-in-python-str-to-int/
    #change this column into string for spliting year
    df['date_published']=df['date_published'].apply(lambda x: str(x))
    #https://www.tutorialspoint.com/How-can-I-get-last-4-characters-of-a-string-in-Python
    #extract the last four characters to get the year value
    df['year_published']=df['date_published'].apply(lambda x: x[-4:])

    #source: https://stackoverflow.com/questions/39694192/convert-string-column-to-integer
    #make sure this column is the year
    df['year_published'] = np.where(df.year_published.str.contains('[a-z]') == True, np.nan, df.year_published)
    # source: https://stackoverflow.com/questions/39694192/convert-string-column-to-integer
    # delete the extra column
    df=df.drop(['date_published'],axis=1)
    # delete null data
    if df.isnull().sum().sum()>0:
        df=df.dropna()
        print('deleted null data!')
        print('after deleting null data:'+str(df.shape))
    else:
        print('No missing data')


    #delete duplicate data
    df = df.drop_duplicates()
    print('deleted duplicates!')
    print('after deleting duplicate data:'+str(df.shape))
    # change this column from string into int avoiding error in the ' delete outlier' step
    df['year_published']=df['year_published'].apply(lambda x: int(x))
    df=df.drop(['id'],axis=1)
    #delete outlier
    # using Z score delete outlier
    # source: Sharma, N., 2018. Ways to Detect and Remove the Outliers. [online] towardsdatascience.com. Available at: <https://towardsdatascience.com/ways-to-detect-and-remove-the-outliers-404d16608dba> [Accessed 11 April 2021].
    z = np.abs(stats.zscore(df))
    # In most of the cases a threshold of 3 or -3 is used
    df = df [(z <3).all(axis = 1)]
    print('delete outlier!')
    print('after deleting outlier:'+str(df.shape))
   #seperate features and label
    df_x=df.drop(['Target'],axis=1)
    y=df['Target']
    #change value greater than 1 into 1
    y=np.int64(y>0)
    y=pd.DataFrame(y, columns=['target'])
    print('------------preprocessing is complete!------------')
    return df_x, y

#Standardisation
def Standardisation(df_x):
    x=StandardScaler().fit_transform(df_x)

    #Extracted column names
    features=df_x.columns.values.tolist()
    df_x=pd.DataFrame(data = x, columns = features)
    print('------------Standardisation is complete!------------')
    return df_x

- 1
- 2
- 3
- 4
- 5
- 6
- 7
- 8
- 9
- 10
- 11
- 12
- 13
- 14
- 15
- 16
- 17
- 18
- 19
- 20
- 21
- 22
- 23
- 24
- 25
- 26
- 27
- 28
- 29
- 30
- 31
- 32
- 33
- 34
- 35
- 36
- 37
- 38
- 39
- 40
- 41
- 42
- 43
- 44
- 45
- 46
- 47
- 48
- 49
- 50
- 51
- 52
- 53
- 54
- 55
- 56
- 57
- 58
运行
2.2 封装的一些函数
2.2.1 重采样
因为数据类别不平衡,所以对训练集进行SMOTE重采样,但是这也就导致一个问题,噪音增多了,准确率降低了。要有取舍
注意:重采样只在训练集上重采样
#oversampling
def smo(df_x,y, columns):
    #source https://www.kite.com/blog/python/smote-python-imbalanced-learn-for-oversampling/
    print('before oversampling')
    print('the number of data marked as 0 is:'+str(y[y['target']<1].shape))
    print('the number of data marked as 1 is:'+str(y[y['target']==1].shape))
    #because the data is imbalanced, so the SMOTE method is used to get more sample
    smo = SMOTE()
    df_x_res, y_res = smo.fit_resample(df_x, y)
    #merging features and y
    df_res = pd.concat([pd.DataFrame(df_x_res), pd.DataFrame(y_res)], axis=1)
    #Extracted column names
    df_res.columns = columns
    print('after oversampling')
    print('the number of data marked as 0 is:'+str(y_res[y_res['target']<1].shape))
    print('the number of data marked as 1 is:'+str(y_res[y_res['target']==1].shape))
    print('------------oversampling is complete!------------')
    return df_res, df_x_res, y_res
- 1
- 2
- 3
- 4
- 5
- 6
- 7
- 8
- 9
- 10
- 11
- 12
- 13
- 14
- 15
- 16
- 17
- 18
- 19
运行
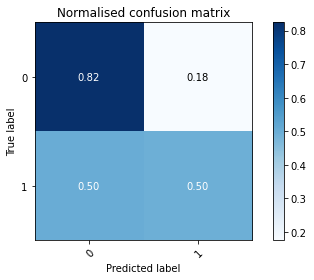
2.2.2 混淆矩阵
from sklearn.metrics import confusion_matrix
import numpy as np
import matplotlib.pyplot as plt
from sklearn.utils.multiclass import unique_labels
%matplotlib inline

np.set_printoptions(precision=2)

def plot_confusion_matrix(y_true, y_pred, classes,
                          normalise=False,
                          title=None,
                          cmap=plt.cm.Blues,
                          multi=False):
    """
    This function prints and plots the confusion matrix.
    Normalization can be applied by setting `normalise=True`.
    """
    if not title:
        if normalise:
            title = 'Normalised confusion matrix'
        else:
            title = 'Confusion matrix, without normalisation'

    # Compute confusion matrix
    cm = confusion_matrix(y_true, y_pred)

    # Only use the labels that appear in the data
    if multi==True:
    	classes = classes[unique_labels(y_true, y_pred)]
    if normalise:
        cm = cm.astype('float') / cm.sum(axis=1)[:, np.newaxis]

    fig, ax = plt.subplots()
    im = ax.imshow(cm, interpolation='nearest', cmap=cmap)
    ax.figure.colorbar(im, ax=ax)
    # We want to show all ticks...
    ax.set(xticks=np.arange(cm.shape[1]),
           yticks=np.arange(cm.shape[0]),
           # ... and label them with the respective list entries
           xticklabels=classes, yticklabels=classes,
           title=title,
           ylabel='True label',
           xlabel='Predicted label')

    # Rotate the tick labels and set their alignment.
    plt.setp(ax.get_xticklabels(), rotation=45, ha="right",
             rotation_mode="anchor");

    fmt = '.2f' if normalise else 'd'
    thresh = cm.max() / 2
    for i in range(cm.shape[0]):
        for j in range(cm.shape[1]):
            ax.text(j, i, format(cm[i, j], fmt),
                    ha="center", va="center",
                    color="white" if cm[i, j] > thresh else "black")
    fig.tight_layout()

    return ax
- 1
- 2
- 3
- 4
- 5
- 6
- 7
- 8
- 9
- 10
- 11
- 12
- 13
- 14
- 15
- 16
- 17
- 18
- 19
- 20
- 21
- 22
- 23
- 24
- 25
- 26
- 27
- 28
- 29
- 30
- 31
- 32
- 33
- 34
- 35
- 36
- 37
- 38
- 39
- 40
- 41
- 42
- 43
- 44
- 45
- 46
- 47
- 48
- 49
- 50
- 51
- 52
- 53
- 54
- 55
- 56
- 57
- 58
2.3 模型选择
def evaluate(model,x_test,y_test):
"""
this function is to evaluate candidate models
"""
y_pred=model.predict(x_test)
predicted = model.predict(x_test)
accuracy = model.score(x_test, y_test)
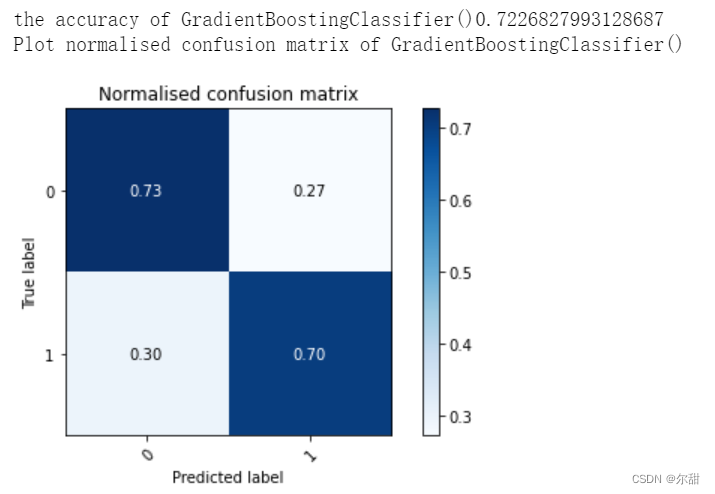
print('the accuracy of '+str(model)+str(accuracy))
# Plot non-normalised confusion matrix
#plot_confusion_matrix(y_test, predicted, classes=["0", "1"])
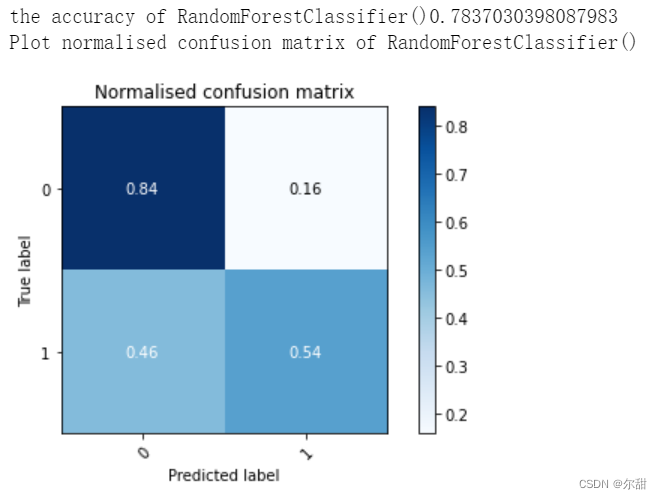
print('Plot normalised confusion matrix of '+str(model))
plot_confusion_matrix(y_test, predicted, classes=["0", "1"], normalise=True)
#print('Accuracy of the'+str(model)+' on test set:
- 1
- 2
- 3
- 4
- 5
- 6
- 7
- 8
- 9
- 10
- 11
- 12
- 13
- 14
- 15
运行
2.4 模型结果
df=pd.read_csv('goodreads.csv',encoding='iso-8859-1')
df=df[['id','rating_count','review_count','average_rating','five_star_ratings','four_
star_ratings'
 ,'three_star_ratings','two_star_ratings','one_star_ratings','date_published'
,'number_of_pages','books_in_series','Target']]
columns=df.columns.tolist()
columns.remove('id')
df_x,y=preprocessing(df)
df_x=Standardisation(df_x)
x_train, x_test, y_train, y_test = train_test_split(df_x, y, test_size=0.3,
random_state=12)
df_res, df_x_res, y_res=smo(x_train,y_train, columns)
#the effect of data after standardisation is better by comparing the accuracy before
and after standardisation
#df_x_res=Standardisation(df_x_res)
LR=LogisticRegression()
LR.fit(df_x_res,y_res)
RF=RandomForestClassifier()
RF.fit(df_x_res,y_res)
GBC=GradientBoostingClassifier()
GBC.fit(df_x_res,y_res)
AdB= AdaBoostClassifier()
AdB.fit(df_x_res,y_res)
evaluate(LR,x_test,y_test)
evaluate(RF,x_test,y_test)
evaluate(GBC,x_test,y_test)
evaluate(AdB,x_test,y_test)
- 1
- 2
- 3
- 4
- 5
- 6
- 7
- 8
- 9
- 10
- 11
- 12
- 13
- 14
- 15
- 16
- 17
- 18
- 19
- 20
- 21
- 22
- 23
- 24
- 25
- 26
- 27
声明:本文内容由网友自发贡献,版权归原作者所有,本站不承担相应法律责任。如您发现有侵权的内容,请联系我们。转载请注明出处:【wpsshop博客】
推荐阅读
相关标签

