- 1项目总结:yolov5+bytrack 入侵检测
- 2注意力机制:CA - Coordinate Attention for Efficient Mobile Network Design(文末附代码)_ca注意力机制论文
- 3综述:激光雷达全景分割的传统点云聚类方法的技术总结
- 4[技术讨论]PT100采样电路设计_pt100采集电路
- 5【STM32 LVGL基础教程】初识LVGL
- 6ChatGPT在编程方面的用例:节省时间并提高工作效率_chatgpt节省开发时间
- 7java jdbc 分页_JDBC在javaweb中的应用之分页数据查询
- 8Python使用函数作为参数_python 函数名作为参数
- 9超火的chartGPT到底是什么?没有账号我能使用吗
- 10Rasa的前期配置(2.x)_rasa 使用显卡
LPA算法原理_lpa线性检测原理
赞
踩
算法原理
标签传播算法作为一种直推式学习方法,其被应用到了小样本学习中,以试图解决数据量过少的问题。本文主要阐述最简单的LPA原理
构建完全图(W矩阵)
W矩阵是一个N * N的矩阵,由它代表完全图,很明显,这是一个对称的方阵,N表示结点数量。
w
i
j
w_{ij}
wij表示结点
N
j
N_j
Nj与
N
i
N_i
Ni之间的相似度。相似度计算公式为:
w
i
j
=
exp
(
−
d
i
j
σ
2
)
=
exp
(
−
∑
d
=
1
D
(
x
i
d
−
x
j
d
)
σ
2
)
w_{\mathrm{ij}}=\exp \left(-\frac{\mathrm{d}_{\mathrm{ij}}}{\sigma^2}\right)=\exp \left(-\frac{\sum_{\mathrm{d}=1}^{\mathrm{D}}\left(\mathrm{x}_{\mathrm{i}}^{\mathrm{d}}-\mathrm{x}_{\mathrm{j}}^{\mathrm{d}}\right)}{\sigma^2}\right)
wij=exp(−σ2dij)=exp(−σ2∑d=1D(xid−xjd))
在代码实现过程中,
d
i
j
d_{ij}
dij采用的是欧式距离,
σ
\sigma
σ是一个超参数。
概率传播矩阵(P矩阵)
标签传播,重点在于传播,一个结点与其余结点都有连接,都会被其他的结点所影响,但是根据
w
i
j
w_{ij}
wij的不同,其影响程度也不同,因此P矩阵实际上是W矩阵按行归一化的结果。即相似度越高,影响权重越大。这里给到一个从W转为P的示例:

当数据确定后,结点之间的相似度也就确定了,因此P矩阵在整个计算过程中都不会发生改变。
标签矩阵(F矩阵)
在我看来,这实际上就是一个概率矩阵,行代表样本,列代表类别,
F
i
j
F{ij}
Fij代表样本
i
i
i属于类
j
j
j的概率。在经过不断迭代使其收敛后,根据概率大小判断样本类别,示例如下图:
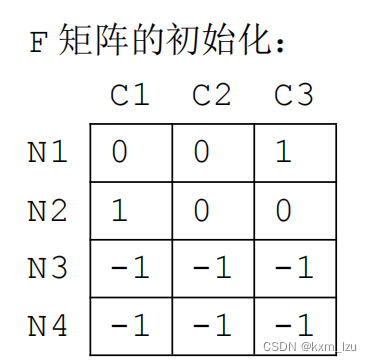
图中N1,N2代表标记数据,N3,N4代表未标记数据。由于标记数据的标签是确定的,所以其概率设为1,其他类别概率为0。比如图中N1属于C3类,则其值为1,其余为0,N2同理。未标记数据的概率则无所谓了,反正都要迭代生成,不影响结果。
迭代过程
迭代过程就是所谓的”传播过程“,其旨在不断更新F矩阵,使其收敛。因此计算公式很简单:F = P * F。 但是在每次迭代后,要将标记数据的标签重置回来,因为他们的标签是确定的。
python代码实现:
import numpy as np
import math
import matplotlib.pyplot as plt


def buildGraph(MatX, rbf_sigma=None):
    """
    构建完全图,方阵,行列大小均为结点数量
    每个元素按照定义初始化
    :param MatX: 全体数据矩阵
    :param rbf_sigma: 计算公式里的参数
    :return: 返回矩阵P
    """
    num_samples = MatX.shape[0]
    affinity_matrix = np.zeros((num_samples, num_samples), np.float32)
    if rbf_sigma == None:
        raise ValueError("rbf_sigma can't be None!")
    for i in range(num_samples):
        row_sum = 0.0
        for j in range(num_samples):
            diff = MatX[i, :] - MatX[j, :]
            affinity_matrix[i][j] = np.exp(sum(diff ** 2) / (-2.0 * rbf_sigma ** 2))
            row_sum += affinity_matrix[i][j]
        affinity_matrix[i][:] /= row_sum
    return affinity_matrix


def native_knn(dataset, query, k):
    num_samples = dataset.shape[0]

    diff = np.tile(query, (num_samples, 1)) - dataset
    square_diff = diff ** 2
    square_distance = np.sum(square_diff, axis=1)
    sorted_indexs = np.argsort(square_distance)
    if k > num_samples:
        k = num_samples
    return sorted_indexs[0:k]

def build_graph_knn(mat_x, k=None):
    if k is None:
        raise ValueError("k is NULL!")
    num_samples = mat_x.shape[0]
    affinity_matrix = np.zeros((num_samples, num_samples), np.float32)
    for i in range(num_samples):
        k_neighbors = native_knn(mat_x, mat_x[i,:], k)
        affinity_matrix[i][k_neighbors] = 1.0 / k
    return affinity_matrix

def labelPropagation(Mat_Label, Mat_Unlabel, labels, rbf_sigma=1.5, max_iter=500, tol=1e-3):
    """
    :param Mat_Label: 标记的数据
    :param Mat_Unlabel: 没有标记的数据
    :param labels: 所有数据的标签,长度为结点数量
    :param rbf_sigma: 计算公式里的参数
    :param max_iter: 最大迭代次数
    :param tol: 最小误差
    :return: 直接返回未标记数据的标签
    """
    num_label_samples = Mat_Label.shape[0]
    num_unlabel_samples = Mat_Unlabel.shape[0]
    num_samples = num_label_samples + num_unlabel_samples
    labels_list = np.unique(labels)
    num_classes = len(labels_list)  # 得到F矩阵的列数,就是种类的个数

    Mat_X = np.vstack((Mat_Label, Mat_Unlabel))  # 将两个数据矩阵按行堆叠,得到所有的数据
    clamp_data_label = np.zeros((num_label_samples, num_classes), np.float32) # 对于已标记数据的标签矩阵的初始化
    for i in range(num_label_samples):
        clamp_data_label[i][labels[i]] = 1.0   # 属于哪个类,则哪个类对应的列的位置置为1
    label_function = np.zeros((num_samples, num_classes), np.float32) # 初始化总体的F矩阵
    label_function[0: num_label_samples][:] = clamp_data_label # 将已标记数据初始化
    label_function[num_label_samples:num_samples] = -1 # 将未标记数据的标签随便初始化

    affinity_matrix = buildGraph(Mat_X, rbf_sigma) # 首先得到P矩阵

    iter = 0
    pre_label_function = np.zeros((num_samples, num_classes), np.float32) # 每次迭代都会产生预测结果,这个用于记录上一次的label_function
    changed = np.abs(pre_label_function - label_function).sum()
    while iter < max_iter and changed > tol:
        print("---> Iteration %d/%d, changed:%f" % (iter, max_iter, changed))

        pre_label_function = label_function
        iter += 1

        label_function = np.dot(affinity_matrix, label_function) # 按照公式计算
       # label_function = np.vstack((clamp_data_label,label_function[num_label_samples]))
        label_function[:num_label_samples] = clamp_data_label  # 每次都需要将标签数据从新赋为初始的标签,这个是不可以变的
        changed = np.abs(pre_label_function - label_function).sum() # 计算迭代前后的一个损失

    unlabel_data_labels = np.zeros(num_unlabel_samples) # 初始化未标记数据的预测标签
    for i in range(num_unlabel_samples):
        unlabel_data_labels[i] = np.argmax(label_function[i + num_label_samples]) # 最终得到的标记矩阵,每一行是该数据属于哪个类的概率分布,取最大的为预测值

    return unlabel_data_labels


def labelPropagation_knn(Mat_Label, Mat_Unlabel, labels, k=10, max_iter=500, tol=1e-3):
    """
    :param Mat_Label: 标记的数据
    :param Mat_Unlabel: 没有标记的数据
    :param labels: 所有数据的标签,长度为结点数量
    :param rbf_sigma: 计算公式里的参数
    :param max_iter: 最大迭代次数
    :param tol: 最小误差
    :return: 直接返回未标记数据的标签
    """
    num_label_samples = Mat_Label.shape[0]
    num_unlabel_samples = Mat_Unlabel.shape[0]
    num_samples = num_label_samples + num_unlabel_samples
    labels_list = np.unique(labels)
    num_classes = len(labels_list)  # 得到F矩阵的列数,就是种类的个数

    Mat_X = np.vstack((Mat_Label, Mat_Unlabel))  # 将两个数据矩阵按行堆叠,得到所有的数据
    clamp_data_label = np.zeros((num_label_samples, num_classes), np.float32) # 对于已标记数据的标签矩阵的初始化
    for i in range(num_label_samples):
        clamp_data_label[i][labels[i]] = 1.0   # 属于哪个类,则哪个类对应的列的位置置为1
    label_function = np.zeros((num_samples, num_classes), np.float32) # 初始化总体的F矩阵
    label_function[0: num_label_samples][:] = clamp_data_label # 将已标记数据初始化
    label_function[num_label_samples:num_samples] = -1 # 将未标记数据的标签随便初始化

    affinity_matrix = build_graph_knn(Mat_X, k) # 首先得到P矩阵

    iter = 0
    pre_label_function = np.zeros((num_samples, num_classes), np.float32) # 每次迭代都会产生预测结果,这个用于记录上一次的label_function
    changed = np.abs(pre_label_function - label_function).sum()
    while iter < max_iter and changed > tol:
        print("---> Iteration %d/%d, changed:%f" % (iter, max_iter, changed))

        pre_label_function = label_function
        iter += 1

        label_function = np.dot(affinity_matrix, label_function) # 按照公式计算
       # label_function = np.vstack((clamp_data_label,label_function[num_label_samples]))
        label_function[:num_label_samples] = clamp_data_label  # 每次都需要将标签数据从新赋为初始的标签,这个是不可以变的
        changed = np.abs(pre_label_function - label_function).sum() # 计算迭代前后的一个损失

    unlabel_data_labels = np.zeros(num_unlabel_samples) # 初始化未标记数据的预测标签
    for i in range(num_unlabel_samples):
        unlabel_data_labels[i] = np.argmax(label_function[i + num_label_samples]) # 最终得到的标记矩阵,每一行是该数据属于哪个类的概率分布,取最大的为预测值

    return unlabel_data_labels


def show(Mat_Label, labels, Mat_Unlabel, unlabel_data_labels):
    for i in range(Mat_Label.shape[0]):
        if int(labels[i]) == 0:
            plt.plot(Mat_Label[i, 0], Mat_Label[i, 1], 'Dr')
        elif int(labels[i]) == 1:
            plt.plot(Mat_Label[i, 0], Mat_Label[i, 1], 'Db')
        else:
            plt.plot(Mat_Label[i, 0], Mat_Label[i, 1], 'Dy')

    for i in range(Mat_Unlabel.shape[0]):
        if int(unlabel_data_labels[i]) == 0:
            plt.plot(Mat_Unlabel[i, 0], Mat_Unlabel[i, 1], 'or')
        elif int(unlabel_data_labels[i]) == 1:
            plt.plot(Mat_Unlabel[i, 0], Mat_Unlabel[i, 1], 'ob')
        else:
            plt.plot(Mat_Unlabel[i, 0], Mat_Unlabel[i, 1], 'oy')

    plt.xlabel('X1')
    plt.ylabel('X2')
    plt.xlim(0.0, 12.)
    plt.ylim(0.0, 12.)
    plt.show()


def loadCircleData(num_data):
    center = np.array([5.0, 5.0])
    radiu_inner = 2
    radiu_outer = 4
    num_inner = num_data // 3
    num_outer = num_data - num_inner

    data = []
    theta = 0.0
    for i in range(num_inner):
        pho = (theta % 360) * math.pi / 180
        tmp = np.zeros(2, np.float32)
        tmp[0] = radiu_inner * math.cos(pho) + np.random.rand(1) + center[0]
        tmp[1] = radiu_inner * math.sin(pho) + np.random.rand(1) + center[1]
        data.append(tmp)
        theta += 2

    theta = 0.0
    for i in range(num_outer):
        pho = (theta % 360) * math.pi / 180
        tmp = np.zeros(2, np.float32)
        tmp[0] = radiu_outer * math.cos(pho) + np.random.rand(1) + center[0]
        tmp[1] = radiu_outer * math.sin(pho) + np.random.rand(1) + center[1]
        data.append(tmp)
        theta += 1

    Mat_Label = np.zeros((2, 2), np.float32)
    Mat_Label[0] = center + np.array([-radiu_inner + 0.5, 0])
    Mat_Label[1] = center + np.array([-radiu_outer + 0.5, 0])
    labels = [0, 1]
    Mat_Unlabel = np.vstack(data)
    return Mat_Label, labels, Mat_Unlabel

if __name__ == "__main__":
    num_unlabel_samples = 800
    # Mat_Label, labels, Mat_Unlabel = loadBandData(num_unlabel_samples)
    Mat_Label, labels, Mat_Unlabel = loadCircleData(num_unlabel_samples)
    unlabel_data_labels = labelPropagation_knn(Mat_Label, Mat_Unlabel, labels, max_iter=300,k=10)
    show(Mat_Label, labels, Mat_Unlabel, unlabel_data_labels)
- 1
- 2
- 3
- 4
- 5
- 6
- 7
- 8
- 9
- 10
- 11
- 12
- 13
- 14
- 15
- 16
- 17
- 18
- 19
- 20
- 21
- 22
- 23
- 24
- 25
- 26
- 27
- 28
- 29
- 30
- 31
- 32
- 33
- 34
- 35
- 36
- 37
- 38
- 39
- 40
- 41
- 42
- 43
- 44
- 45
- 46
- 47
- 48
- 49
- 50
- 51
- 52
- 53
- 54
- 55
- 56
- 57
- 58
- 59
- 60
- 61
- 62
- 63
- 64
- 65
- 66
- 67
- 68
- 69
- 70
- 71
- 72
- 73
- 74
- 75
- 76
- 77
- 78
- 79
- 80
- 81
- 82
- 83
- 84
- 85
- 86
- 87
- 88
- 89
- 90
- 91
- 92
- 93
- 94
- 95
- 96
- 97
- 98
- 99
- 100
- 101
- 102
- 103
- 104
- 105
- 106
- 107
- 108
- 109
- 110
- 111
- 112
- 113
- 114
- 115
- 116
- 117
- 118
- 119
- 120
- 121
- 122
- 123
- 124
- 125
- 126
- 127
- 128
- 129
- 130
- 131
- 132
- 133
- 134
- 135
- 136
- 137
- 138
- 139
- 140
- 141
- 142
- 143
- 144
- 145
- 146
- 147
- 148
- 149
- 150
- 151
- 152
- 153
- 154
- 155
- 156
- 157
- 158
- 159
- 160
- 161
- 162
- 163
- 164
- 165
- 166
- 167
- 168
- 169
- 170
- 171
- 172
- 173
- 174
- 175
- 176
- 177
- 178
- 179
- 180
- 181
- 182
- 183
- 184
- 185
- 186
- 187
- 188
- 189
- 190
- 191
- 192
- 193
- 194
- 195
- 196
- 197
- 198
- 199
- 200
- 201
- 202
- 203
- 204
- 205
- 206
- 207
- 208
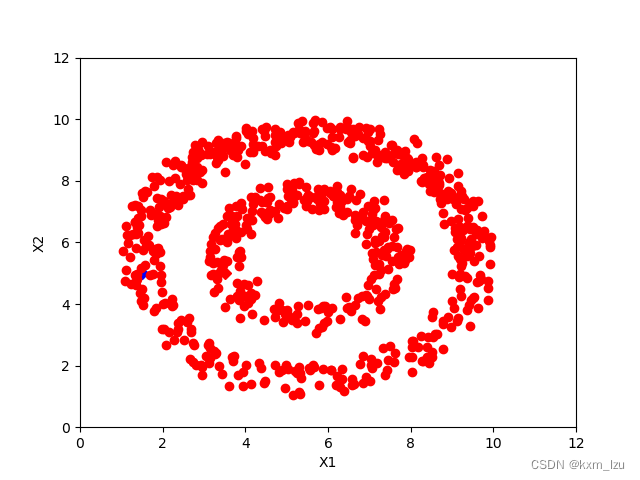
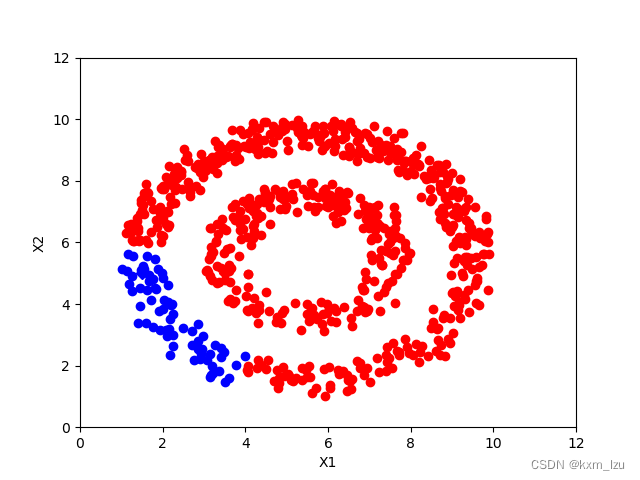
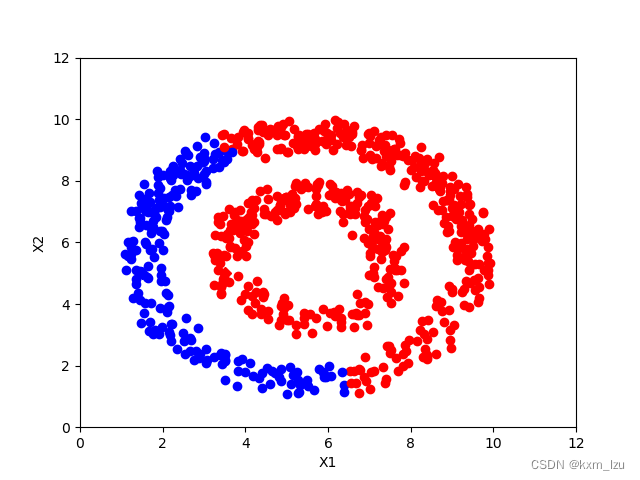
使用KNN建图的方式,结果如下图:
iter=0:
iter=10:
iter=30:
iter=100:
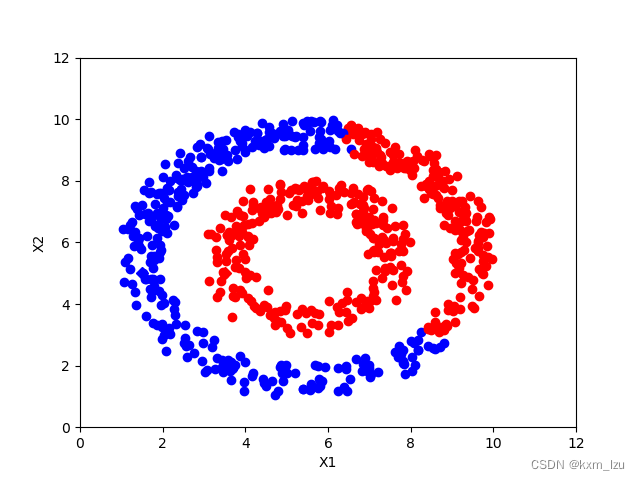
iter=150:
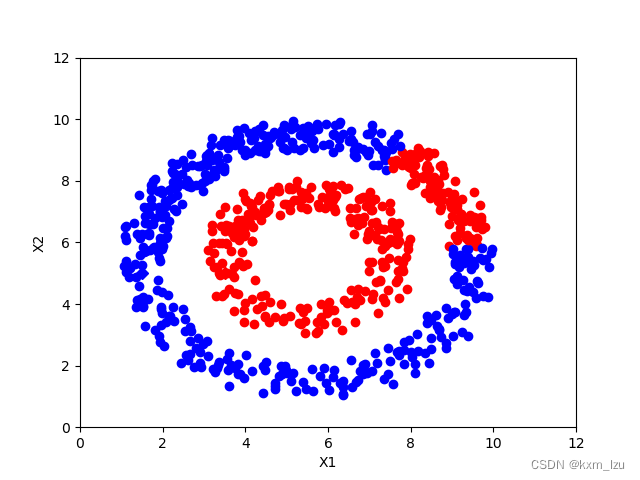
iter=300:
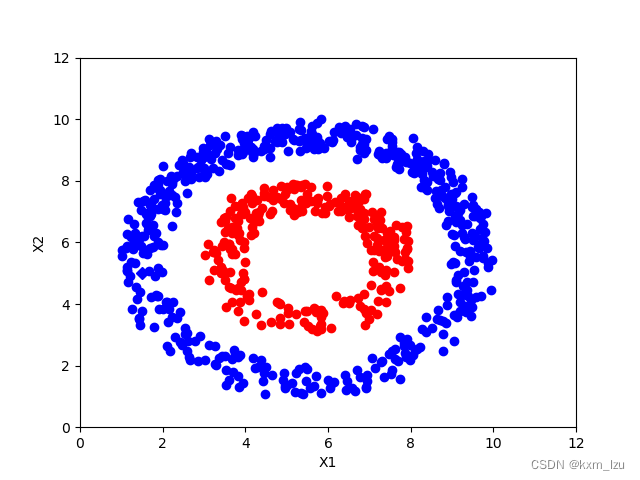
从图中可以清楚的看到传播的过程。
以上是自己在参考相关博客后得出的自己的一些理解,如有错误,还请不吝赐教,谢谢!
参考博客链接:
大佬的博客


