- 1UDP服务器和客户端的实现和IO多路复用_udp怎么使用io多路复用
- 2在ubuntu 24.04上安装xrdp服务器(已验证可用)
- 3【FPGA】高云FPGA之数字钟实验->HC595驱动数码管_fpga数码管
- 4FPGA实现10G万兆网TCP/IP 协议栈,服务器版本,纯VHDL代码编写 提供6套vivado工程源码和技术支持_fpga dhcp实现
- 5Android移动开发-VR全景照片简单实现,计算机应届毕业生面试题_com.google.vr.sdk.widgets.pano.vrpanoramaview
- 6php获取访客IP、UA、操作系统、浏览器等信息_php实现-浏览器ua解析获得手机、系统、浏览器等信息
- 72024最新docker部署gitlab
- 8OPENGL ES 2.0 知识串讲 (9) ——OPENGL ES 详解III(纹理)_regular 2d textures和texture arrays和a cube map arra
- 9大数据分析系统简介,什么是大数据分析系统?
- 10linux CentOS7 使用yum安装mongodb4.4数据库,以及mongodb数据库中新建用户,增删改查,和备份恢复操作_centos7 yum mongodb
从0开始canvas系列一 --- canvas画布
赞
踩
从0开始canvas系列
从0开始canvas系列一 — canvas画布
什么是canvas
canvas是HTML5新增的元素,通过javascript脚本来完成图形的绘制。它可以用于动画、游戏画面、数据可视化、图片编辑以及实时视频处理等方面。
简单来说,canvas提供了一张画布,调用getContext属性(可以是2d或者WebGL 3d)定义画笔,通过设置图像的填充或者描边属性,定义图形的绘图方式,完成一次图形的绘制,每次绘制都是已绘制路径作为一个绘制单元
每一次绘制过程可以总结为以下步骤
 //获取画布
const  canvas=document.querySelector('#canvas');
//定义画笔
const ctx=canvas.getContext('2d');
//设置画笔的颜色
ctx.fillStyle='red';
//开启一次绘制路径
ctx.beginPath();
//设置起始坐标
ctx.moveTo(x,y);
//定义绘制图形的形状
ctx.arc(x,y,r,开始弧度,结束弧度,方向);//定义圆弧
//渲染路径
ctx.fill()
- 1
- 2
- 3
- 4
- 5
- 6
- 7
- 8
- 9
- 10
- 11
- 12
- 13
- 14
怎么用canvas
canvas就是一个画图过程,你在写js代码的时候就是画图的过程,Canvas API提供的就是画图的工具,下面我们就用这个概念我们正式开始canvas的学习之路
canvas画布(纸和笔的准备)
-
canvas画布(画纸)的坐标系和栅格
- 坐标系是二维,x/y轴
- x轴往右越大,y轴往下越大
- 像素为最小单元(栅格),每个像素具有RGBA数据,像素数量等于画布长*宽

-
canvas画布(画纸)的大小设置
- 画布长和宽可以是行间样式
- 可以通过canvas.width/canvas.height定义
- 极限尺寸控制再4000内
- 不要通过css样式设置,会造成图形失真
<canvas id="canvas" width="700" height="800"></canvas>

const  canvas=document.querySelector('#canvas');
canvas.width=300;
canvas.height=150;
- 1
- 2
- 3
- 4
- 5
- canvas画笔
- 2d画笔
- 3d画笔
//2d画笔
const  ctx=canvas.getContext('2d');
//3d画笔
const  ctx=canvas.getContext('webgl');
- 1
- 2
- 3
- 4
canvas绘制图形(画图形)
基本图形
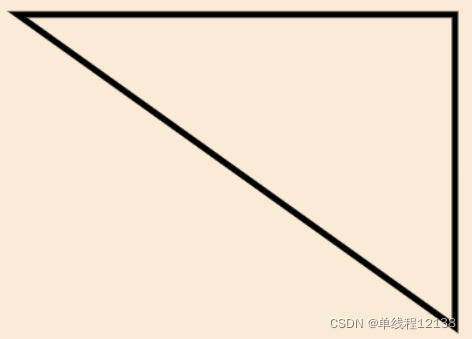
直线
lineTo(x,y)
  /*直线:lineTo(x,y); */
  ctx.beginPath();
  ctx.moveTo(50,50);
  ctx.lineTo(400,50);
  ctx.lineTo(400,300);
  ctx.closePath();
  ctx.stroke();
- 1
- 2
- 3
- 4
- 5
- 6
- 7
圆弧
-
arc(x,y,半径,开始弧度,结束弧度,方向)方向:true表示顺时针,false表示逆时针
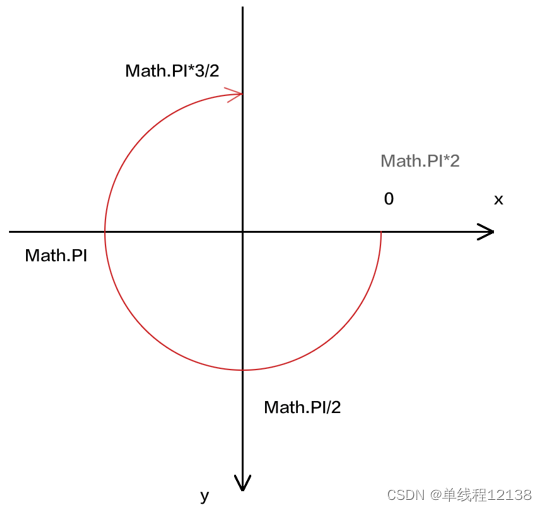
  ctx.beginPath();
  ctx.arc(300,300,100,0,Math.PI*3/2,true);//顺时针
  ctx.stroke();

  ctx.moveTo(700,300);
  ctx.arc(600,300,100,0,Math.PI*3/2,false);
  ctx.stroke();
- 1
- 2
- 3
- 4
- 5
- 6
- 7

切线圆弧
-
arcTo(x1,y1,x2,y2,半径)坐标说明如下

ctx.beginPath();
ctx.moveTo(50,50);
ctx.arcTo(400,50,400,300,100);
ctx.stroke();
- 1
- 2
- 3
- 4
二次贝塞尔曲线
-
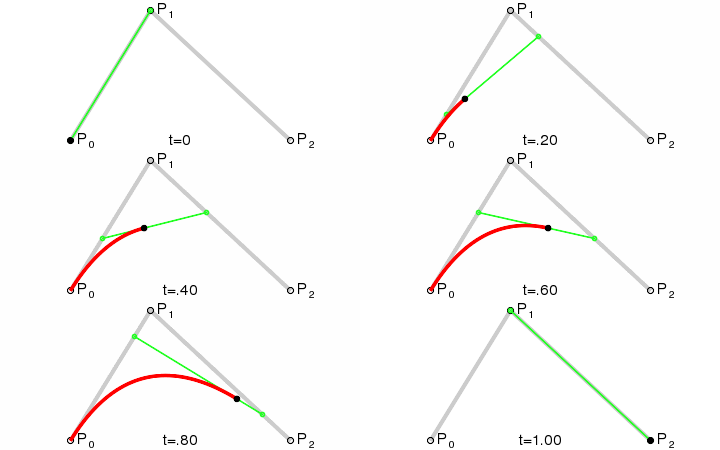
quadraCurverTo(cpx1,cpy1,x,y)- cpx1/cpy1 表示控制点,x/y表示结束点
绘图过程如下(p1控制点,p2结束点):
-
由 P0 至 P1 的连续点 Q0,描述一条线段。
-
由 P1 至 P2 的连续点 Q1,描述一条线段。
-
由 Q0 至 Q1 的连续点 B(t),描述一条二次贝塞尔曲线。
ctx.beginPath();
ctx.moveTo(50,50);
ctx.quadraticCurveTo(400,50,400,300);
ctx.stroke();
- 1
- 2
- 3
- 4
三次贝塞尔曲线
-
bezierCurverTo(cpx1,cpy1,cpx2,cpy2,x,y)- cpx1/cpy1 cpx2/cpy2表示控制点,x/y表示结束点
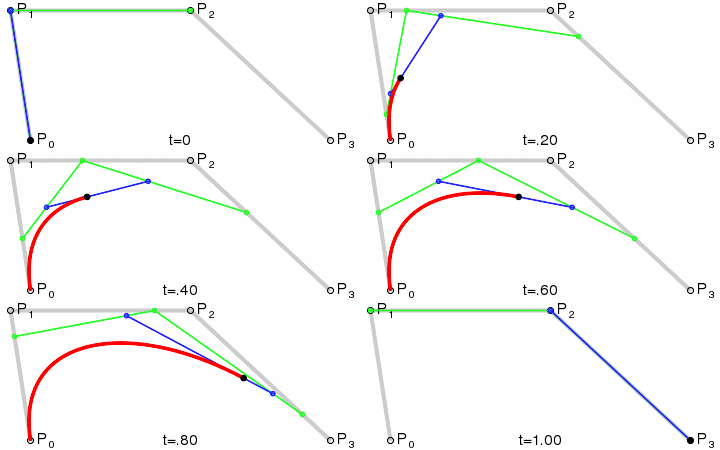
ctx.beginPath();
ctx.moveTo(50,50);
ctx.bezierCurveTo(
    400,50,
    400,300,
    800,300
)
ctx.stroke();
- 1
- 2
- 3
- 4
- 5
- 6
- 7
- 8
矩形
-
基本矩形
rect(x,y,w,h)- 矩形不需要指定起始点
ctx.beginPath(); ctx.rect(50,50,400,200); ctx.stroke(); ctx.fill();- 1
- 2
- 3
- 4
-
填充矩形
fillRect(x,y,w,h) -
描边矩形
strokeRect(x,y,w,h) -
清理矩形(橡皮擦)
ctx.clearRect(x,y,w,h);
【扩展】路径
从各个图形的绘制过程中我们可以发现每一个图形绘制过程中都有如下规律:
- 首先,创建画图起始点。
- 然后,使用画图命令去设置图形。
- 最后,通过描边或填充路径区域来渲染图形。
上述三个过程,其实就是一个路径的创建过程
图形的基本元素是路径。路径是通过不同颜色和宽度的线段或曲线相连形成的不同形状的点的集合。一个路径,甚至一个子路径,都是闭合的。
有关路径的API如下
-
beginPath()
新建一条路径集合,生成之后,图形绘制命令被指向到路径集合上生成路径。
当前路径为空,即调用beginPath()之后,或者canvas刚建的时候,第一条路径构造命令通常被视为是moveTo(),无论实际上是什么。出于这个原因,你几乎总是要在设置路径之后专门指定你的起始位置。
-
closePath()
闭合路径之后图形绘制命令又重新指向到上下文中。
-
stroke()
通过线条来绘制图形轮廓。
-
fill()
通过填充路径的内容区域生成实心的图形。
当你调用fill()函数时,所有没有闭合的形状都会自动闭合,所以你不需要调用closePath()函数。但是调用stroke()时不会自动闭合。
路径和子路径
-
路径:
- 路径是子路径的集合
- 一个上下文对象同时只有一个路径,想要绘制新的路径,就要把当前路径置空。
- beginPath()方法可以将当前路径置空,也就是将路径恢复到默认状态,让之后绘制的路径不受以前路径的影响。
-
子路径
- 子路径是一条只有一个起点的、连续不断开的线
- moveTo(x,y) 是设置路径起点的方法,也是创建一条新的子路径的方法
- 路径里的第一条子路径可以无需设置起点,它的起点默认是子路径中的第一个点
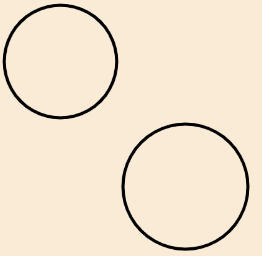
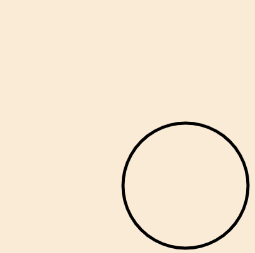
两者的关系图

//beginPath开启一条路径
ctx.beginPath();
//子路径1
ctx.moveTo(190,100);
ctx.arc(100,100,90,0,Math.PI*2);

ctx.beginPath();//加入前后效果如图

//子路径2
ctx.moveTo(400,300);
ctx.arc(300,300,100,0,Math.PI*2);
ctx.stroke();
- 1
- 2
- 3
- 4
- 5
- 6
- 7
- 8
- 9
- 10
- 11
- 12
无beginPath()
有beginPath()
图形着色和描边(上色和描边)
注意:着色或者描边实际是在画图前
图形着色
着色分为两部分:fillStyle(内部填充区)和stokeStyle(描边区)
fillStyle(图形填充区)
ctx.fillStyle
是Canvas 2D API 使用内部方式描述颜色和样式的属性。默认值是 #000 (黑色)。
var canvas = document.getElementById("canvas");
var ctx = canvas.getContext("2d");

ctx.fillStyle = "blue";
ctx.fillRect(10, 10, 100, 100);
- 1
- 2
- 3
- 4
- 5
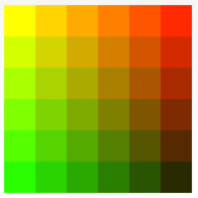
fillStyle 使用 for 循环的例子
var ctx = document.getElementById('canvas').getContext('2d');
for (var i=0;i<6;i++){
  for (var j=0;j<6;j++){
    ctx.fillStyle = 'rgb(' + Math.floor(255-42.5*i) + ',' +
                     Math.floor(255-42.5*j) + ',0)';
    ctx.fillRect(j*25,i*25,25,25);
  }
}
- 1
- 2
- 3
- 4
- 5
- 6
- 7
- 8
stokeStyle(描边区)
ctx.stokenStyle是 Canvas 2D API 描述画笔(绘制图形)颜色或者样式的属性。默认值是 #000 (black)。
var canvas = document.getElementById("canvas");
var ctx = canvas.getContext("2d");

ctx.strokeStyle = "blue";
ctx.strokeRect(10, 10, 100, 100);
- 1
- 2
- 3
- 4
- 5
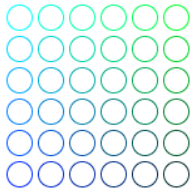
stokeStyle 使用 for 循环的例子
var ctx = document.getElementById('canvas').getContext('2d');
for (var i=0;i<6;i++){
  for (var j=0;j<6;j++){
    ctx.strokeStyle = 'rgb(0,' + Math.floor(255-42.5*i) + ',' +
                      Math.floor(255-42.5*j) + ')';
    ctx.beginPath();
    ctx.arc(12.5+j*25,12.5+i*25,10,0,Math.PI*2,true);
    ctx.stroke();
  }
}
- 1
- 2
- 3
- 4
- 5
- 6
- 7
- 8
- 9
- 10
着色样式
图形的着色方式有三种
- 纯色
- 渐变
- 纹理
对应的代码为
ctx.fillStyle = color;
ctx.fillStyle = gradient;
ctx.fillStyle = pattern;

ctx.strokeStyle = color;
ctx.strokeStyle = gradient;
ctx.strokeStyle = pattern;

color
    DOMString 字符串,可以转换成 CSS <color> 值。
gradient
	CanvasGradient 对象(线性渐变或放射性渐变)。
pattern
	CanvasPattern 对象(可重复的图片)。
- 1
- 2
- 3
- 4
- 5
- 6
- 7
- 8
- 9
- 10
- 11
- 12
- 13
- 14
- 纯色
ctx.fillStyle='blue';
ctx.fillStyle='#00acec';
ctx.fillStyle='RGB(255,0,255)';
ctx.fillStyle='RGBA(0,0,255,0.5)';
- 1
- 2
- 3
- 4
-
渐变
渐变相比纯色,设置起来要相对复杂,需要设置起始和终点坐标和起始颜色,另外你还能在再中间添加点位和颜色

渐变可分为线性渐变和径向渐变
线性渐变

径向渐变

具体设置如下
- 设置渐变对象(起始和终点坐标)
//线性渐变
const gr = ctx.createLinearGradient(x1, y1, x2, y2)
//径向渐变
const gr = ctx.createRadialGradient(x1, y1, r1, x2, y2, r2)

x1,y1:起始坐标  r1: 开始坐标半径
x2,y2:终点坐标  r2: 终点坐标半径
- 1
- 2
- 3
- 4
- 5
- 6
- 7
- 定义各个坐标的颜色
gr.addColorStop(position, color)

position:位置,取值0-1,0代表起始点,1代表终点
color:颜色,纯色
- 1
- 2
- 3
- 4
- 为样式进行赋值
ctx.fillStyle = gr;
ctx.stokeStyle = gr;
- 1
- 2
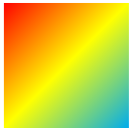
线性渐变demo
  const canvas=document.getElementById('canvas');
  //canvas 充满窗口
  canvas.width=window.innerWidth;
  canvas.height=window.innerHeight;

  //画笔-上下文对象
  const ctx=canvas.getContext('2d');

  /*
  1.建立渐变对象,定义渐变的区域
  */
  const gr=ctx.createLinearGradient(50,50,450,450);

  /*
  2.为渐变添加颜色节点
  */
  gr.addColorStop(0,'red');
  gr.addColorStop(0.5,'yellow');
  gr.addColorStop(1,'#00acec');

  /*
  3.为样式赋值
  */
  ctx.fillStyle=gr;

  /*
  4.绘图
  */
  ctx.fillRect(50,50,400,400);
- 1
- 2
- 3
- 4
- 5
- 6
- 7
- 8
- 9
- 10
- 11
- 12
- 13
- 14
- 15
- 16
- 17
- 18
- 19
- 20
- 21
- 22
- 23
- 24
- 25
- 26
- 27
- 28
- 29
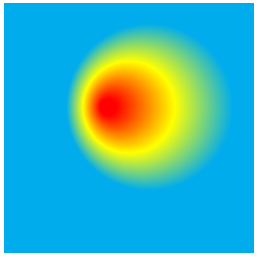
径向渐变demo
  const canvas=document.getElementById('canvas');
  //canvas 充满窗口
  canvas.width=window.innerWidth;
  canvas.height=window.innerHeight;

  //画笔-上下文对象
  const ctx=canvas.getContext('2d');

  /*
  1.建立渐变对象,定义渐变的区域
  */
  const gr=ctx.createRadialGradient(
      300,300,20,
      400,300,200
  )

  /*
  2.为渐变添加颜色节点
  */
  gr.addColorStop(0,'red');
  gr.addColorStop(0.5,'yellow');
  gr.addColorStop(1,'#00acec');

  /*
  3.为样式赋值
  */
  ctx.fillStyle=gr;

  /*
  4.绘图
  */
  ctx.fillRect(50,50,600,600);
- 1
- 2
- 3
- 4
- 5
- 6
- 7
- 8
- 9
- 10
- 11
- 12
- 13
- 14
- 15
- 16
- 17
- 18
- 19
- 20
- 21
- 22
- 23
- 24
- 25
- 26
- 27
- 28
- 29
- 30
- 31
- 32
- 纹理
纹理就是将图片重复填充,其设置方法和渐变步骤类似
- 设置纹理对象
const pt = ctx.createPattern(image,"repeat|repeat-x|repeat-y|no-repeat");
- 为样式进行赋值
ctx.fillStyle=pt
纹理demo
  const img=new Image();
  img.src='./images/floor.jpg';
  img.onload=function(){
      const pt=ctx.createPattern(img,'repeat');
      ctx.fillStyle=pt;
      ctx.fillRect(0,0,canvas.width,canvas.height);
  }
- 1
- 2
- 3
- 4
- 5
- 6
- 7

图形描边
-
strokeStyle/lineWidth
描边的颜色和宽度
//上文已经讲过 ctx.strokeStyle = color ctx.lineWidth = value value:描述线段宽度的数字。 0、 负数、 Infinity 和 NaN 会被忽略- 1
- 2
- 3
- 4
- 5
-
lineCap
描边端点样式
ctx.save(); ctx.lineCap='butt/round/square'; ctx.beginPath(); ctx.moveTo(50,50); ctx.lineTo(400,50); ctx.stroke(); ctx.restore(); lineCap 描边端点样式 * butt 没有端点,默认 * round 圆形端点 * square 方形端点- 1
- 2
- 3
- 4
- 5
- 6
- 7
- 8
- 9
- 10
- 11
- 12
butt

round

square

-
lineJoin
拐角类型
ctx.save(); ctx.lineJoin='miter/round/bevel'; ctx.beginPath(); ctx.moveTo(50,50); ctx.lineTo(400,50); ctx.lineTo(200,150); ctx.stroke(); ctx.restore(); lineJoin 拐角类型 * miter 尖角 * round 圆角 * bevel 切角- 1
- 2
- 3
- 4
- 5
- 6
- 7
- 8
- 9
- 10
- 11
- 12
- 13
miter

round

bevel

- setLineDash
ctx.setLineDash(segments)

segments
一个Array数组。一组描述交替绘制线段和间距(坐标空间单位)长度的数字。
数组中的数据只是代表每条虚实线的长度,和虚实线交替出现没有关系
- 1
- 2
- 3
- 4
- 5
ctx.setLineDash([60,90])

ctx.setLineDash([60,90,120])

- 投影
位置:shadowOffsetX , shadowOffsetY
模糊度:shadowBlur
颜色:shadowColor
    ctx.shadowColor='#000';
    ctx.shadowOffsetY=30;
    ctx.shadowOffsetX=30;
    ctx.shadowBlur=30;
    ctx.beginPath();
    ctx.arc(300,200,100,0,Math.PI*2);
    ctx.fillStyle='#93abff';
    ctx.fill();
- 1
- 2
- 3
- 4
- 5
- 6
- 7
- 8
segments
一个Array数组。一组描述交替绘制线段和间距(坐标空间单位)长度的数字。
数组中的数据只是代表每条虚实线的长度,和虚实线交替出现没有关系
`ctx.setLineDash([60,90])`
[外链图片转存中...(img-wTlH25Bt-1649603649709)]

`ctx.setLineDash([60,90,120])`
[外链图片转存中...(img-95vYi8Q1-1649603649710)]

- 投影

 位置:shadowOffsetX , shadowOffsetY

 模糊度:shadowBlur

 颜色:shadowColor

```js
    ctx.shadowColor='#000';
    ctx.shadowOffsetY=30;
    ctx.shadowOffsetX=30;
    ctx.shadowBlur=30;
    ctx.beginPath();
    ctx.arc(300,200,100,0,Math.PI*2);
    ctx.fillStyle='#93abff';
    ctx.fill();
- 1
- 2
- 3
- 4
- 5
- 6
- 7
- 8
- 9
- 10
- 11
- 12
- 13
- 14
- 15
- 16
- 17
- 18
- 19
- 20
- 21
- 22
- 23
- 24


