ai替代数据可视化
As a machine learning researcher in the biology field, I have been keeping an eye on the recently emerging field of AI in drug discovery. Living in Toronto myself, where many “star” companies in this field were founded (Atomwise, BenchSci, Cyclica, Deep Genomics, ProteinQure… just to name a few!), I talked to many people in this field, and attended a few meetup events about this topic. What I learned is that this field is growing at such a rapid speed, and it is becoming increasing hard to keep track of all companies in this field and get a comprehensive view of them. Therefore, I decide to use my data science skills to track and analyze the companies in this field, and build an interactive dashboard (https://ai-drug-dash.herokuapp.com) to visualize some key insights from my analysis.
作为生物学领域的机器学习研究人员,我一直关注着最近在药物发现中新兴的AI领域。 我自己生活在多伦多,在那里建立了该领域的许多“明星”公司(Atomwise,BenchSci,Cyclica,Deep Genomics,ProteinQure…等等),我与该领域的许多人进行了交谈,并参加了一些聚会有关此主题的事件。 我了解到,这个领域正以如此Swift的速度增长,要跟踪该领域的所有公司并全面了解它们,变得越来越困难。 因此,我决定使用我的数据科学技能来跟踪和分析该领域的公司,并构建一个交互式仪表板( https://ai-drug-dash.herokuapp.com )以可视化我的分析中的一些关键见解。
数据集 (Dataset)
The Chief Strategy Officer of BenchSci (one of the “star” AI-drug startups in Toronto), Simon Smith, is an excellent observer and communicator in the AI-drug discovery field. I have been following his podcast and blog about industry trends and new companies. He wroted a blog in 2017 listing all startups in AI-drug discovery field, and has been updating this list since then. This blog is what I have found to be the most comprehensive list of companies in this field (230 startups as of April 2020), and therefore I decided to use his blog as my main data source.
BenchSci(多伦多“人工智能”新兴明星企业之一)的首席战略官西蒙·史密斯(Simon Smith)是人工智能药物发现领域的杰出观察者和交流者。 我一直在关注他关于行业趋势和新公司的播客和博客。 他在2017年撰写了一个博客 ,列出了AI药物发现领域中的所有初创公司,并且从那时起一直在更新此列表。 我发现该博客是该领域最全面的公司列表(截至2020年4月,共有230家创业公司),因此,我决定将他的博客用作主要数据来源。
数据预处理 (Data Preprocessing)
Since the blog simply listed companies as different paragraphs, I first scraped company information from the blog using Beautiful Soup. Then, I converted the scraped data into DataFrame format using Pandas. The dataframe looks like this:
由于博客只是将公司分为不同的段落,因此我首先使用Beautiful Soup从博客中抓取了公司信息。 然后,我使用Pandas将抓取的数据转换为DataFrame格式。 数据框如下所示:

In order to visualize these companies’ locations in a map, I converted the address information in this table to latitude and longtitude using Geopy:
为了在地图中可视化这些公司的位置,我使用Geopy将此表中的地址信息转换为纬度和经度:
# match address to latitude and longitude.from geopy.geocoders import Nominatimlocator = Nominatim(user_agent="ai_drug")lat, lng = [], []for i, row in df.iterrows(): location = locator.geocode(row.headquarters) or locator.geocode(row.city+','+row.country) lat.append(location.latitude) lng.append(location.longitude)df['latitude'] = latdf['longitude'] = lngThe funding information about these startups are not in the blog, therefore I searched for all 230 companies on crunchbase and pitchbook, and added these information to my dataset too.
这些初创公司的资金信息不能在博客,所以我搜索了所有230家公司在crunchbase和pitchbook ,太添加这些信息到我的数据集。
探索性数据分析 (Exploratory Data Analysis)
I did some exploratory data analysis of the cleaned dataset, and noticed a few interesting things.
我对清理后的数据集进行了一些探索性数据分析,并发现了一些有趣的事情。
1.自2010年以来的创业公司爆炸式增长 (1. Explosion of startups since 2010)
We can see this area didn’t really start existing until 1999. Schrödinger, the company that devolops chemical simulation software, was founded in 1990 and listed here, but I am not sure if their drug discovery platform has already started using AI in 1990… The explosion of startups started in post-2010 era, around the same time when the “AI-hype” started, and peaked in 2017.
我们可以看到,直到1999年,这个领域才真正开始存在。致力于开发化学模拟软件的公司Schrödinger成立于1990年,并在此处列出,但是我不确定他们的药物发现平台是否已在1990年开始使用AI。初创公司的爆炸式增长始于2010年后时代,大约是在“ AI炒作”开始的同时,并在2017年达到顶峰。

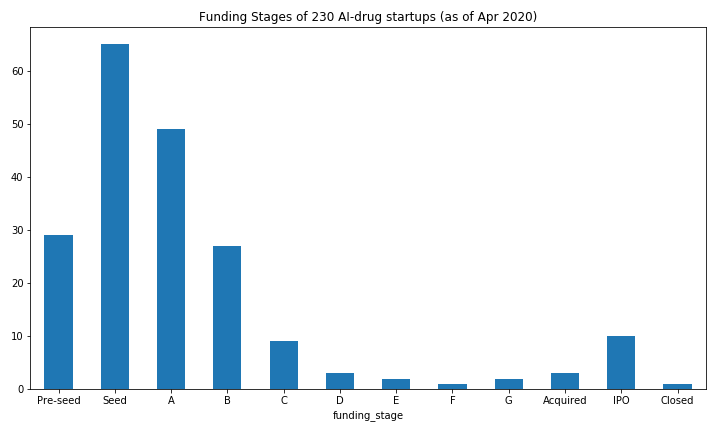
2.大多数风险投资是早期阶段 (2. Most VC fundings are early-stage)
We can see the majority of companies that received funding are still in early stages of venture capital funding (Pre-seed to Series A), which might be due to the fact that most AI-drug startups are still at the stage of exploring business models and developing technologies and products rather than scaling the company size.
我们可以看到,大多数接受融资的公司仍处于风险资本融资的早期阶段(A轮融资的早期阶段),这可能是由于大多数AI药品初创企业仍处于探索商业模式的事实并开发技术和产品,而不是扩大公司规模。

3.美国正在统治世界其他地区 (3. US is dominating the rest of the world)
This may not come as a surprise, but US is dominating the rest of the world in this field. More than half of the companies are headquartered in US; More than 80% of the VC money went to US startups! UK is the №2 both in number of companies and funding. Canada is the №3 in number of companies, but not in funding — China is. There are quite a few promising Chinese startups in this field. For example, Adagene, an antibody discovery & development company in Suzhou, just raised $69,000,000 D-series funding in January 2020.
这可能不足为奇,但是美国在该领域主导着世界其他地区。 超过一半的公司总部位于美国; 超过80%的风投资金流向了美国的初创公司! 英国在公司数量和融资方面均排名第二。 加拿大在公司数量上排名第3,但在资金筹措上却排名第3-中国是。 在这个领域有很多有前途的中国初创公司。 例如,苏州的抗体发现与开发公司Adagene在2020年1月刚刚筹集了6,900万美元的D系列资金。

4.新型候选药物是AI使用的重点领域 (4. Novel drug candidate generation is the focus area of AI usage)
We can see that the R&D category that attracts most attention and funding is the generation of novel drug candidates. Personally, I also thinks this is where AI can achieves its most power, i.e. predicting target-drug interactions using machine learning, by leveraging the large amount of existing test data.
我们可以看到,吸引最多注意力和资金的研发类别是新一代候选药物。 就我个人而言,我还认为这是AI可以发挥其最大功能的地方,即通过利用大量现有的测试数据,使用机器学习来预测目标药物相互作用。

互动式仪表板 (Interactive Dashboard)
I used Plotly Dash to build an interactive dashboard to visualize my dataset and deliver analysis insights. Dash is Python-based framework for building analytical web applications, and it’s free! The completed dashboard can be viewed at https://ai-drug-dash.herokuapp.com/, and you also can check out the code in my GitHub repo.
我使用Plotly Dash构建了一个交互式仪表板,以可视化我的数据集并提供分析见解。 Dash是用于构建分析Web应用程序的基于Python的框架,它是免费的! 可以在https://ai-drug-dash.herokuapp.com/上查看完整的仪表板,您也可以在我的GitHub存储库中查看代码。
How to use this dashboard?
如何使用此仪表板?
First, choose an visualization metric from the top left control panel. You can use either the number of companies, or the amount of investment in all visualization plots.
首先,从左上方的控制面板中选择一个可视化指标。 您可以在所有可视化图中使用公司数或投资额。
Next, choose a region or countries. This can be done either by selecting from the control panel, or by clicking/box selection in the map plot (to reset your selection, click empty spot in the map).
接下来,选择一个地区或国家。 可以通过从控制面板中进行选择,也可以通过在地图图中单击/选择框来完成(要重置选择,请单击地图中的空白点)。
Finally, choose a R&D category. This can be done either by selection from the control panel, or by clicking a bar in the bottom-left category plot, which will also update the keyword graph for this category. The company information table in the middle will also update with these selections, so that you can narrow down your company list for research.
最后,选择一个研发类别。 既可以通过从控制面板中进行选择,也可以通过单击左下方类别图中的一个条来完成,这还将更新该类别的关键字图表。 中间的公司信息表也会随着这些选择而更新,因此您可以缩小公司列表以进行研究。
Have fun!
玩得开心!

:
:
[1] Simon Smith, 230 Startups Using Artificial Intelligence in Drug Discovery. https://blog.benchsci.com/startups-using-artificial-intelligence-in-drug-discovery#understand_mechanisms_of_disease[2] https://www.crunchbase.com/[3] https://pitchbook.com/[4] David Comfort, How to Build a Reporting Dashboard using Dash and Plotly. https://towardsdatascience.com/how-to-build-a-complex-reporting-dashboard-using-dash-and-plotl-4f4257c18a7f
[1] Simon Smith,《 230在毒品发现中使用人工智能的新兴企业》。 https://blog.benchsci.com/startups-using-artificial-intelligence-in-drug-discovery#understand_mechanisms_of_disease [2] https://www.crunchbase.com/ [3] https://pitchbook.com/ [ 4] David Comfort,如何使用Dash和Plotly构建报告仪表板。 https://towardsdatascience.com/how-to-build-a-complex-reporting-dashboard-using-dash-and-plotl-4f4257c18a7f
翻译自: https://towardsdatascience.com/visualizing-ai-startups-in-drug-discovery-cb274eea2792
ai替代数据可视化


