- 1MTCNN详细解读
- 2一些语音特征--学习笔记_语音 预加重 分帧 加窗 fft
- 3自动化脚本-Excel批量生成二维码
- 4AI写作 | 对Chatgpt用哪些提示方式才能让它写一篇优秀的小红书笔记?_chatgpt 角色扮演提示词 小红书
- 5Widgets基础篇(上)_wigetsmifh
- 6Python学习笔记---(2)Python环境的搭建_用python 将 x = "我的身 是:",y=180 请将x跟y拼接到 起
- 7校园跑腿微信小程序,校园跑腿小程序,微信小程序跑腿系统毕设作品_校园跑腿小程序设计
- 8Arcgis中创建Python脚本工具_arcgis如何运行python脚本
- 9xcode 第二个模拟器无法安装_xcode 模拟器下载后无法安装
- 10《花雕学AI》ChatGPT 的 Prompt 用法,不是随便写就行的,这 13 种才是最有效的_chatgpt prompt 写作
使用决策树模型,来构建客户违约预测模型_1. 使用决策树分类模型对银行客户违约信息数据集进行预测 2. 绘制模型的学习曲线
赞
踩
实验:使用决策树模型,来构建客户违约预测模型
决策树(Decision Tree)分类技术是一种比较直观的用来分析不确定性事件的概率模型,属于数据挖掘技术中比较常见的一种方法。主要是用在分析和评价项目预期的风险和可行性的问题。决策树作为预测模型,从直观可以看作类似于一棵树,从树根到各个分支都可以看作一个如何分类的问题。枝干上的每一片树叶代表了具有分类功能的样本数据的分割。本次的实验将构建决策树模型来对客户是否违约进行预测分析。
此次实验的步骤如下:
1、导入实验相关的库:
#基础数据准备
import pandas as pd
import numpy as np

##可视化
import matplotlib.pyplot as plt
%matplotlib inline
import seaborn as sns
from pylab import mpl
mpl.rcParams['font.sans-serif'] = ['SimHei']
mpl.rcParams['axes.unicode_minus'] =False


## 根据卡方检验选取关联特征
from sklearn.feature_selection import SelectKBest
from sklearn.feature_selection import chi2
from sklearn.metrics import *

# 导入决策树分类模型
from sklearn.tree import DecisionTreeClassifier
- 1
- 2
- 3
- 4
- 5
- 6
- 7
- 8
- 9
- 10
- 11
- 12
- 13
- 14
- 15
- 16
- 17
- 18
- 19
- 20
2、数据导入
data = pd.read_excel(r'客户信息及违约表现.xlsx')
- 1
展示数据的前五条数据
data.head(5)
- 1
output:
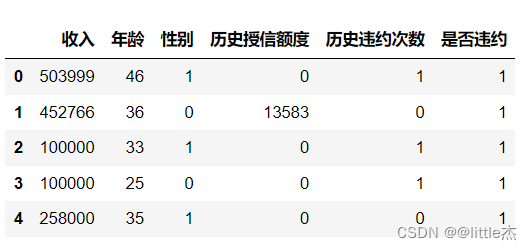
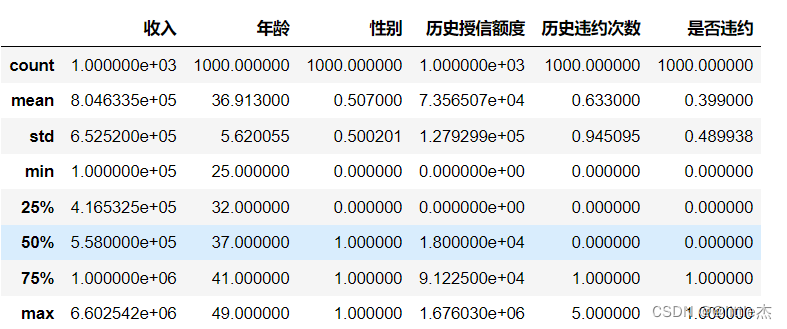
3、数据导入之后查看数据的情况(看是否是有缺失值,异常值)
data.describe()
- 1
data.isnull().sum()## 数据集没有缺失值
- 1
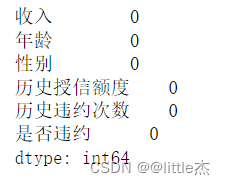
可以发现数据是没有缺失值的
4、特征工程:对收入数据和历史授信额度进行处理以及编码
首先对收入那一列的数据进行整理编码
data["收入"].describe()
- 1
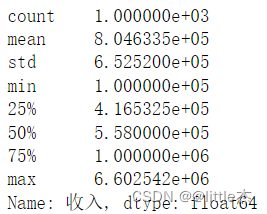
从上面的数据查看中我们可以发现收入最小是1.0*exp(5) ,最大是6.602542exp(6),我的想法是可以将其分成10个收入范围,每个范围分别用0,1,2,3,。。。。9来表示(也可以分为更多的类)
income_max = max(data["收入"])
income_min = min(data["收入"])
a = round((income_max-income_min)*0.1,2)

#定义一个给收入编码的函数getcode(x)
def getcode(x):
    if x>=income_min and x<income_min+a*1:
        return 0
    if x>=income_min+a*1 and x<income_min+a*2:
        return 1
    if x>=income_min+a*2 and x<income_min+a*3:
        return 2
    if x>=income_min+a*3 and x<income_min+a*4:
        return 3
    if x>=income_min+a*4 and x<income_min+a*5:
        return 4
    if x>=income_min+a*5 and x<income_min+a*6:
        return 5
    if x>=income_min+a*6 and x<income_min+a*7:
        return 6
    if x>=income_min+a*7 and x<income_min+a*8:
        return 7
    if x>=income_min+a*8 and x<income_min+a*9:
        return 8
    if x>=income_min+a*9 and x<=income_max:
        return 9


##对收入进行编码
data["income"]=data["收入"].apply(lambda x:getcode(x))
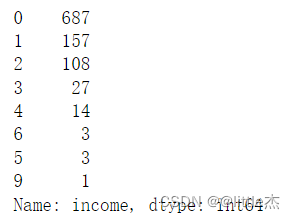
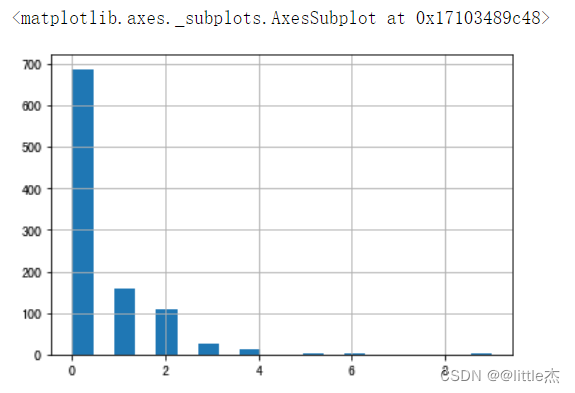
#查看收入的不同编码的个数并做数据可视化(直方图展示)
data["income"].value_counts()

data["income"].hist(bins=20)
- 1
- 2
- 3
- 4
- 5
- 6
- 7
- 8
- 9
- 10
- 11
- 12
- 13
- 14
- 15
- 16
- 17
- 18
- 19
- 20
- 21
- 22
- 23
- 24
- 25
- 26
- 27
- 28
- 29
- 30
- 31
- 32
- 33
- 34
- 35
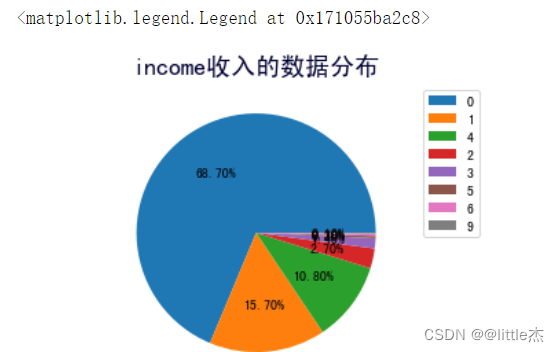
plt.axis("equal")#保证绘制的图形是一个圆,而不是一个椭圆
plt.title("income收入的数据分布",fontsize=18,color="#000033")
plt.pie(data["income"].value_counts(),autopct="%.2f%%",)
plt.legend(data["income"].unique())
``
`
对客户的收入信息预处理之后,对历史授信额度的数据进行编码
```python
data["历史授信额度"].describe()
- 1
- 2
- 3
- 4
- 5
- 6
- 7
- 8
- 9
- 10
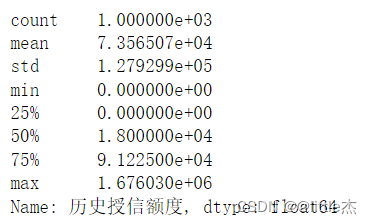
从上面可以发现最小是0 ,说明用户没有授权历史额度,将这种情况单独归为一类,可以将剩下的分成10个收入范围,每个范围分别用1,2,3,。。。。10来表示
credit_max = max(data["历史授信额度"])
credit_min = min(data["历史授信额度"])
credit_one = round((credit_max-credit_min)*0.1,2)##保留两位小数
print(credit_one)

#定义一个给历史授信额度编码的函数getCreditCode(x)
def getCreditCode(x):
    if x==0:
        return 0
    if x>credit_min and x<=credit_min+credit_one*1:
        return 1
    if x>credit_min+credit_one*1 and x<=credit_min+credit_one*2:
        return 2
    if x>credit_min+credit_one*2 and x<=credit_min+credit_one*3:
        return 3
    if x>credit_min+credit_one*3 and x<=credit_min+credit_one*4:
        return 4
    if x>credit_min+credit_one*4 and x<=credit_min+credit_one*5:
        return 5
    if x>credit_min+credit_one*5 and x<=credit_min+credit_one*6:
        return 6
    if x>credit_min+credit_one*6 and x<=credit_min+credit_one*7:
        return 7
    if x>credit_min+credit_one*7 and x<=credit_min+credit_one*8:
        return 8
    if x>credit_min+credit_one*8 and x<=credit_min+credit_one*9:
        return 9
    if x>credit_min+credit_one*9 and x<=credit_max:
        return 10


##对收入进行编码
data["credit"]=data["历史授信额度"].apply(lambda x:getCreditCode(x))
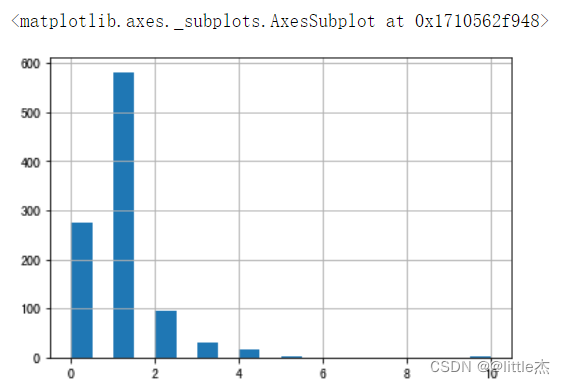
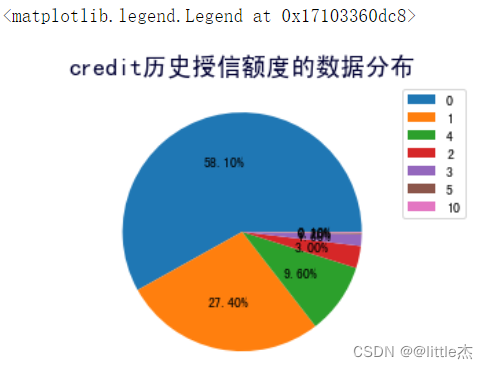
## 查看额度编码后的数据量(果然实际上的类别小于等于11,只有7个类别)
data["credit"].value_counts()
data["credit"].hist(bins=20)
- 1
- 2
- 3
- 4
- 5
- 6
- 7
- 8
- 9
- 10
- 11
- 12
- 13
- 14
- 15
- 16
- 17
- 18
- 19
- 20
- 21
- 22
- 23
- 24
- 25
- 26
- 27
- 28
- 29
- 30
- 31
- 32
- 33
- 34
- 35
- 36
- 37
plt.axis("equal")#保证绘制的图形是一个圆,而不是一个椭圆
plt.title("credit历史授信额度的数据分布",fontsize=18,color="#000033")
plt.pie(data["credit"].value_counts(),autopct="%.2f%%",)
plt.legend(data["credit"].unique())
- 1
- 2
- 3
- 4
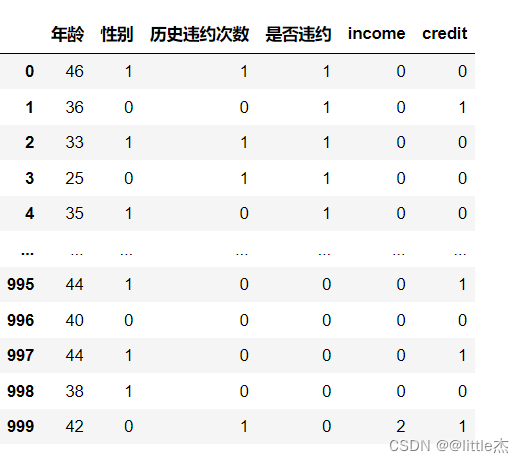
最后,将数据中收入和历史授信额度这两列数据剔除
data.drop(columns=["收入","历史授信额度"],inplace=True)
- 1
数据可视化查看:
data.hist(bins=20,figsize=(10,10))
- 1
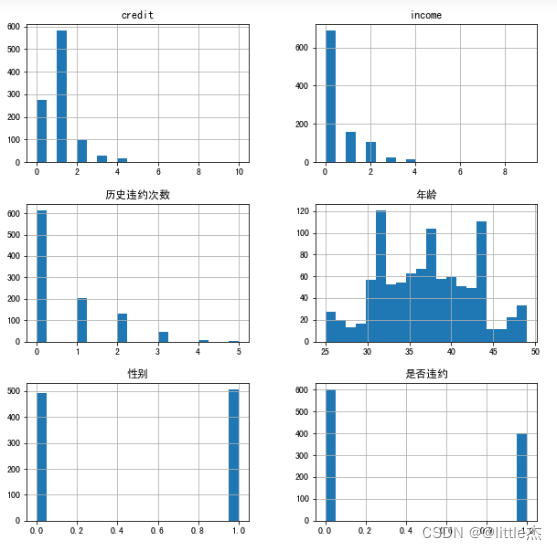
5、查看数据的分布是否均匀
data.groupby("是否违约").count()
- 1

可以发现为0的样本数量(未违约)占总样本的数量的3/5,为1的样本数量(违约)占总样本的数量的2/5, 说明两种特征的样本数量比较均衡,可以构建分类模型
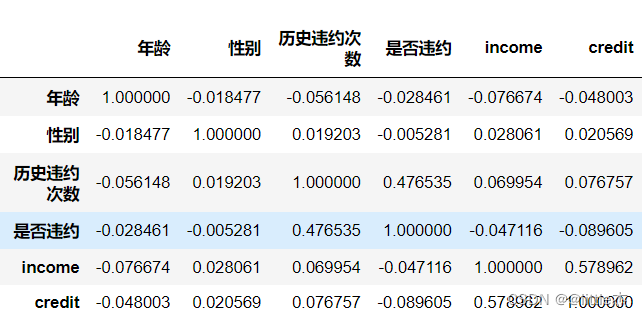
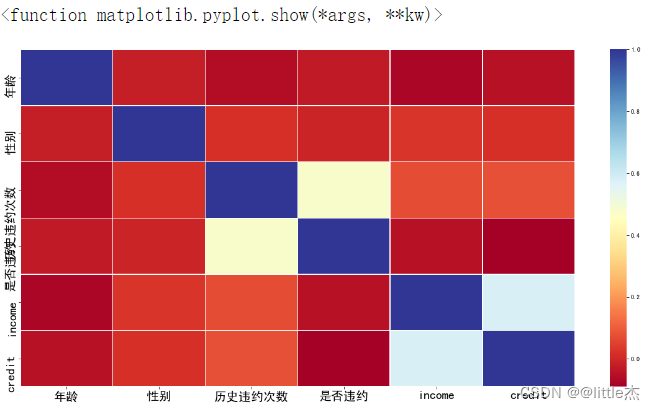
6、关联分析
## 计算协方差
dataCorr = data.corr()
dataCorr
- 1
- 2
- 3
## 热力图展现相关关系
import seaborn as sns

plt.rcParams['font.sans-serif'] = ['SimHei']
plt.rcParams['axes.unicode_minus'] = False

plt.figure(figsize=(20,10))
sns.heatmap(dataCorr,annot=False,fmt="float",linewidths=0.5,cmap="RdYlBu")
plt.tick_params(labelsize=20)
font1={'family':'Times New Roman',
      'weight':'normal',
       'size':20,
      }
plt.show
- 1
- 2
- 3
- 4
- 5
- 6
- 7
- 8
- 9
- 10
- 11
- 12
- 13
- 14
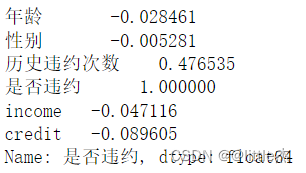
计算“是否违约”与其他特征变量的关系
dataCorr = data.corr()["是否违约"]
dataCorr
- 1
- 2
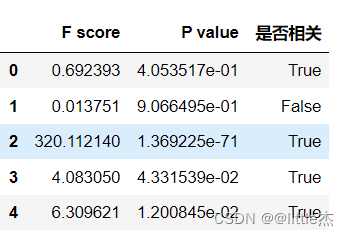
7、卡方检验
选择相关性较强的特征
## 1、卡方检验
dataFeature = data.drop(columns=['是否违约'])

## 根据卡方检验选取关联特征
from sklearn.feature_selection import SelectKBest
from sklearn.feature_selection import chi2
#选择k个最佳特征
s = SelectKBest(chi2,k=4).fit(dataFeature,data['是否违约'])

feat_scores=pd.DataFrame(index=[0,1,2,3,4])
feat_scores["F score"] = pd.DataFrame(s.scores_)
feat_scores["P value"] = pd.DataFrame(s.pvalues_)
feat_scores["是否相关"] = pd.DataFrame(s.get_support())

feat_scores
- 1
- 2
- 3
- 4
- 5
- 6
- 7
- 8
- 9
- 10
- 11
- 12
- 13
- 14
- 15
- 16
## 根据卡方检验选取关联特征
from sklearn.feature_selection import SelectKBest
from sklearn.feature_selection import chi2
name = []
feature = []
for i in dataFeature.columns:
    name.append(i)
X_new = SelectKBest(chi2,k=4).fit(dataFeature,data['是否违约'])
outcome = X_new.get_support()
for i in range(0,len(name)):
    if outcome[i]:
        feature.append(name[i])
result = pd.DataFrame({"特征":name,
                       "F score":feat_scores["F score"],
                      "P value":feat_scores["P value"],
                      "是否相关":outcome})

result
- 1
- 2
- 3
- 4
- 5
- 6
- 7
- 8
- 9
- 10
- 11
- 12
- 13
- 14
- 15
- 16
- 17
- 18
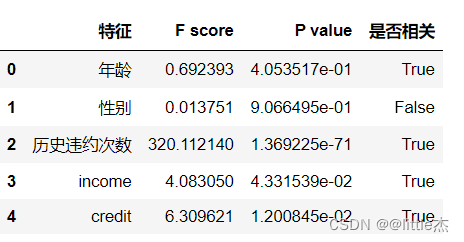
选取的预测特征为feature:[‘年龄’, ‘历史违约次数’, ‘income’, ‘credit’]
feature.append("是否违约")
dataFeatureSelect=data[feature]
dataFeatureSelect
- 1
- 2
- 3
8、模型的构建与评估
from sklearn.model_selection import train_test_split

#1 进行训练集和测试集的拆分
x_train,x_test = train_test_split(dataFeatureSelect,
                                  train_size=0.8,
                                  test_size=0.2,
                                  shuffle=True)
## 2、决策树模型构建
### 决策树模型既可以用作分类,又可以用作回归
# 导入相关的包
from sklearn.tree import DecisionTreeClassifier

dtc = DecisionTreeClassifier().fit(x_train.drop(
    columns=['是否违约']),
    x_train['是否违约'])
#绘制决策树图
from sklearn.tree import export_graphviz

export_graphviz(dtc,
               out_file="tree.dot",filled=True,rounded=True)

#以PDF格式输出决策树图
import graphviz
with(open("tree.dot")) as f:
    dot_graph=f.read()
dot=graphviz.Source(dot_graph)
dot.view()

## 3、利用模型进行预测

predictedTreeData = dtc.predict(x_test.drop(columns=['是否违约']))

## 4、对用户是否违约识别决策树模型进行评估
print("accuracy_score_tree:",accuracy_score(x_test['是否违约'],predictedTreeData))
print("precision_score_tree:",precision_score(x_test['是否违约'],predictedTreeData))
print("recall_score_tree:",recall_score(x_test['是否违约'],predictedTreeData))
- 1
- 2
- 3
- 4
- 5
- 6
- 7
- 8
- 9
- 10
- 11
- 12
- 13
- 14
- 15
- 16
- 17
- 18
- 19
- 20
- 21
- 22
- 23
- 24
- 25
- 26
- 27
- 28
- 29
- 30
- 31
- 32
- 33
- 34
- 35
- 36

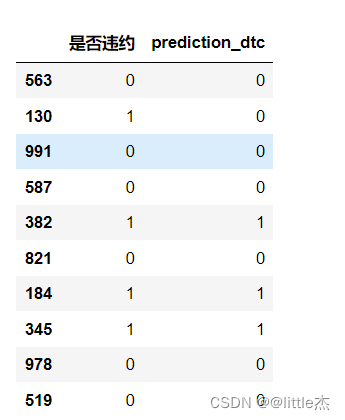
## 5、对测试集评判模型预测效果
df_predict_tree = pd.DataFrame(x_test,columns=['是否违约'])
df_predict_tree['prediction_dtc'] =predictedTreeData
df_predict_tree.head(10)
- 1
- 2
- 3
- 4
