- 1Vulnhub靶机:FunBox 8
- 2SpringBoot项目中使用SpringData-JPA持久化数据_项目中使用jpa
- 3django 模型数据类型_django模型数据类型
- 4MySQL基础~排序查询、聚合函数查询、Group by分组查询、limit分页_mysql如何让聚合函数在limit分页前进行
- 5请求封装(axios、fetch)
- 6jmeter-04创建请求
- 7面试官:如何处理高并发场景?_如何处理高并发问题面试
- 8php调用c dll,PHP中调用C/C++制作的动态链接库的教程
- 9react是什么?react和vue的区别?react有什么优点?_eva和react摸起来有什么区别?
- 102023前端面试题及答案整理(JS面试题)
Pyecharts一文速学-绘制桑基图详解+Python代码_python 桑基图
赞
踩
目录
4.pos_left/pos_top/pos_right/pos_bottom
前言
比起matplotlib,pyeacharts的图表要丰富而且好看,这取决于它是基于百度团队使用Javascript开发的商业级数据图表。而且pyechart文档全,便于开发和阅读文档,熟练掌握后是一种非常好用的数据可视化的工具之一。当然相比pandas的plot代码会繁琐一些,其中一些操作类方法也是比较复杂的,需要对其有个大概的掌握才能作出满意的图表。
此系列文章将被纳入我的专栏一文速学系列-Pyecharts数据可视化,基本覆盖到数据分析日常业务BI报表以及常规的数据可视化以及衍生图表方方面面的问题。从基础的数据图表操作逐步入门到复杂的图表BI制作等复杂操作,以及专业的Pyecharts常用函数参数讲解,我都将花费了大量时间和心思创作,如果大家有需要从事数据分析或者数据开发、数学建模、Python工程的朋友推荐订阅专栏,将在第一时间学习到最实用常用的知识。此篇博客篇幅较长,值得细读实践一番,我会将精华部分挑出细讲实践。博主会长期维护博文,有错误或者疑惑可以在评论区指出,感谢大家的支持。
一、桑基图
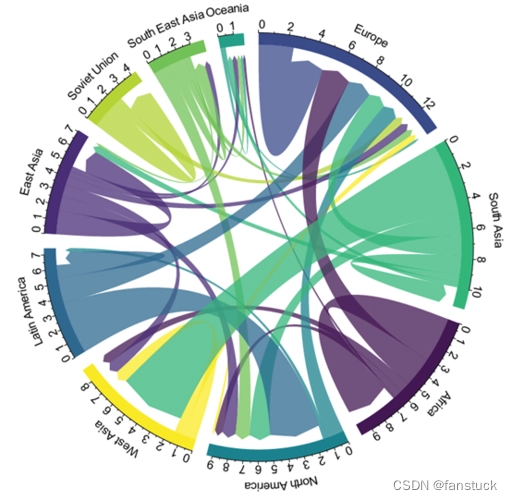
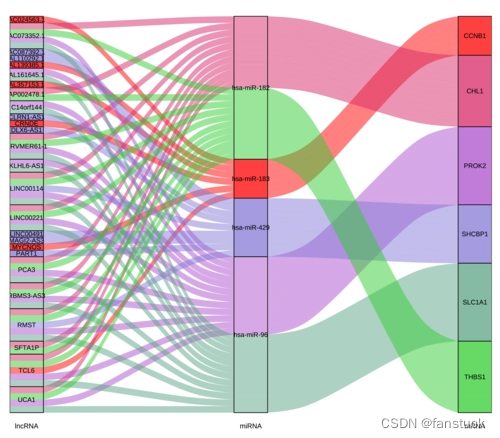
桑基图(Sankey diagram),即桑基能量分流图,也叫桑基能量平衡图。它是一种特定类型的流程图,右图中延伸的分支的宽度对应数据流量的大小,通常应用于能源、材料成分、金融等数据的可视化分析。因1898年Matthew Henry Phineas Riall Sankey绘制的“蒸汽机的能源效率图”而闻名,此后便以其名字命名为“桑基图”。
二、Pyecharts绘制
绘制桑基图需要有两个数据集,一个为nodes,一个为links。第一个数据集为记录每个节点的名称,另一个为描述每个节点之间的关系以及节点方块的大小。
- nodes = [
- {"name": "category1"},
- {"name": "category2"},
- {"name": "category3"},
- {"name": "category4"},
- {"name": "category5"},
- {"name": "category6"},
- ]
- links = [
- {"source": "category1", "target": "category2", "value": 10},
- {"source": "category2", "target": "category3", "value": 15},
- {"source": "category3", "target": "category4", "value": 20},
- {"source": "category5", "target": "category6", "value": 25},
- ]
我们以默认形式创建桑基图:
- from pyecharts import options as opts
- from pyecharts.charts import Sankey
-
- nodes = [
- {"name": "category1"},
- {"name": "category2"},
- {"name": "category3"},
- {"name": "category4"},
- {"name": "category5"},
- {"name": "category6"},
- ]
-
- links = [
- {"source": "category1", "target": "category2", "value": 10},
- {"source": "category2", "target": "category3", "value": 15},
- {"source": "category3", "target": "category4", "value": 20},
- {"source": "category5", "target": "category6", "value": 25},
- ]
- c = (
- Sankey()
- .add(
- "sankey",
- nodes,
- links,
- )
- .set_global_opts(title_opts=opts.TitleOpts(title="Sankey-基本示例"))
- .render_notebook()
- )
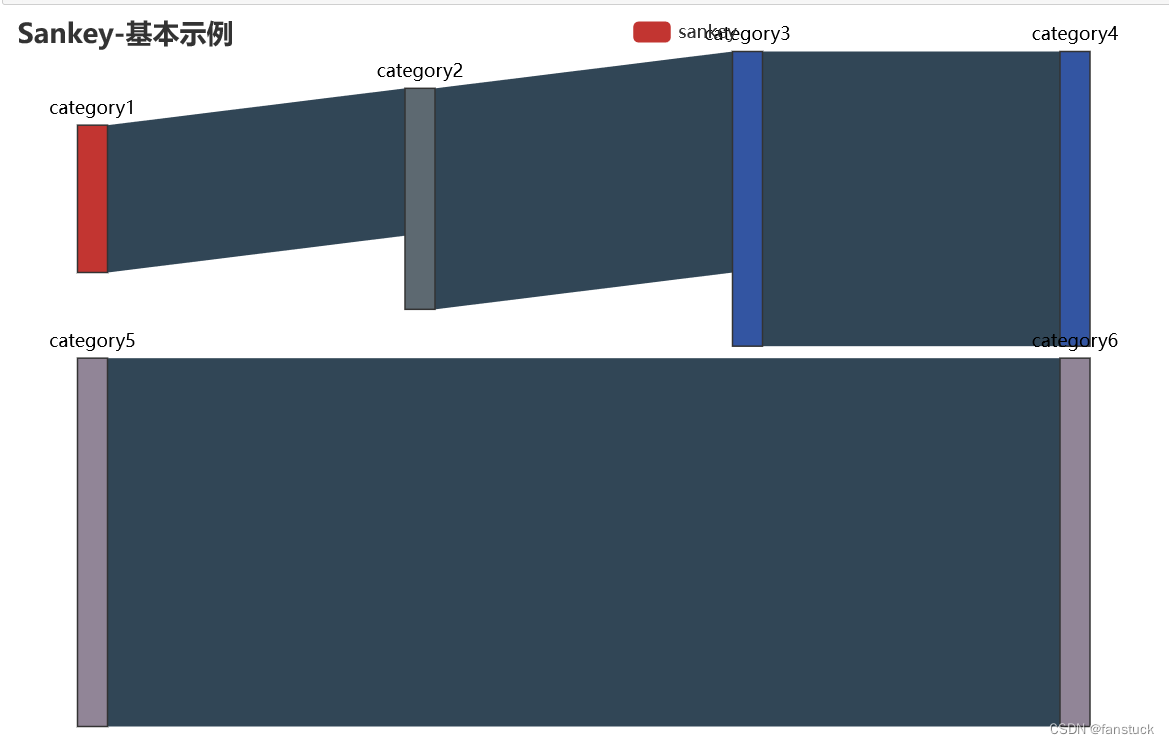
首先要实现桑基图要先把数据转换为桑基图支持的形式,当然这里不推荐手动转换,如果数据量多的话实在是太繁琐了,直接编写代码自动化实现。
1.数据处理
一般对于有桑基图的数据,都包含从属关系,那么一般的形式就比如两个列表。第一个列表为主要数据源,也就是第一个节点,当然这个数据集里面也包含平行的从属关系,就比如SQL血缘。一个数据表可能由其他数据表的字段组成。而第二个列表一般是与第一个列表数据相对应,也就是从属于第一个列表。首先我们都得将他们转换为数据节点,也就是转换为node_list。
- column_names=[['mfinish_time', 'mlink_id', 'msid', 'nlinkid', 'nctime', 'nlevel', 'nsids', 'mctime', 'morder_id', 'mid'], ['link_id', 'sid', 'id', 'order_id', 'm', 'frames', 'dt', 'finish_time', 'ctime'], ['sids', 'n', 'levels', 'linkid', 'gpstimes', 'dt', 'ctime']]
- table_names=['temp_road_check_20220902', 'dws_crowdsourcing_cs_order_link_mysql', 'track_point_traffic_dev_tk_track_traffic_info_offline']
这里必须要注意的一点就是当node_list存在重复的节点,那么最终桑基图将显示不出。故必须要对节点列表做去重处理。
也就是说我们最后的效果为:
- nodes=[
- {'name': 'temp_road_check_20220902'},
- {'name': 'dws_crowdsourcing_cs_order_link_mysql'},
- {'name': 'track_point_traffic_dev_tk_track_traffic_info_offline'},
- {'name': 'link_id'},
- {'name': 'sid'},
- {'name': 'id'},
- {'name': 'order_id'},
- {'name': 'm'},
- {'name': 'frames'},
- {'name': 'dt'},
- {'name': 'finish_time'},
- {'name': 'ctime'},
- {'name': 'sids'},
- {'name': 'n'},
- {'name': 'levels'},
- {'name': 'linkid'},
- {'name': 'gpstimes'}
- ]
- links=[
- {'source': 'temp_road_check_20220902',
- 'target': 'dws_crowdsourcing_cs_order_link_mysql',
- 'value': 10},
- {'source': 'temp_road_check_20220902',
- 'target': 'track_point_traffic_dev_tk_track_traffic_info_offline',
- 'value': 10},
- {'source': 'dws_crowdsourcing_cs_order_link_mysql',
- 'target': 'link_id',
- 'value': 5},
- {'source': 'dws_crowdsourcing_cs_order_link_mysql',
- 'target': 'sid',
- 'value': 5},
- {'source': 'dws_crowdsourcing_cs_order_link_mysql',
- 'target': 'id',
- 'value': 5},
- {'source': 'dws_crowdsourcing_cs_order_link_mysql',
- 'target': 'order_id',
- 'value': 5},
- {'source': 'dws_crowdsourcing_cs_order_link_mysql',
- 'target': 'm',
- 'value': 5},
- {'source': 'dws_crowdsourcing_cs_order_link_mysql',
- 'target': 'frames',
- 'value': 5},
- {'source': 'dws_crowdsourcing_cs_order_link_mysql',
- 'target': 'dt',
- 'value': 5},
- {'source': 'dws_crowdsourcing_cs_order_link_mysql',
- 'target': 'finish_time',
- 'value': 5},
- {'source': 'dws_crowdsourcing_cs_order_link_mysql',
- 'target': 'ctime',
- 'value': 5},
- {'source': 'track_point_traffic_dev_tk_track_traffic_info_offline',
- 'target': 'sids',
- 'value': 5},
- {'source': 'track_point_traffic_dev_tk_track_traffic_info_offline',
- 'target': 'n',
- 'value': 5},
- {'source': 'track_point_traffic_dev_tk_track_traffic_info_offline',
- 'target': 'levels',
- 'value': 5},
- {'source': 'track_point_traffic_dev_tk_track_traffic_info_offline',
- 'target': 'linkid',
- 'value': 5},
- {'source': 'track_point_traffic_dev_tk_track_traffic_info_offline',
- 'target': 'gpstimes',
- 'value': 5},
- {'source': 'track_point_traffic_dev_tk_track_traffic_info_offline',
- 'target': 'dt',
- 'value': 5},
- {'source': 'track_point_traffic_dev_tk_track_traffic_info_offline',
- 'target': 'ctime',
- 'value': 5}
- ]
实现起来也不难,做成通用方法即可:
-
- column_names=[['mfinish_time', 'mlink_id', 'msid', 'nlinkid', 'nctime', 'nlevel', 'nsids', 'mctime', 'morder_id', 'mid'], ['link_id', 'sid', 'id', 'order_id', 'm', 'frames', 'dt', 'finish_time', 'ctime'], ['sids', 'n', 'levels', 'linkid', 'gpstimes', 'dt', 'ctime']]
- table_names=['temp_road_check_20220902', 'dws_crowdsourcing_cs_order_link_mysql', 'track_point_traffic_dev_tk_track_traffic_info_offline']
-
- def data_process(table_names,column_names):
- list_table=[]
- list_columns=[]
- table_link_list=[]
- for i in range(len(table_names)):
- children_dict={"name":table_names[i]}
- list_table.append(children_dict)
- for i in range(1,len(column_names)):
- for j in range(len(column_names[i])):
- children_dict={"name":column_names[i][j]}
- list_columns.append(children_dict)
- nodes_list=list_table+list_columns
- nodes_list = [i for n, i in enumerate(nodes_list) if i not in nodes_list[:n]]
- leaf_num=len(nodes_list)-len(table_names)
- table_link_list=[]
- columns_link_list=[]
- for i in range(1,len(table_names)):
- table_link_dict={'source':table_names[0],'target':table_names[i],'value':10}
- table_link_list.append(table_link_dict)
- for i in range(1,len(table_names)):
- for j in range(len(column_names[i])):
- columns_link_dict={'source':table_names[i],'target':column_names[i][j],'value':5}
- columns_link_list.append(columns_link_dict)
- links_list=table_link_list+columns_link_list
- return nodes_list,links_list
- nodes_list,links_list=data_process(table_names,column_names)
- print(nodes_list)
- print(links_list)

实现了数据处理那么就来绘制桑基图已经参数调整吧。
2.桑基图参数
先来看不加任何参数的默认图例:
- Sankey_test=(
- Sankey()
- .add(
- "sankey",
- nodes_list,
- links_list,
- )
- .set_global_opts(title_opts=opts.TitleOpts(title="Sankey-基本示例"))
- .render_notebook()
- )
- Sankey_test

通过底图的数值我们发现其节点块的大小长度是依据其他子块的value数值叠加的,比如第一个节点的value为20,为其他两个节点的value之和。其余的节点也一样。
1.class Sankey()
初始化配置项,这块可以参考全局配置的InitOpts:
- class InitOpts(
- # 图表画布宽度,css 长度单位。
- width: str = "900px",
-
- # 图表画布高度,css 长度单位。
- height: str = "500px",
-
- # 图表 ID,图表唯一标识,用于在多图表时区分。
- chart_id: Optional[str] = None,
-
- # 渲染风格,可选 "canvas", "svg"
- # # 参考 `全局变量` 章节
- renderer: str = RenderType.CANVAS,
-
- # 网页标题
- page_title: str = "Awesome-pyecharts",
-
- # 图表主题
- theme: str = "white",
-
- # 图表背景颜色
- bg_color: Optional[str] = None,
-
- # 远程 js host,如不设置默认为 https://assets.pyecharts.org/assets/"
- # 参考 `全局变量` 章节
- js_host: str = "",
-
- # 画图动画初始化配置,参考 `global_options.AnimationOpts`
- animation_opts: Union[AnimationOpts, dict] = AnimationOpts(),
- )
2.class SankeyLevelsOpts()
其中有depth: 指定设置的是桑基图哪一层,取值从 0 开始。默认为None。
itemstyle_opts:桑基图指定层节点的样式。
linestyle_opts:桑基图指定层出边的样式。其中 lineStyle.color 支持设置为'source'或者'target'特殊值,此时出边会自动取源节点或目标节点的颜色作为自己的颜色。
- Sankey_test=(
- Sankey()
- .add(
- "sankey",
- nodes_list,
- links_list,
- levels=[
- opts.SankeyLevelsOpts(
- depth=0,
- itemstyle_opts=opts.ItemStyleOpts(color="#fbb4ae"),
- linestyle_opts=opts.LineStyleOpts(color="source", opacity=0.6),
- )
- ]
- )
- .set_global_opts(title_opts=opts.TitleOpts(title="Sankey-基本示例"))
- .render_notebook()
- )
- Sankey_test

- Sankey_test=(
- Sankey()
- .add(
- "sankey",
- nodes_list,
- links_list,
- levels=[
- opts.SankeyLevelsOpts(
- depth=0,
- itemstyle_opts=opts.ItemStyleOpts(color="#fbb4ae"),
- linestyle_opts=opts.LineStyleOpts(color="source", opacity=0.6),
- ),
- opts.SankeyLevelsOpts(
- depth=1,
- itemstyle_opts=opts.ItemStyleOpts(color="#b3cde3"),
- linestyle_opts=opts.LineStyleOpts(color="source", opacity=0.6),
- )
- ]
- )
- .set_global_opts(title_opts=opts.TitleOpts(title="Sankey-基本示例"))
- .render_notebook()
- )
- Sankey_test
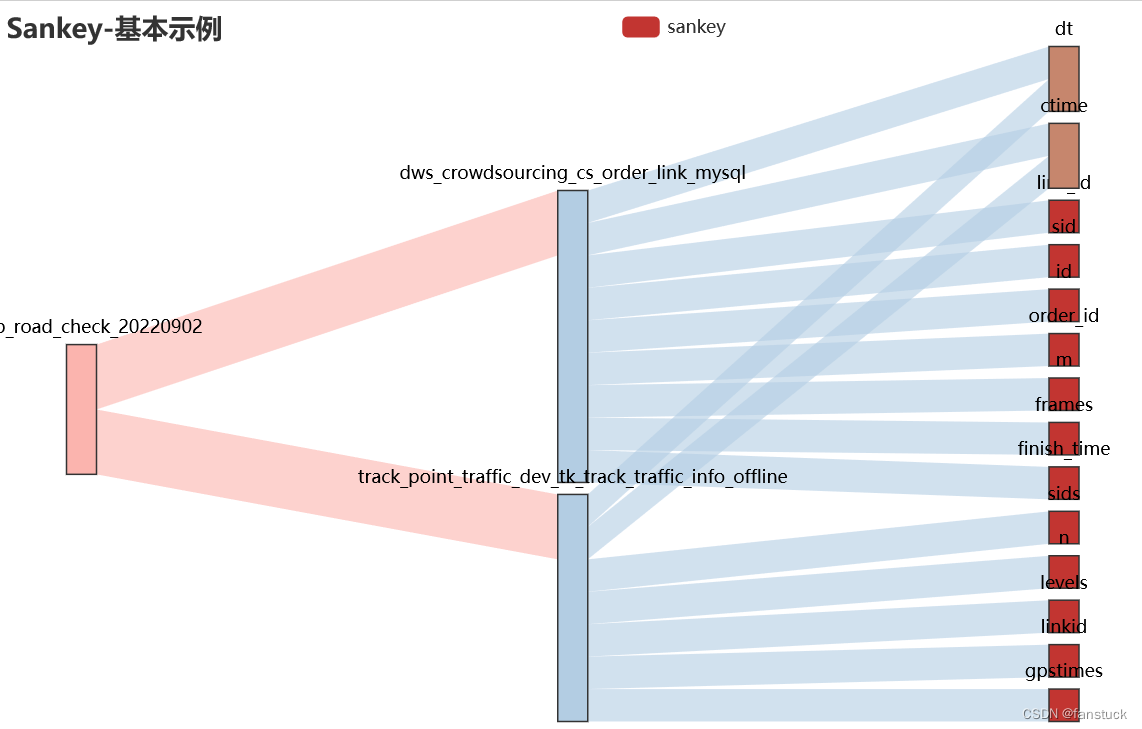
三.add()方法参数
1.series_name
用于展现在tooltip的显示,也可以1用于legend的图例筛选:

2.nodes/links
也就是节点和关系数据列表。
3.is_selected
is_selected=False 初始就为空:
4.pos_left/pos_top/pos_right/pos_bottom
pos_left:Sankey组件离容器左侧的距离,默认5%
pos_top:Sankey组件离容器左侧的距离,默认5%
pos_right:Sankey组件离容器右侧的距离,默认20%
pos_bottom:Sankey组件离容器下侧的距离,默认5%
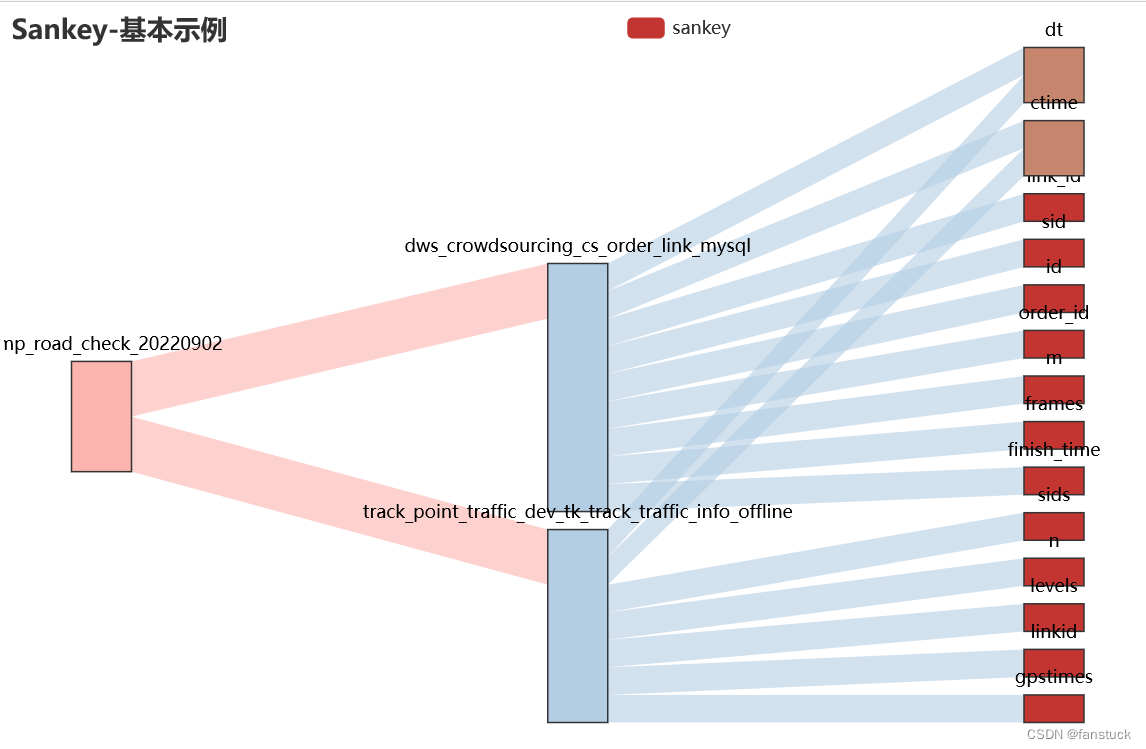
5.node_width/node_gap
node_width:桑基图中每个矩形的节点宽度,默认为20
node_gap:桑基图中每一列任意两个矩形节点之间的间隔,默认为0
- node_width=40,
- node_gap=12
6.layout_iterations
布局的迭代次数,用来不断优化图中节点的位置,以减少节点和边之间的相互遮盖。默认布局迭代次数为32.
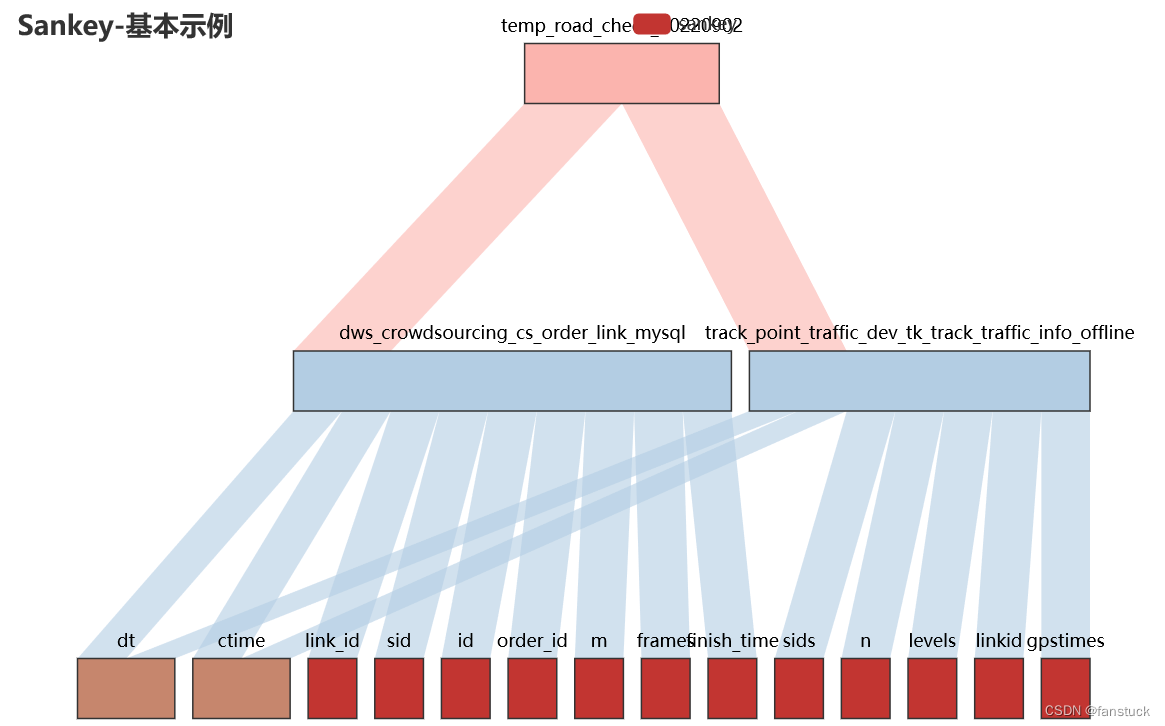
7.orient
桑基图中节点的布局方向,可以是水平的从左往右,也可以是垂直的从上往下。
对应的参数值分别是 horizontal, vertical,默认水平。orient='vertical':
8.is_draggable
控制节点拖拽的交互,默认开启。开启后,用户可以将图中任意节点拖拽到任意位置。若想关闭此交互,只需将值设为 false 就行了。
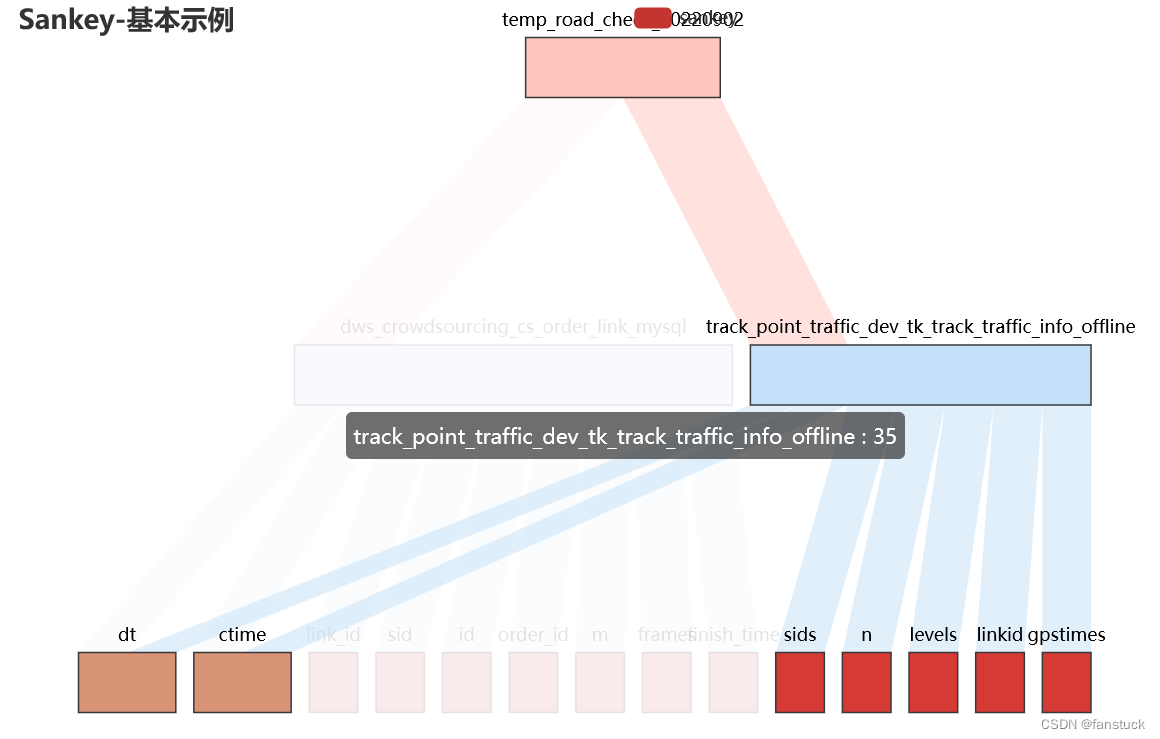
9.focus_node_adjacency
鼠标 hover 到节点或边上,相邻接的节点和边高亮的交互,默认关闭,可手动开启。
focus_node_adjacency=True:
点关注,防走丢,如有纰漏之处,请留言指教,非常感谢
以上就是本期全部内容。我是fanstuck ,有问题大家随时留言讨论 ,我们下期见


