
热门标签
热门文章
- 1uniapp小程序踩坑input样式问题_uniapp微信小程序 uni-easyinput修改placeholder样式
- 2Python - openpyxl Excel 操作示例与实践_valueerror: value must be one of {'hair', 'dashdot
- 3无人驾驶(移动机器人)路径规划之A star(Tie Breaker)算法及其matlab实现_机器人路径规划算法代码
- 4Springboot 通过流返回文件_springboot接口返回文件流
- 5Appium+Python移动端(Android)自动化测试环境搭建(经典详细)_linux android appium python自动化测试
- 6SQL Server数据库常用语句及作用查询,太赞了_sql server基本语句和功能
- 7huggingface资料分享_bert-base-uncased网盘
- 8CSDN流量扶持参与规则说明
- 9自然语言处理入门(4)——中文分词原理及分词工具介绍_文本分词的详细过程
- 10《构建中小型网络实训》实训课程_某企业需要建设一个综合的企业网,公司有4个部门,从内网的安全考虑,使用vlan技
当前位置: article > 正文
echarts多个折线柱状图基本使用_echarts 多维柱状 折线图
作者:Li_阴宅 | 2024-07-16 14:36:34
赞
踩
echarts 多维柱状 折线图
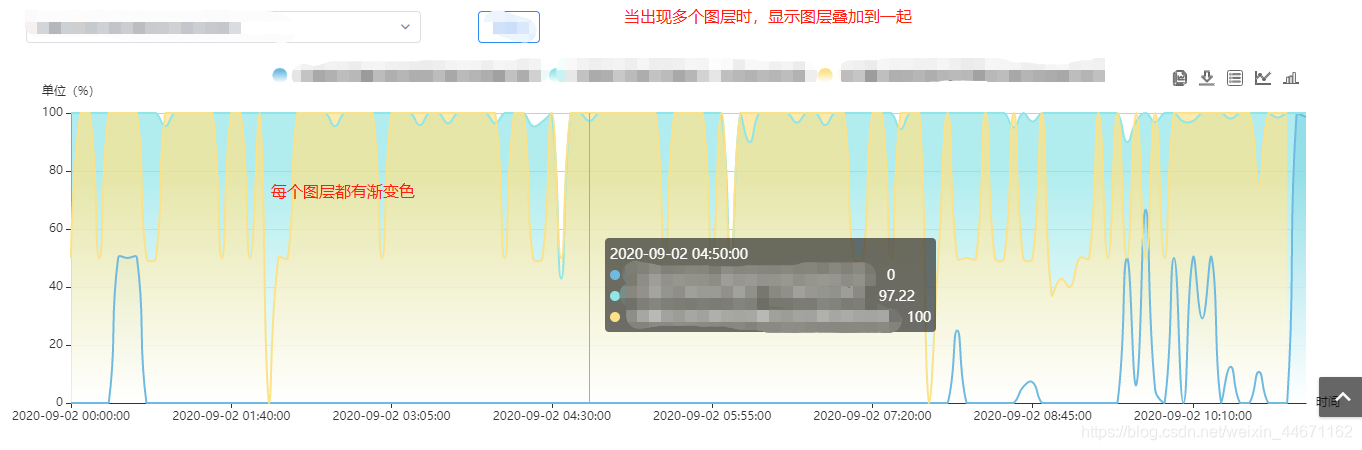
要的效果
可以根据条件获取数据并渲染成图层
图层可以叠加
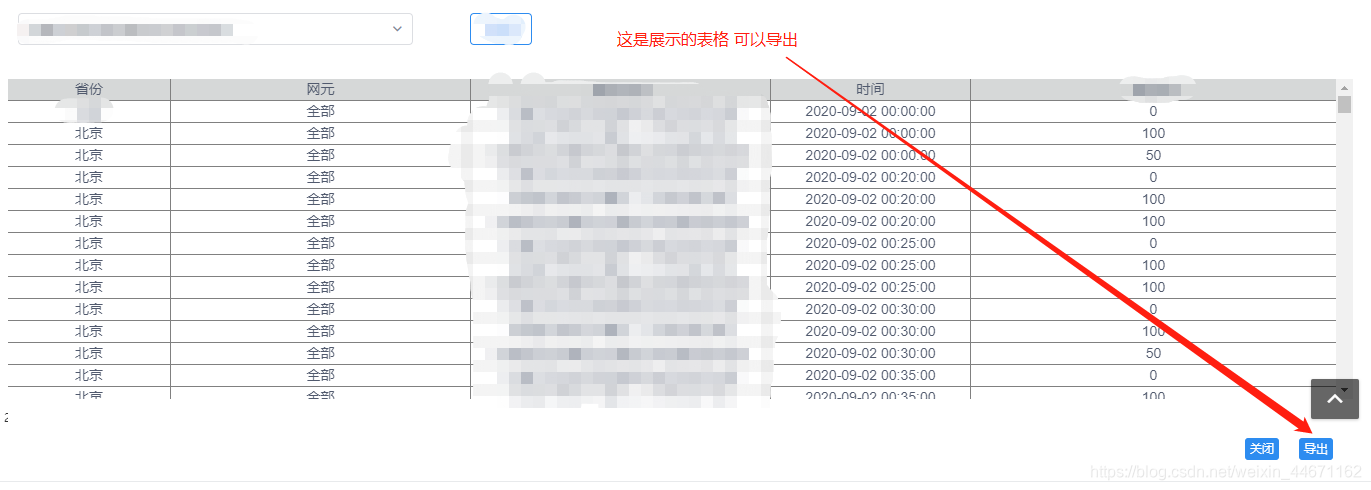
图层可以转成表格并支持导出
图层可以柱状图和折线图相互转换
折线图的
转换成圆点 自定义
不显示数据上的圆点
改变折线图的折线颜色
效果1

效果2
效果3
效果4

操作
vue ——iview——echarts
话不多少说!
初始化代码
html
    <Row style="margin-top: 20px;">
      <div id="shouName" ref="dom" style="height: 400px;" v-show="isShow"></div>
      <div style="font-weight: 900;text-align:center " v-show="! isShow">暂无数据</div>
    </Row>
- 1
- 2
- 3
- 4
基本数据初始化
export default {
	name:'xxx',
	data() {
		return {
			// 自己的其他代码
			                lineGradient: [
                    ['#fff', '#6fbae1'],
                    ['#fff', '#90e5e7'],
                    ['#fff', '#fbe289'],
                    ['#fff', '#af17ff'],
                    ['#fff', '#fbb8a1'],
                    ['#fff', '#e58dc2'],
                    ['#fff', '#ffa800'],
                    ['#fff', '#ff000c'],
                ],
                histogramGradient: [
                    ['#fff', '#6fbae1'],
                    ['#fff', '#90e5e7'],
                    ['#fff', '#fbe289'],
                    ['#fff', '#8311BF'],
                    ['#fff', '#fbb8a1'],
                    ['#fff', '#e58dc2'],
                    ['#fff', '#BF7E00'],
                    ['#fff', '#BF0009'],
                ],
			 option: {
                    title: {
                        text: '',
                        left: 'left'
                    },
                    tooltip: {
                        trigger: 'axis',
                        axisPointer: {
                            type: 'cross',
                            label: {
                                backgroundColor: '#6a7985'
                            }
                        },
                    },
                    grid: {
                        left: '3%',
                        right: '2%',
                        bottom: '3%',
                        containLabel: true
                    },
                    xAxis: [
                        {
                            type: 'category',
                            boundaryGap: false,
                            data: []
                        }
                    ],
                    yAxis: [
                        {
                            name: '',
                            type: 'value'
                        }
                    ],
                    series: []
                }
			}
		}
	}

- 1
- 2
- 3
- 4
- 5
- 6
- 7
- 8
- 9
- 10
- 11
- 12
- 13
- 14
- 15
- 16
- 17
- 18
- 19
- 20
- 21
- 22
- 23
- 24
- 25
- 26
- 27
- 28
- 29
- 30
- 31
- 32
- 33
- 34
- 35
- 36
- 37
- 38
- 39
- 40
- 41
- 42
- 43
- 44
- 45
- 46
- 47
- 48
- 49
- 50
- 51
- 52
- 53
- 54
- 55
- 56
- 57
- 58
- 59
- 60
- 61
- 62
- 63
初始化页面完成后 方法
        mounted() {
            let vm = this
            this.$nextTick(() => {
                this.dom = echarts.init(this.$refs.dom)
                vm.option = {
                    legend: {
                        data: []
                    },
                    tooltip: {
                        trigger: 'axis',
                        formatter: function (params) {
                            var htmlStr = ''
                            htmlStr += params[0].name + '<br/>' // x轴的名称
                            for (let i = 0; i < params.length; i++) {
                                let cood = params[i].color.colorStops[0].color  // 取自表格中的颜色  可自定义
                                htmlStr += '<span style="margin-right:5px;display:inline-block;width:10px;height:10px;border-radius:5px;background-color:' +
                                    cood + ';"></span>'
                                // 添加一个汉字,这里你可以格式你的数字或者自定义文本内容
                                htmlStr += '<span style="margin-left:5px;">' + params[i].seriesName + ':' + '</span>' + ' ' + params[i].value + '<br> '
                            }
                            htmlStr += '</div>'
                            return htmlStr
                        }
                    },
                    toolbox: {
                        show: true,
                        right: '60',
                        feature: {
                            // 叠加
                            myTool3: {
                                show: true,
                                title: '叠加',
                               //  这是自定义图标  来自 阿里图库的图标
                                icon: 'path://M708.007651 63.983243h-336.012823c-59.251475 0-112.00598 54.377468-112.00598 112.003934l-32.370245 0.783852c-59.249429 0-107.635439 53.594639-107.63544 111.221104v560.021714c0 57.628512 52.754504 112.003933 112.003934 112.003933h420.018075c59.249429 0 112.003933-54.375421 112.003934-112.003933h28.000727c59.251475 0 112.003933-54.375421 112.003934-112.00598V288.663422L708.007651 63.983243z m-56.002479 840.032059H231.98812c-29.401634 0-56.002478-27.493168-56.002478-56.002479V287.992133c0-28.507264 23.969924-55.107085 53.371558-55.107085l30.688953-0.896416v504.018211c0 57.630558 52.754504 112.00598 112.003933 112.00598H708.059839c-0.052189 28.561499-26.710338 56.002478-56.054667 56.002479z m196.00714-168.008459c0 28.508287-26.599821 56.002478-56.002479 56.002479h-420.016029c-29.401634 0-56.004525-27.493168-56.004525-56.002479V175.987177c0-28.506241 26.601868-56.003502 56.004525-56.003502h280.010345c-0.448208 64.514339 0 112.731504 0 112.731504 0 58.187237 52.358485 111.278409 112.003934 111.278409h84.003205v392.013255zM764.009106 287.992133c-29.847795 0-56.002478-54.155411-56.002478-83.277681v-83.890643L848.012312 287.992133h-84.003206z m-334.111521 101.988836c0-8.824993-7.139607-15.96767-15.965623-15.96767s-15.96767 7.141654-15.96767 15.96767v223.375463c0 8.789177 7.141654 15.933901 15.96767 15.933901h350.956164c8.826016 0 19.037589-7.144724 19.079544-15.933901 0-8.81783-10.216689-15.96153-19.037589-15.96153H429.897585v-207.413933z m307.587424 28.529777c-0.453325 0.487094-0.639566 1.085728-1.050935 1.607614l-75.233472 75.232448-76.126818-76.130911c-0.182149-0.222057-0.264013-0.483001-0.448208-0.708128-6.242168-6.245238-16.376992-6.245238-22.626323 0-0.448208 0.487094-0.63138 1.085728-1.043773 1.607614l-86.709851 86.710874c-6.099928 6.094812-6.099928 16.006556 0 22.101367 6.091742 6.095835 15.999392 6.095835 22.095228 0l77.102029-77.140914 74.561159 74.557066c0.559748 0.859577 0.973164 1.834788 1.717108 2.582825 6.093788 6.095835 16.005532 6.095835 22.103414 0l85.622076-85.630263c0.933255-0.632403 1.836835-1.309832 2.65855-2.169409 6.246261-6.242168 6.246261-16.375969 0-22.620183-6.243191-6.245238-16.378016-6.245238-22.620184 0z',
                                onclick: function () {
                                // 自定义处理方法
                               // 本次使用的是  iview 的Modal  (对话框)
                                    vm.getItemsAddS()
                                }
                            },
                            // 这个是下载图片
                            saveAsImage: {
                             //  这是自定义图标  来自 阿里图库的图标
                                icon: 'path://M512 785.066667c-8.738133 0-17.476267-3.345067-24.1664-9.966933l-341.333333-341.333333C136.738133 423.936 133.802667 409.326933 139.127467 396.561067 144.384 383.7952 156.8768 375.466667 170.666667 375.466667L341.333333 375.466667 341.333333 68.266667c0-18.8416 15.291733-34.133333 34.133333-34.133333l273.066667 0C667.374933 34.133333 682.666667 49.425067 682.666667 68.266667l0 307.2 170.666667 0c13.789867 0 26.282667 8.328533 31.5392 21.0944s2.321067 27.4432-7.3728 37.205333l-341.333333 341.333333C529.476267 781.7216 520.738133 785.066667 512 785.066667zM253.064533 443.733333 512 702.6688 770.935467 443.733333 648.533333 443.733333C629.691733 443.733333 614.4 428.4416 614.4 409.6L614.4 102.4 409.6 102.4 409.6 409.6c0 18.8416-15.291733 34.133333-34.133333 34.133333L253.064533 443.733333zM989.866667 989.866667l-955.733333 0C15.291733 989.866667 0 974.574933 0 955.733333s15.291733-34.133333 34.133333-34.133333l955.733333 0c18.8416 0 34.133333 15.291733 34.133333 34.133333S1008.708267 989.866667 989.866667 989.866667z'
                            },
                            //   这是表格
                            dataView: {
                                readOnly: false,
                                 //  这是自定义图标  来自 阿里图库的图标
                                icon: 'path://M903.873 0H120.127A120.127 120.127 0 0 0 0 120.127v783.746A120.127 120.127 0 0 0 120.127 1024h783.746A120.127 120.127 0 0 0 1024 903.873V120.127A120.127 120.127 0 0 0 903.873 0zM198.126 822.954a61.732 61.732 0 1 1 61.732-61.732 61.732 61.732 0 0 1-61.732 61.732z m0-250.265a61.732 61.732 0 1 1 61.732-61.732 61.732 61.732 0 0 1-61.732 62.566z m0-250.265a61.732 61.732 0 1 1 61.732-60.063 61.732 61.732 0 0 1-61.732 61.732z m654.026 467.578H365.387a35.454 35.454 0 1 1 0-70.49h486.765a35.454 35.454 0 1 1 0 70.49z m0-250.264H365.387a35.454 35.454 0 0 1 0-70.492h486.765a35.454 35.454 0 1 1 0 70.492z m0-250.265H365.387a35.454 35.454 0 1 1 0-70.491h486.765a35.454 35.454 0 1 1 0 70.49z',
                                optionToContent: function (opt) {
                                    var axisData = opt.xAxis[0].data // x 周数据
                                    var series = opt.series //  y轴数据
                                    var table = '<table style="width:100%;text-align:center;" frame="border;" rules="all"><tbody><tr style="background-color:#d6d8d8">' +
                                        '<td >名称1</td>' +
                                        '<td style="width: 300px;">名称2</td>' +
                                        '<td style="width: 300px;">名称3</td>' +
                                        '<td style="width: 200px;">时间4</td>' +
                                        '<td>' + '名称5' + '</td>' +
                                        '</tr>'
                                    for (var i = 0, l = axisData.length; i < l; i++) {
                                        // 这里边再次循环,结果 是将多个进行展示
                                        for (let j = 0; j < series.length; j++) {
                                            table += '<tr>' +
                                                '<td>' +名称对应的数值1 + '</td>' +
                                                '<td>' + 名称对应的数值 2+ '</td>' +
                                                '<td>' + 名称对应的数值 3+ '</td>' +
                                                '<td>' +名称对应的数值4+ '</td>' +
                                                '<td>' + 名称对应的数值 5+ '</td>' +
                                                '</tr>'
                                        }
                                    }
                                    table += '</tbody></table>'
                                // 可自行略过    此方法作用是 在1800分辨下 表格没有遮挡住图表的头部信息
                                    let nameid = setInterval(function () {
					                    let opt = document.getElementById("shouName")
					                    if (opt.children[2]) {
					                        opt.children[2].style['margin-top'] = '-1px'
					                        clearTimeout(nameid)
					                    }
					                }, 100)
                                    return table
                                },
                                lang: [' ', '关闭', '导出'],
                                buttonColor: '#2d8cf0',
                                contentToOption: function () {
                               //  将数据装换成表格的方法   自定义吧
                                   //  vm.exportData()
                                }
                            },
                            myTool2: {
                                show: true,
                                title: '折线图',
                                 //  这是自定义图标  来自 阿里图库的图标
                                icon: 'path://M929.28 896 65.28 896 65.28 623.68l184.448-184.448C261.76 444.736 275.072 448 289.28 448s27.456-3.264 39.552-8.768l129.216 129.216C452.48 580.48 449.28 593.856 449.28 608c0 52.992 43.008 96 96 96s96-43.008 96-96c0-14.144-3.264-27.52-8.768-39.552l317.44-317.44c13.824-13.76 13.824-36.096 0-49.92-13.76-13.76-36.096-13.76-49.92 0L581.76 519.296C570.496 514.624 558.208 512 545.28 512S520 514.624 508.736 519.296L377.984 388.48C382.656 377.28 385.28 364.928 385.28 352c0-52.992-43.008-96-96-96s-96 43.008-96 96c0 12.928 2.624 25.28 7.296 36.48L65.28 523.84 65.28 160c0-17.664-14.336-32-32-32s-32 14.336-32 32l0 437.312c-0.832 4.288-0.832 8.576 0 12.864L1.28 928c0 17.664 14.336 32 32 32l896 0c17.664 0 32-14.336 32-32S946.944 896 929.28 896zM545.28 576c17.664 0 32 14.336 32 32S562.944 640 545.28 640s-32-14.336-32-32S527.552 576 545.28 576zM289.28 320c17.664 0 32 14.336 32 32S306.944 384 289.28 384s-32-14.336-32-32S271.552 320 289.28 320z',
                                onclick: function () {
                               // 作用 如果是多个图层,将多个图层都转换的折线、柱状图    (下边一样)
                                    let leng = vm.option.series.length
                                    for (let i = 0; i < leng; i++) {
                                        vm.option.series[i].type = 'line'
                                    }
                                    vm.typell = 'line'
                                    vm.option.legend.data.forEach(item => {
                                        item.icon = 'pin'
                                    })
                                    vm.dom.setOption(vm.option)
                                }
                            },
                            myTool1: {
                                show: true,
                                title: '柱状图',
                                 //  这是自定义图标  来自 阿里图库的图标
                                icon: 'path://M930.5 781.7H774.2c0.1-1.4 0.4-2.7 0.4-4V223.9c0-22.4-18.1-40.5-40.5-40.5h-67.8c-22.4 0-40.5 18.1-40.5 40.5v553.7c0 1.4 0.3 2.7 0.4 4h-42.7c0-0.4 0.1-0.8 0.1-1.2V429c0-22.4-18.1-40.5-40.5-40.5h-65c-22.4 0-40.5 18.1-40.5 40.5v351.5c0 0.4 0.1 0.8 0.1 1.2h-47.9V502c0-22.4-18.1-40.5-40.5-40.5h-59.4c-22.4 0-40.5 18.1-40.5 40.5v279.7H93.5c-16.3 0-29.5 13.2-29.5 29.5s13.2 29.5 29.5 29.5h837c16.3 0 29.5-13.2 29.5-29.5 0-16.4-13.2-29.5-29.5-29.5z',
                                onclick: function () {
                                    let leng = vm.option.series.length
                                    for (let i = 0; i < leng; i++) {
                                        vm.option.series[i].type = 'bar'
                                    }
                                    vm.typell = 'bar'
                                    vm.option.legend.data.forEach(item => {
                                        item.icon = 'rect'
                                    })
                                    vm.dom.setOption(vm.option)
                                }
                            }
                        }
                    },
                    xAxis: {
                        name: '时间',
                        nameGap: '10',
                        type: 'category',
                        boundaryGap: false,
                        data: []
                    },
                    yAxis: [
                        {
                         // y轴的名称  自定义  vm.uity
                            name: '单位(' + vm.uity + ')',
                            type: 'value'
                        }
                    ],
                    // 图居 顶,左,右,下,的距离
                    grid: {
                        right: '60',
                        left: '60',
                        top: '50'
                    },
                    series: []
                },
                    vm.dom.setOption(vm.option)
            })
        },
- 1
- 2
- 3
- 4
- 5
- 6
- 7
- 8
- 9
- 10
- 11
- 12
- 13
- 14
- 15
- 16
- 17
- 18
- 19
- 20
- 21
- 22
- 23
- 24
- 25
- 26
- 27
- 28
- 29
- 30
- 31
- 32
- 33
- 34
- 35
- 36
- 37
- 38
- 39
- 40
- 41
- 42
- 43
- 44
- 45
- 46
- 47
- 48
- 49
- 50
- 51
- 52
- 53
- 54
- 55
- 56
- 57
- 58
- 59
- 60
- 61
- 62
- 63
- 64
- 65
- 66
- 67
- 68
- 69
- 70
- 71
- 72
- 73
- 74
- 75
- 76
- 77
- 78
- 79
- 80
- 81
- 82
- 83
- 84
- 85
- 86
- 87
- 88
- 89
- 90
- 91
- 92
- 93
- 94
- 95
- 96
- 97
- 98
- 99
- 100
- 101
- 102
- 103
- 104
- 105
- 106
- 107
- 108
- 109
- 110
- 111
- 112
- 113
- 114
- 115
- 116
- 117
- 118
- 119
- 120
- 121
- 122
- 123
- 124
- 125
- 126
- 127
- 128
- 129
- 130
- 131
- 132
- 133
- 134
- 135
- 136
- 137
- 138
- 139
- 140
- 141
- 142
- 143
- 144
- 145
- 146
- 147
- 148
- 149
- 150
- 151
- 152
获取数据并将数据放到 图中
methods:{
	            showdata(data) {
	//	            data 的数据结构为
	//	           格式1
	//	            {
	//				'2020-20-20 20:20': [1]
	//				}
	//				  格式2
	//				{
	//				'2020-20-20 20:20': [1,2]
	//				}
                let vm = this
                console.log(data)
                let xdata = new Array()
                let ydata = new Array()
                let map = new Array()
                let list1 = new Array()
                let TableList = new Array()
                let legend = new Array()
                vm.isShow = false
                // 判断传过来的数据是否为空
                if (Object.keys(data).length > 0) {
                    for (var a in data) {
                        xdata.push(a)
                        ydata.push(data[a])
                    }
                    // 当多个图层叠加
                    for (let i = 0; i < ydata.[0].length; i++) {
                        let a = new Array()
                        ydata.forEach(item3 => {
                            a.push(item3[i])
                        })
                        list1.push(a)
                    }
                    if (list1.length === 1) {
                    //  当是一个图层时,名称是一个值  vm.networkElementType  自定义
                        TableList.push(vm.networkElementType)
                    } else {
                 //     vm.listOfCurrentlyDisplayedLayers 这是获取好的名称集合格式如下
                 //     ['名称1','名称2','名称3','名称4','名称5']
                        TableList = vm.listOfCurrentlyDisplayedLayers
                    }
                    for (let i = 0; i < list1.length; i++) {
                        let item = list1[i]
                        let opt = {
                            name: TableList[i],
                            stack: TableList[i],
                            type: vm.typell,
                            symbol: 'none', // 这个是不显示圆点
                            showAllSymbol: false,
                            showSymbol: false,
                            smooth: true, // 折现图圆角弧度
                            areaStyle: {
                                normal: {
                                    color: new echarts.graphic.LinearGradient(0, 0.2, 0, 1, [
                                        {
                                            offset: 0,
                                          //  这是之前定义好的颜色集合   lineGradient  格式如下\
                                          //                 lineGradient: [  ['#fff', '#6fbae1'],  ['#fff', '#90e5e7'] ],
                                            color: vm.lineGradient[i][1]
                                        },
                                        {
                                            offset: 1,
                                            color: vm.lineGradient[i][0]
                                        }
                                    ])
                                },
                            },
                            itemStyle: {
                                normal: {
                                    color: new echarts.graphic.LinearGradient(0, 0.2, 0, 1,
                                        [
                                        //  这是之前定义好的颜色集合   lineGradient  格式如下\
                                          //   histogramGradient: [  ['#fff', '#6fbae1'],  ['#fff', '#90e5e7'] ],
                                            {offset: 0, color: vm.histogramGradient[i][1]}, // 柱图渐变色
                                            {offset: 1, color: vm.histogramGradient[i][0]} // 柱图渐变色
                                        ]
                                    ),
                                    lineStyle: {
                                        color: vm.histogramGradient[i][1] //改变折线颜色
                                    }
                                }
                            },
                            data: item,
                              markLine: {
				                  data: [
					                  {
					                    yAxis: 自定义的一个值,
					                    name: '限定值',
					                    symbol: 'circle',
					                    type: 'average',
					                    lineStyle: { // 指示线的样式  虚实和颜色
					                      // type: 'solid',
					                      color: 'red',
					                      width:'2'
					                    }
					                  },
					                  {
					                    yAxis: 自定义的一个值2,
					                    name: '限定值2',
					                    symbol: 'circle',
					                    type: 'average',
					                    lineStyle: { // 指示线的样式  虚实和颜色
					                      // type: 'solid',
					                      color: 'red',
					                      width:'2'
					                    }
					                  },
				                  ]
				                },
                        }
                        map.push(opt)
                    }
                    console.log(map)
                    // 柱状图和折线图 的图标
                    for (let i = 0; i < TableList.length; i++) {
                        let a = vm.typell === 'line' ? 'pin' : 'rect'
                        legend.push({
                            name: TableList[i],
                            icon: a,
                            textStyle: {
                                fontWeight: '900',
                                fontSize: '14'
                            }
                        })
                    }
                }
                console.log()
                vm.dom.clear()
                vm.option.series = map
                vm.option.xAxis.data = xdata
                vm.option.legend.data = legend
                vm.option.yAxis[0].name = '单位(' + vm.uity + ')'
                vm.dom.setOption(vm.option)
                vm.$emit('updatespinShowdata', false)
                if (ydata.length > 0) {
                    vm.isShow = true
                }
            },
	}
- 1
- 2
- 3
- 4
- 5
- 6
- 7
- 8
- 9
- 10
- 11
- 12
- 13
- 14
- 15
- 16
- 17
- 18
- 19
- 20
- 21
- 22
- 23
- 24
- 25
- 26
- 27
- 28
- 29
- 30
- 31
- 32
- 33
- 34
- 35
- 36
- 37
- 38
- 39
- 40
- 41
- 42
- 43
- 44
- 45
- 46
- 47
- 48
- 49
- 50
- 51
- 52
- 53
- 54
- 55
- 56
- 57
- 58
- 59
- 60
- 61
- 62
- 63
- 64
- 65
- 66
- 67
- 68
- 69
- 70
- 71
- 72
- 73
- 74
- 75
- 76
- 77
- 78
- 79
- 80
- 81
- 82
- 83
- 84
- 85
- 86
- 87
- 88
- 89
- 90
- 91
- 92
- 93
- 94
- 95
- 96
- 97
- 98
- 99
- 100
- 101
- 102
- 103
- 104
- 105
- 106
- 107
- 108
- 109
- 110
- 111
- 112
- 113
- 114
- 115
- 116
- 117
- 118
- 119
- 120
- 121
- 122
- 123
- 124
- 125
- 126
- 127
- 128
- 129
- 130
- 131
- 132
- 133
- 134
- 135
- 136
- 137
- 138
- 139
- 140
这段代码 是添加折线图横线(平均值,最大值,等) 如下图
 markLine: {
                  data: [{
                    yAxis: this.sum,
                    name: '限定值',
                    symbol: 'circle',
                    type: 'average',
                    lineStyle: { // 指示线的样式  虚实和颜色
                      // type: 'solid',
                      color: 'red',
                      width:'2'
                    }
                  }
- 1
- 2
- 3
- 4
- 5
- 6
- 7
- 8
- 9
- 10
- 11
- 12

声明:本文内容由网友自发贡献,不代表【wpsshop博客】立场,版权归原作者所有,本站不承担相应法律责任。如您发现有侵权的内容,请联系我们。转载请注明出处:https://www.wpsshop.cn/w/Li_阴宅/article/detail/834706
推荐阅读
相关标签
Copyright © 2003-2013 www.wpsshop.cn 版权所有,并保留所有权利。

