热门标签
热门文章
- 12.3语料库NLTK数据包下载及安装
- 26款ai伪原创,手机上创作文章别错过_手机创作文章
- 3蓝桥杯Python A组国一经验分享(希望这篇文章可以给你一点点帮助)_蓝桥杯国赛一二三等奖比例
- 4bert 三种模型保存的方式以及调用方法总结(ckpt,单文件pb,tf_serving使用的pb)_bert.ckpt
- 5开源密码管理软件项目说明(附源代码)_统一密码服务平台的源代码
- 6- 概述 - 《设计模式(极简c++版)》
- 7基于matlab的指纹图像处理、脊线增强、脊线分割、脊线细化、细节点检测和细节点验证(毕设完整代码+报告)_脊线提取matlab
- 8SOC内部集成网络MAC外设+ PHY网络芯片方案:MII/RMII 接口与 MDIO 接口
- 9Java概念性问题7_哪一项的实现不可以添加为textfiled对象的监听器
- 10Transformer详解_transformer的输入
当前位置: article > 正文
决策树及matlab实现_决策树matlab代码
作者:weixin_40725706 | 2024-04-03 07:09:05
赞
踩
决策树matlab代码
决策树及matlab实现
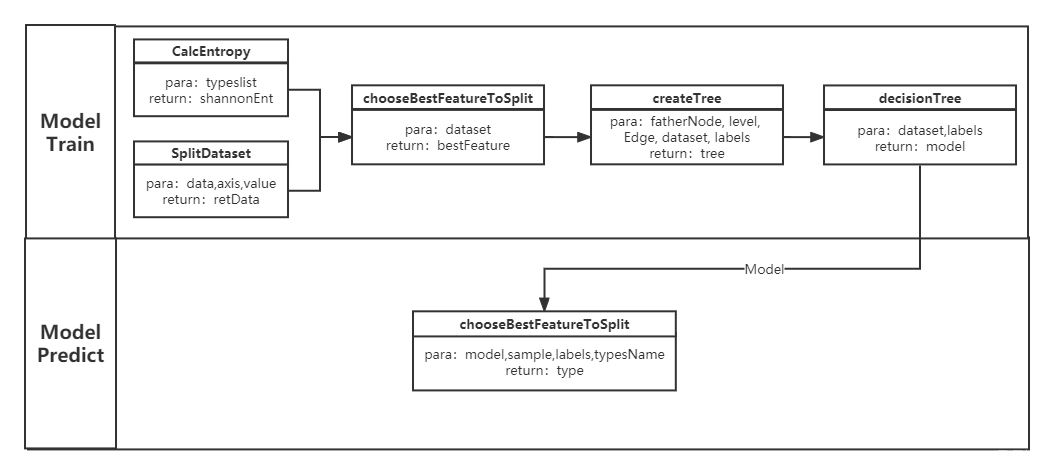
- 决策树逻辑实现(参考机器学习实战,将python代码改成matlab)
代码结构

1.1. CalcEntropy
function shannonEnt=CalcEntropy(typeslist)
% 根据types列表,计算数据集的熵
% typeslist: 数据集的属性列表
% shannonEnt: 熵值计算
shannonEnt = 0;
Length = length(typeslist);
itemList = unique(typeslist); % 去重
pNum = length(itemList);
for i = 1:pNum
    itemLength = length(find(typeslist==itemList(i)));
    pItem = itemLength/Length;
    shannonEnt = shannonEnt-pItem*log2(pItem);
end
- 1
- 2
- 3
- 4
- 5
- 6
- 7
- 8
- 9
- 10
- 11
- 12
- 13
1.2. splitDataset
function retData=SplitDataset(data,axis,value)
% 按照给定的特征划分数据集
% data: 待划分数据集
% axis: 列数
% value: 特征的返回值
% retData: 划分后数据集
retData = [];
[m,n] = size(data);
for i = 1:m
    if data(i,axis) == value
        retData = [retData;data(i,:)];
    end
end
retData(:,axis) = [];
- 1
- 2
- 3
- 4
- 5
- 6
- 7
- 8
- 9
- 10
- 11
- 12
- 13
- 14
1.3. chooseBestFeatureToSplit
function bestFeature=chooseBestFeatureToSplit(dataset)
% 找到最好的划分指标
% dataset: 数据集
% bestFeature: 最优指标 num数值
[m,n] = size(dataset);
numFeatures = n-1;
originEntropy = CalcEntropy(dataset(:,n));   % 初始熵
bestInfoGain = 0.0;  % 熵变化最大值
bestFeature = -1;    % 最佳特征
for i = 1:numFeatures
    uniqueVals = unique(dataset(:,i));
    tmpEntropy = 0.0;
    for j = 1:length(uniqueVals)
        subDataset = SplitDataset(dataset,i,uniqueVals(j));
        prob = length(subDataset(:,1))/m;
        tmpEntropy = tmpEntropy+prob*CalcEntropy(subDataset);
    end
    infoGain = originEntropy-tmpEntropy;
    if infoGain > bestInfoGain
        bestInfoGain = infoGain;
        bestFeature = i;
    end
end
- 1
- 2
- 3
- 4
- 5
- 6
- 7
- 8
- 9
- 10
- 11
- 12
- 13
- 14
- 15
- 16
- 17
- 18
- 19
- 20
- 21
- 22
- 23
1.4. createTree
function tree=createTree(fatherNode, level, Edge, dataset, labels)
% 递归创建决策树
% fatherNode: 父节点
% level: 所属层次
% Edge: 边的属性
% dataset: 数据集
% labels: 特征属性
global tree;
branch = struct('level',level+1,'fatherNode',fatherNode,'Edge',Edge,'Node',[]);
[m,n] = size(dataset);
typesList = dataset(:,n);
% 第一种情况 数据集只剩一种type
if length(unique(typesList)) == 1
    branch.Node = typesList(1);
    tree = [tree branch];
    return;
end
% 第二种情况 遍历完所有特征
if length(dataset(1,:)) == 1
    branch.Node = mode(typeslist); % 取众数
    tree = [tree branch];
    return;
end
% 第三种情况
bestFeat = chooseBestFeatureToSplit(dataset);
bestFeatLabel = labels(bestFeat);
branch.Node = bestFeatLabel;
tree = [tree branch];
labels(strcmp(labels,bestFeatLabel)) = [];
featVals = unique(dataset(:,bestFeat));
for i = 1:length(featVals)
    createTree(branch.Node, branch.level, featVals(i), SplitDataset(dataset,bestFeat,featVals(i)), labels);
end
- 1
- 2
- 3
- 4
- 5
- 6
- 7
- 8
- 9
- 10
- 11
- 12
- 13
- 14
- 15
- 16
- 17
- 18
- 19
- 20
- 21
- 22
- 23
- 24
- 25
- 26
- 27
- 28
- 29
- 30
- 31
- 32
- 33
1.5. decisionTree
function decisionTreeModel=decisionTree(dataset,labels)
% 决策树模型训练主函数
% dataset: 数据集
% labels: 特征属性
% decisionTreeModel: 保存模型数据的struct数组
global tree;
tree=struct('level',-1,'fatherNode',[],'Edge',[],'Node',[]);
createTree('root',-1,-1,dataset,labels);
tree(1) = [];
tree(1) = [];
model.Node = tree;
decisionTreeModel = model;
- 1
- 2
- 3
- 4
- 5
- 6
- 7
- 8
- 9
- 10
- 11
- 12
1.6. modelPredict
function type=modelPredict(model,sample,labels,typesName)
% 训练好的模型进行预测
% model: 训练好的模型
% sample: 待预测样本
% typesName: 类别名称
% type: 输出类别
Nodes = model.Node;
rootNode = Nodes(1);
head = rootNode.fatherNode;
level = 1;
for i = 1:length(Nodes)
    if Nodes(i).level == level
        if Nodes(i).Edge == sample(find(labels==head))
            if length(find(typesName==double(Nodes(i).Node))) == 1
                type = Nodes(i).Node;
                break;
            else
                head = Nodes(i).Node;
                level = level+1;
            end
        end
    end
end
- 1
- 2
- 3
- 4
- 5
- 6
- 7
- 8
- 9
- 10
- 11
- 12
- 13
- 14
- 15
- 16
- 17
- 18
- 19
- 20
- 21
- 22
- 23
-
Matlab自带函数实现
2.1. dataPreprocess
function [xtrain,ytrain,xtest,ytest] = dataPreprocess()
% 数据预处理
% xtrain,ytrain,xtest,ytest:x训练集,测试集,y训练集,测试集
load fisheriris
x = meas;
y = species;
% 数据划分
train_index = randsample(150,120,false);
test_index = randsample(150,30,false);
xtrain = x(train_index,:);
xtest = x(test_index,:);
ytrain = y(train_index,:);
ytest = y(test_index,:);
% 数据归一化
% Flattened1 = xtrain';
% MappedFlattened1 = mapminmax(Flattened1); % 默认行归一
% xtrain = MappedFlattened1';
% Flattened2 = xtest';
% MappedFlattened2 = mapminmax(Flattened2); % 默认行归一
% xtest = MappedFlattened2';
- 1
- 2
- 3
- 4
- 5
- 6
- 7
- 8
- 9
- 10
- 11
- 12
- 13
- 14
- 15
- 16
- 17
- 18
- 19
- 20
- 21
2.2. modelTrain
function model = modelTrain(xtrain,ytrain)
% 模型训练
model =  fitctree(xtrain,ytrain);
view(model, 'Mode', 'graph');
- 1
- 2
- 3
- 4
2.3. modelTrainOpt
function model = modelTrainOpt(xtrain,ytrain)
% 模型训练 Optimize Classification Tree
model = fitctree(xtrain,ytrain,'OptimizeHyperparameters','auto');
view(model, 'Mode', 'graph');
- 1
- 2
- 3
- 4
2.4. modelPredict
function [train_acc,test_acc]=modelPredict(model,xtrain,ytrain,xtest,ytest)
% xtrain,ytrain,xtest,ytest
train_pre = predict(model,xtrain);
test_pre = predict(model,xtest);
train_right = 0;
for i = 1:length(train_pre)
    if isequal(train_pre(i),ytrain(i))
        train_right = train_right + 1;
    end
end
test_right = 0;
for i = 1:length(test_pre)
    if isequal(test_pre(i),ytest(i))
        test_right = test_right + 1;
    end
end
train_acc = train_right/length(ytrain);
test_acc = test_right/length(ytest);
- 1
- 2
- 3
- 4
- 5
- 6
- 7
- 8
- 9
- 10
- 11
- 12
- 13
- 14
- 15
- 16
- 17
- 18
本博客为个人笔记,欢迎交流!!!!
声明:本文内容由网友自发贡献,不代表【wpsshop博客】立场,版权归原作者所有,本站不承担相应法律责任。如您发现有侵权的内容,请联系我们。转载请注明出处:https://www.wpsshop.cn/w/weixin_40725706/article/detail/354706?site
推荐阅读
相关标签


