热门标签
热门文章
- 1ChatGPT追祖寻宗:GPT-3技术报告要点解读_gpt3技术报告
- 2CEPH分布式存储搭建(对象、块、文件三大存储)_wget -o 对象存储数据
- 3单片机执行指令过程详解_单片机执行一句话是什么
- 4【MySQL系列】表的内连接和外连接学习_mysql 内连接
- 5SQL注入---HTTP报头注入
- 6【数学建模】元胞自动机
- 7Verilog中的inout端口使用方法及注意事项_inout端口定义类型
- 8【VS开发】浅谈UDP(数据包长度,收包能力,丢包及进程结构选择)
- 9(yolov8 -pose val)AttributeError: ‘dict‘ object has no attribute ‘name‘_attributeerror: 'v8detectionloss' object has no at
- 10智能优化算法-减法平均优化器Subtraction-Average-Based Optimizer (附Matlab代码)_subtraction-average-based optimizer: a new swarm-i
当前位置: article > 正文
vue echarts 柱状图 堆叠柱状图
作者:weixin_40725706 | 2024-04-27 10:27:43
赞
踩
vue echarts 柱状图 堆叠柱状图
echarts堆叠柱状图(效果图在文章末尾)
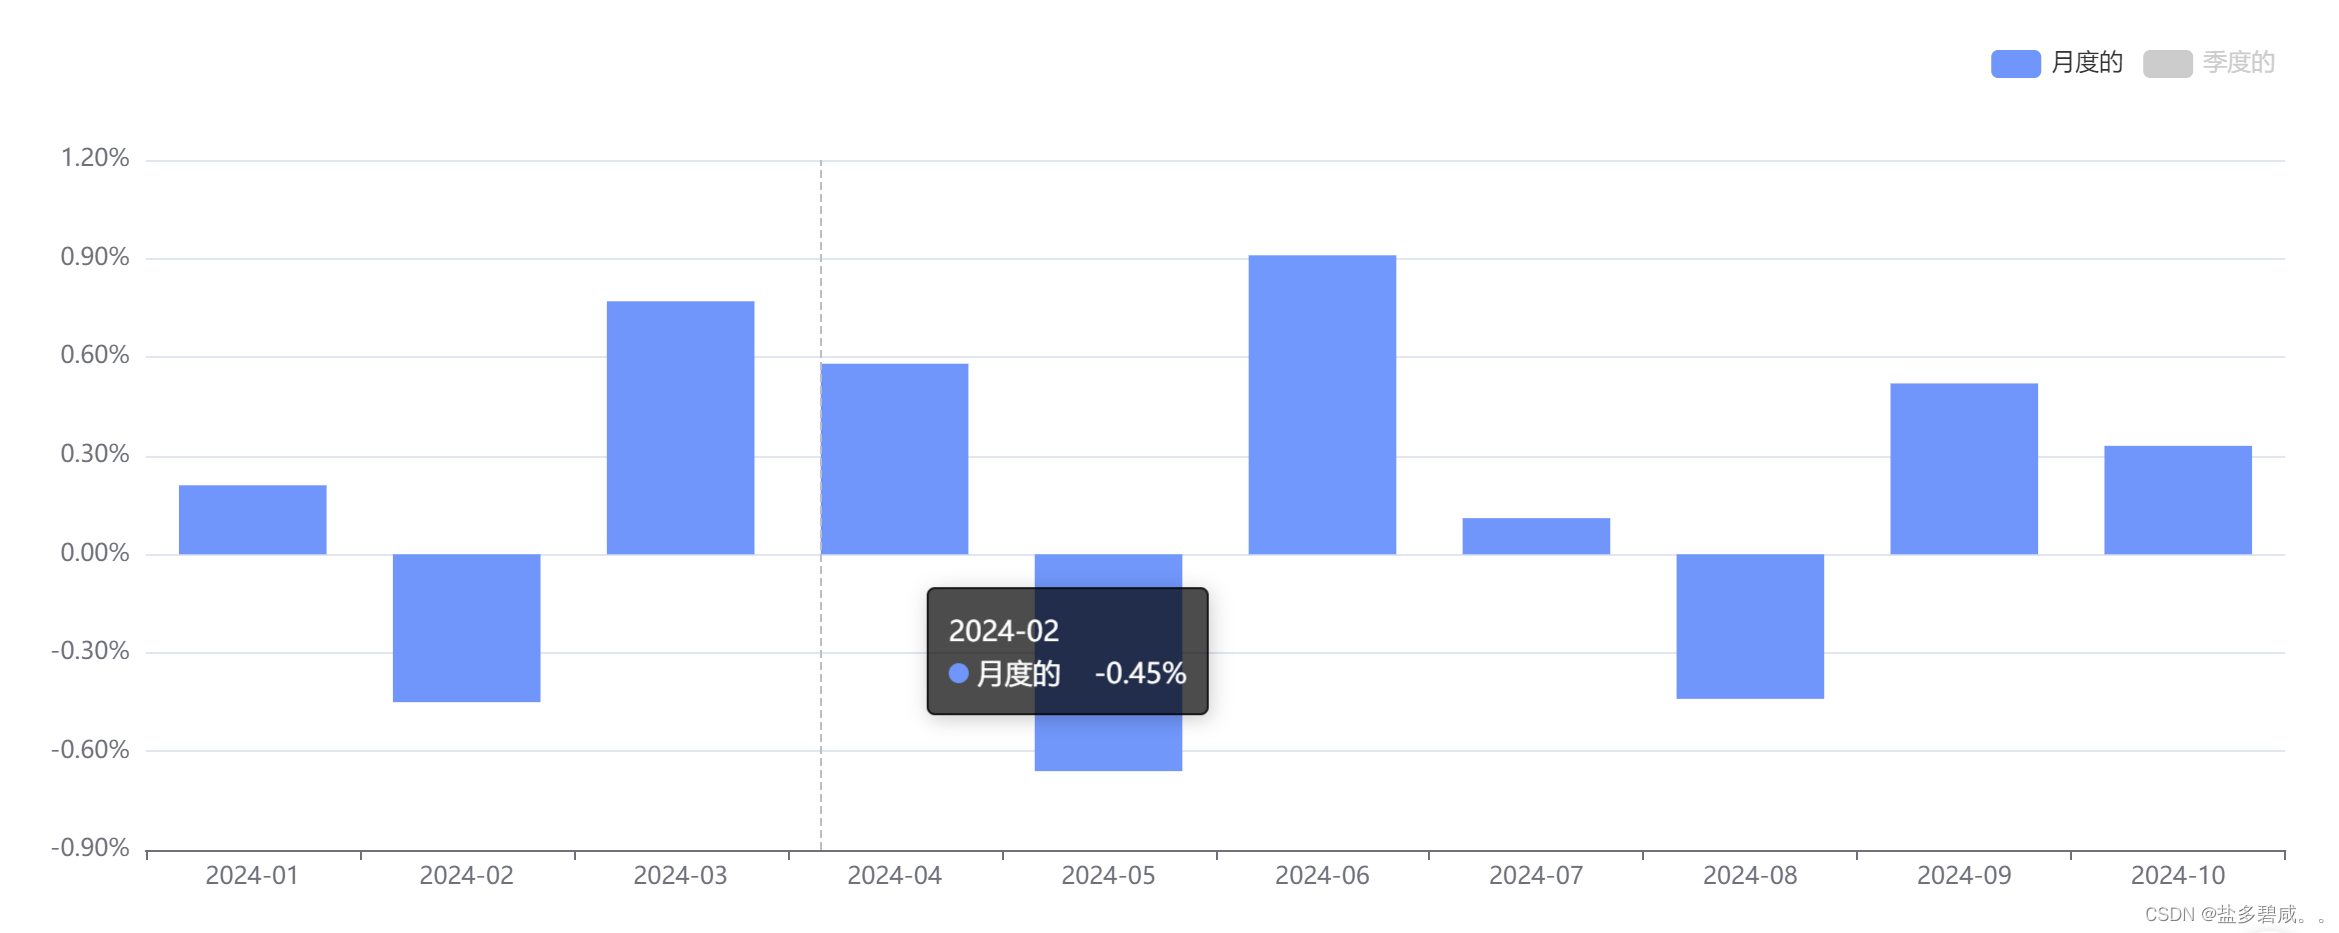
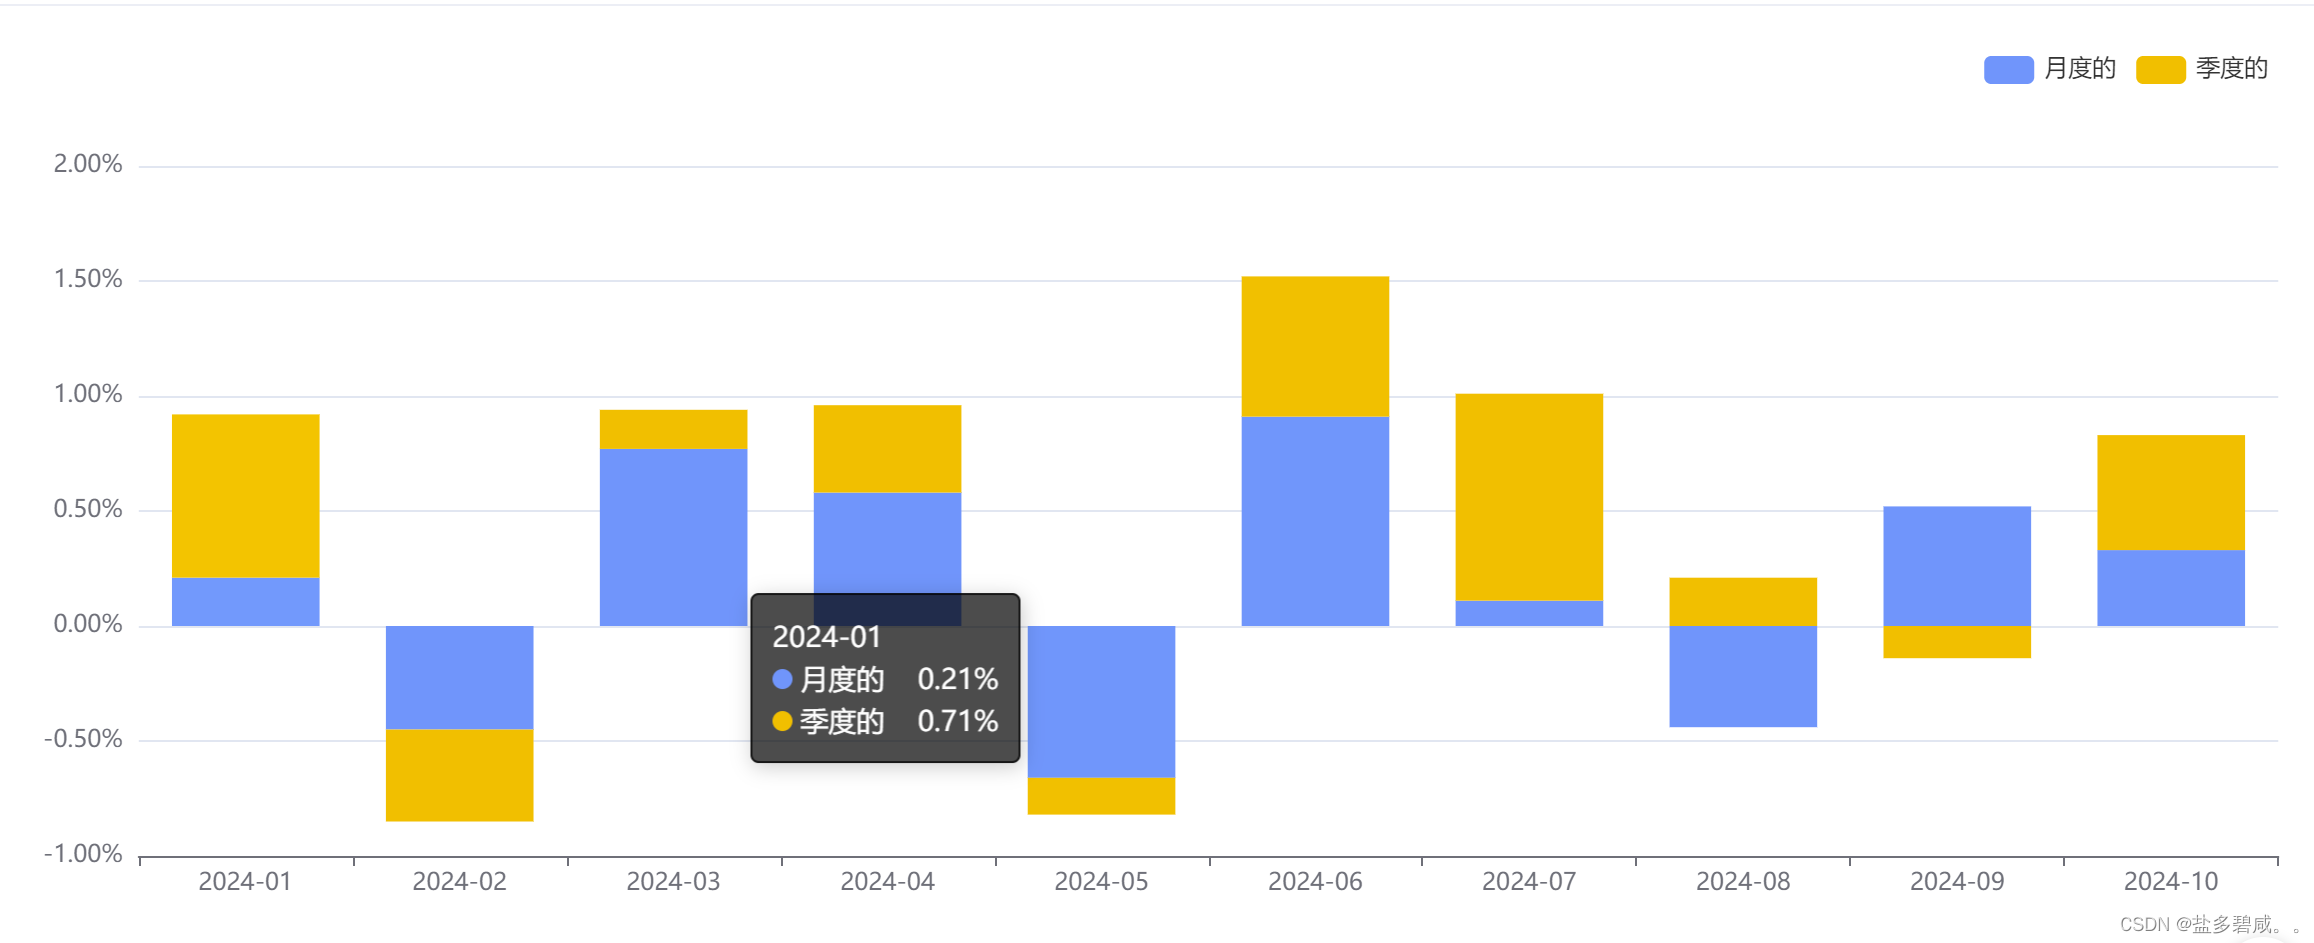
1、默认只显示 月度的 数据,手动点击 legend 季度的 数据才会显示;
2、监听左侧菜单栏的宽度变化,图表宽度自适应展示
<template> <div> <div id="barChart" ref="barChartRef" style="width: 100%; height: 450px"></div> </div> </template> <script> import * as echarts from 'echarts'; export default { name: '', props: {}, components: {}, data () { return { chart: null, _thisForChart: null, _thisForWindow: null, } }, created() {}, mounted() { this.$nextTick(() => { this.initBarChart() this.addEventListenerToSidebarContainer(this) this.addEventListenerToWindowResize(this) }) }, beforeDestroy () { this.removeEventListenerToSidebarContainer() this.removeEventListenerToWindowResize() }, computed: {}, watch: {}, methods: { initBarChart() { let xAxisData = ['2024-01','2024-02','2024-03','2024-04','2024-05','2024-06','2024-07','2024-08','2024-09','2024-10',] // X轴数据 let mounthly = ['0.21','-0.45','0.77','0.58','-0.66','0.91','0.11','-0.44','0.52','0.33'] // 月度的 let quarterlyData = ['0.71','-0.40','0.17','0.38','-0.16','0.61','0.90','0.21','-0.14','0.50',] // 季度的 var chartDom = document.getElementById('barChart'); this.chart = echarts.init(chartDom); var emphasisStyle = { itemStyle: { shadowBlur: 10, shadowColor: 'rgba(0,0,0,0.1)' } }; let option = { color: ['#6394F9','#F8BF20'], legend: { show: true, data: ['月度的', '季度的'], right: '1%', selected: {'季度的': false,} // 默认不显示月度的 }, grid: { left: '5%', right: '1%', bottom: '10%', }, tooltip: { trigger: 'axis', backgroundColor: 'rgba( 0, 0, 0,0.7)', borderColor: 'rgba( 0, 0, 0,0.7)', formatter:function(params) { var str = params[0].name + '</br>' for(let item of params) { str = `<span style='color: #fff;'>${str}</span><div style='display:flex;align-items:center;justify-content:space-between;'><span>${item.marker}<span style='color: #fff;'>${item.seriesName}</span></span> <span style='color: #fff;'>${item.value}%</span></div>` } return str; } }, xAxis: { data: xAxisData, name: '', axisLine: { onZero: false }, splitLine: { show: false }, splitArea: { show: false } }, yAxis: { splitLine: { lineStyle: { type: 'solid', } }, axisLabel: { show: true, formatter: (value) => { return `${value.toFixed(2)}%` } }, }, series: [ { name: '月度的', type: 'bar', stack: 'one', // emphasis: emphasisStyle, // barWidth: '60%', // 设置柱宽为系列宽度的 data: mounthly, }, { name: '季度的', type: 'bar', stack: 'one', // emphasis: emphasisStyle, // barWidth: '60%', // 设置柱宽为系列宽度的 data: quarterlyData, } ] } this.chart.setOption(option,true); }, // 监听侧边栏导航的宽度发生变化 addEventListenerToSidebarContainer(_this) { let sidebarContainer = document.getElementsByClassName("sidebar-container")[0]; this._thisForChart = _this; sidebarContainer && sidebarContainer.addEventListener("transitionend", this.sidebarResizeHandler); }, removeEventListenerToSidebarContainer() { let sidebarContainer = document.getElementsByClassName("sidebar-container")[0]; this._thisForChart = null sidebarContainer && sidebarContainer.removeEventListener("transitionend", this.sidebarResizeHandler); }, sidebarResizeHandler(e) { if (e.propertyName === "width") { this._thisForChart.chart.resize(); } }, // window 的尺寸发生变化的时候 会执行图表的resize addEventListenerToWindowResize(_this) { this._thisForWindow = _this; window.addEventListener("resize", this.windowResizeHandler); }, removeEventListenerToWindowResize(_this) { this. _thisForWindow = null window.removeEventListener("resize", this.windowResizeHandler); }, windowResizeHandler(e) { this._thisForWindow.chart.resize(); }, }, } </script> <style lang="scss" scoped> </style>
- 1
- 2
- 3
- 4
- 5
- 6
- 7
- 8
- 9
- 10
- 11
- 12
- 13
- 14
- 15
- 16
- 17
- 18
- 19
- 20
- 21
- 22
- 23
- 24
- 25
- 26
- 27
- 28
- 29
- 30
- 31
- 32
- 33
- 34
- 35
- 36
- 37
- 38
- 39
- 40
- 41
- 42
- 43
- 44
- 45
- 46
- 47
- 48
- 49
- 50
- 51
- 52
- 53
- 54
- 55
- 56
- 57
- 58
- 59
- 60
- 61
- 62
- 63
- 64
- 65
- 66
- 67
- 68
- 69
- 70
- 71
- 72
- 73
- 74
- 75
- 76
- 77
- 78
- 79
- 80
- 81
- 82
- 83
- 84
- 85
- 86
- 87
- 88
- 89
- 90
- 91
- 92
- 93
- 94
- 95
- 96
- 97
- 98
- 99
- 100
- 101
- 102
- 103
- 104
- 105
- 106
- 107
- 108
- 109
- 110
- 111
- 112
- 113
- 114
- 115
- 116
- 117
- 118
- 119
- 120
- 121
- 122
- 123
- 124
- 125
- 126
- 127
- 128
- 129
- 130
- 131
- 132
- 133
- 134
- 135
- 136
- 137
- 138
- 139
- 140
- 141
- 142
- 143
- 144
- 145
- 146
- 147
- 148
- 149
- 150
- 151
- 152
- 153
- 154
- 155
- 156
- 157
- 158
展示效果图:


声明:本文内容由网友自发贡献,不代表【wpsshop博客】立场,版权归原作者所有,本站不承担相应法律责任。如您发现有侵权的内容,请联系我们。转载请注明出处:https://www.wpsshop.cn/w/weixin_40725706/article/detail/496255
推荐阅读
相关标签


