- 1spark的使用_spark怎么用
- 2CRM客户管理系统源码PHP开发搭建_c.xsymz.icu
- 3Java高级特性之解析XML_编写如下结构的xml文档,具体值自行添加,至少添加两个学员的成绩信息
- 4cvte面试过程
- 5Manifest merger failed解决方法_caused by: java.lang.runtimeexception: manifest me
- 6显卡算力表-arch-架构_nvidia 算力查询arch
- 7_MSC_VER和VS版本对应
- 8python晋江文学城数据分析——简单的可视化(pyecharts)
- 9ei会议论文录用但不参加会议_会议论文有录用通知吗
- 10python文件的读写操作_python读写文件操作类型
详解如何用Python实现ROC曲线绘制_python绘制roc曲线
赞
踩
参考资料
ROC 曲线是一种坐标图式的分析工具,是由二战中的电子和雷达工程师发明的,发明之初是用来侦测敌军飞机、船舰,后来被应用于医学、生物学、犯罪心理学。
如今,ROC 曲线已经被广泛应用于机器学习领域的模型评估,说到这里就不得不提到 Tom Fawcett 大佬,他一直在致力于推广 ROC 在机器学习领域的应用,他发布的论文《An introduction to ROC analysis》[1]更是被奉为 ROC 的经典之作(引用 2.2w 次),知名机器学习库 scikit-learn 中的 ROC 算法就是参考此论文实现,可见其影响力!
ROC全称是“受试者工作特征”(Receiver Operating Characteristic)。ROC曲线的面积就是AUC(Area Under Curve),用于衡量“二分类问题”机器学习算法性能(泛化能力)。二值分类器,就是字面意思它会将数据分成两个类别(正/负样本)。例如:预测银行用户是否会违约、内容分为违规和不违规,以及广告过滤、图片分类等场景。
ROC曲线,通过**将连续变量设定出多个不同的临界值,从而计算出一系列真 正例率(TP)和假 正例率(FP),再以假 正例率为横坐标、真 正例率为纵坐标**绘制成曲线,曲线下面积AUC越大,推断准确性越高。ROC曲线如下图所示。
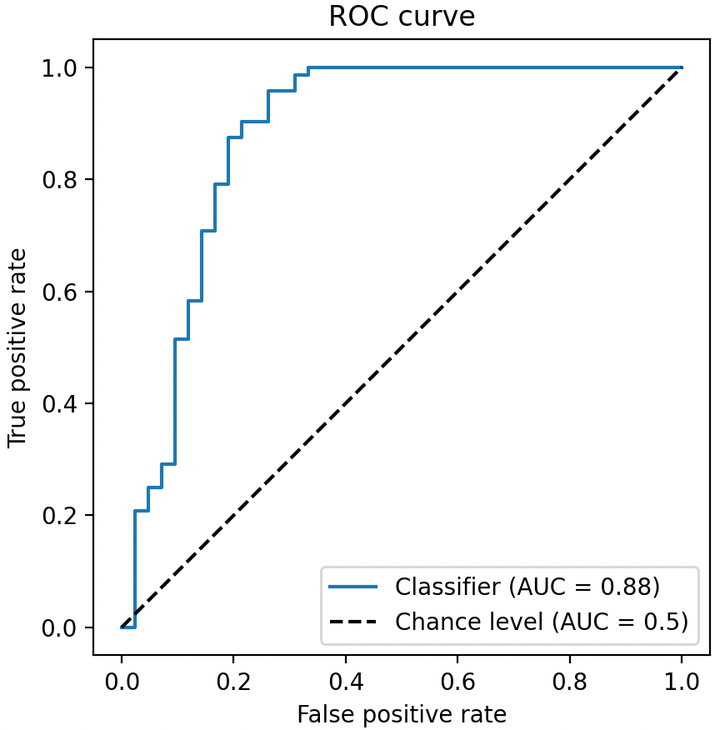
现在来解释一下,TP与FP如何计算,同时要清楚,与二者分别对应的还有TN与FN。
考虑一个二分类模型, 负样本(Negative) 为 0,正样本(Positive) 为 1。即:
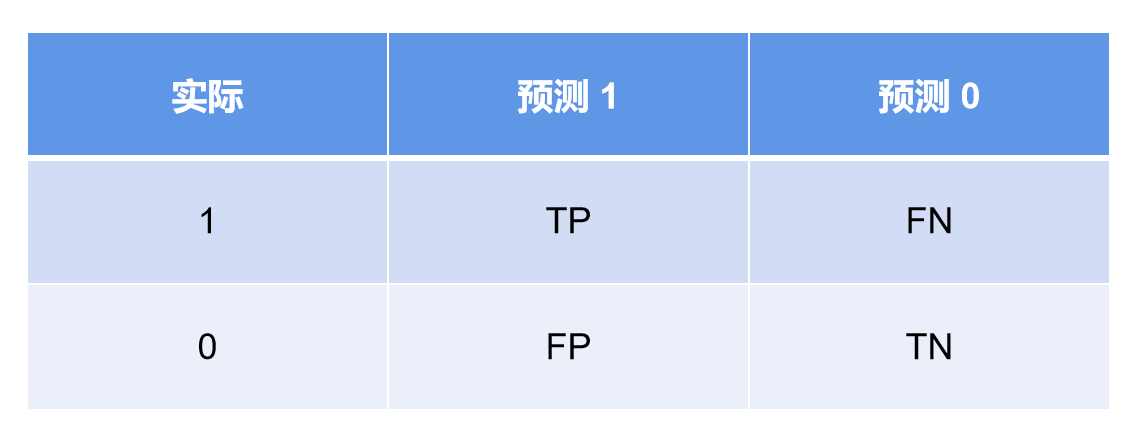
TPR = \frac{TP}{TP+FN} ,FPR = \frac{FP}{FP+TN}\\
由上面的表格和公式我们可以知道,True Positive Rate(TPR)表示实际为1的样本中,预测为1的样本所占的比例;False Positive Rate(FPR)表示实际为0的样本中,预测为1的样本所占的比例。因此,我们可以知道,正例率的“正”即代表预测结果为“1”!(即1代表正,0代表负)
接下来,再看这个曲线,我们会发现——最靠近坐标图左上方的点为假正例率和真正例率均较高的临界值。展开解释一下:
- **假正例率FPR:**FPR为横坐标,越靠近图的左上方,FPR的值越接近0,表明FP越接近0,即实际为0时,错误预测为1的样本越少,故假正例率越高。
- **真正例率TPR:**TPR为纵坐标,越靠近图的左上方,TPR的值越接近1,表明FN越接近0,即实际为1时,错误预测为0的样本越少,故真正例率越高。
做个总结
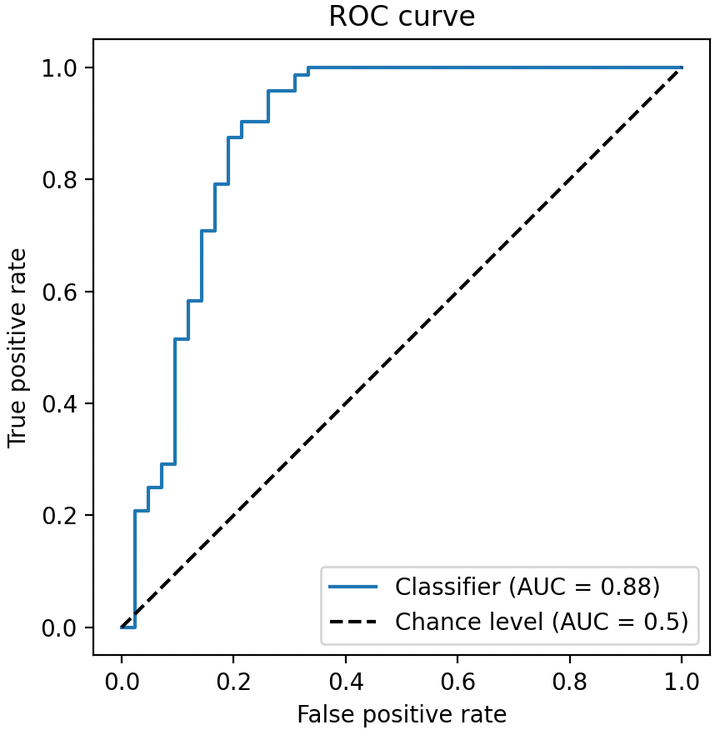
坐标系中纵轴为 TPR(真阳率/命中率/召回率)最大值为 1,横轴为 FPR(假阳率/误判率)最大值为 1,虚线为基准线(最低标准),蓝色的曲线就是 ROC 曲线。其中 ROC 曲线距离基准线越远,则说明该模型的预测效果越好。(TPR: True positive rate; FPR: False positive rate)
- ROC 曲线接近左上角:模型预测准确率很高
- ROC 曲线略高于基准线:模型预测准确率一般
- ROC 低于基准线:模型未达到最低标准,无法使用
二、举例分析
下面举一个实际例子作为讲解,以下表 5 个样本为例,讲解如何计算 FPR 和 TPR。

正样本数 P=3 ,负样本数 N=2 。
其中 y=0 且 \hat{y}=1 的样本有 1 个(id=5),即 FP=1,所以 FPR=1/2=0.5
其中 y=1且 \hat{y}=1 的样本有 2 个,即 TP=2 ,所以 TPR=2/3
FPR 和 TPR 的取值范围均是 0 到 1 之间。对于 FPR,我们希望其越小越好。而对于 TPR,我们希望其越大越好,即上一节介绍的图像离左上角越近越好!
至此,我们已经介绍完如何计算 FPR 和 TPR 的值,下面讲解如何绘制 ROC 曲线。
三、绘制 ROC 曲线
下面将分为两部分讲解如何绘制 ROC 曲线:
- 第一部分:手绘讲解原理
- 第二部分:Python 代码实现
3.1 手绘 ROC 曲线
一般在二分类模型里(标签取值为 0 或 1),会默认设定一个阈值 (threshold)。当预测分数大于这个阈值时,输出 1,反之输出 0。我们可以通过调节这个阈值,改变模型预测的输出,进而画出 ROC 曲线。
以下面表格中的 20 个点为例,介绍如何人工画出 ROC 曲线,其中正样本和负样本都是 10 个,即 P = N = 10\\
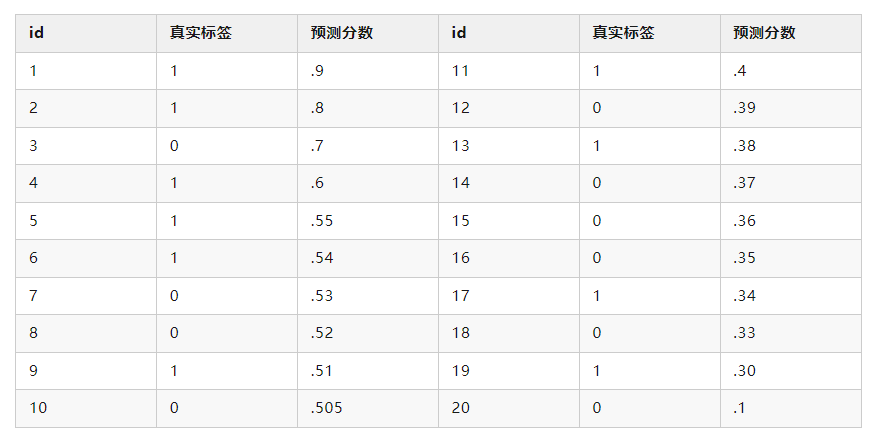
注意:真实标签为1的,即正样本
当设定阈值为 0.9 时,只有第一个点预测为 1,其余都为 0,故 FP=0、TP=1 ,计算出 FPR=0/10=0,TPR=1/10=0.1 ,画出点 (0,0.1)
当设定阈值为 0.8 时,只有前两个点预测为 1,其余都为 0,故 FP=0、TP=2 ,计算出 FPR=0/10=0,TPR=2/10=0.2 ,画出点 (0,0.2)
当设定阈值为 0.7 时,只有前三个点预测为 1,其余都为 0,故 FP=1、TP=2 ,计算出 FPR=1/10=0.1,TPR=2/10=0.2 ,画出点 (0.1,0.2)
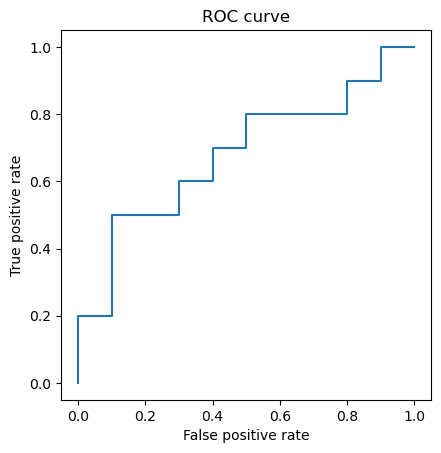
以此类推,画出的 ROC 曲线如下:
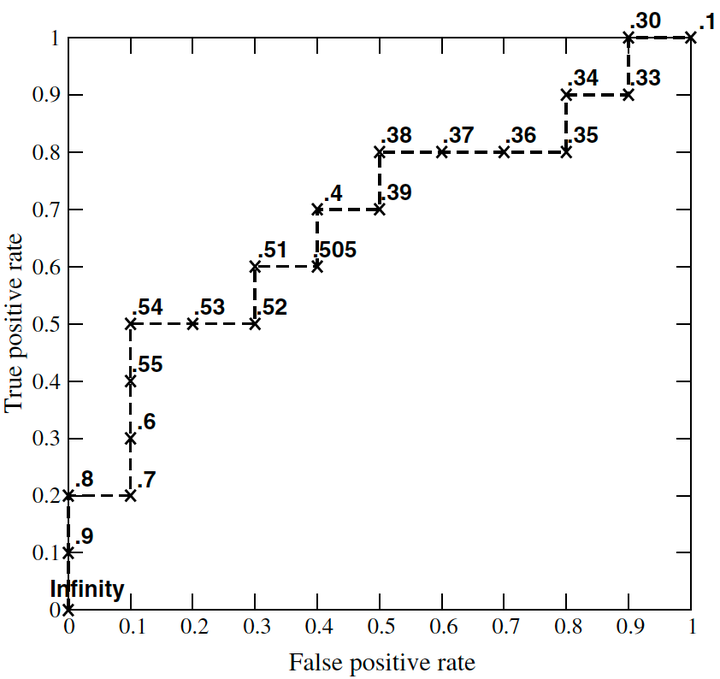
因此,在画 ROC 曲线前,需要将预测分数从大到小排序,然后将预测分数依次设定为阈值,分别计算 FPR 和 TPR 。
而对于**基准线**,假设随机预测为正样本的概率为 x,即 Pr(\hat{y}=1)=x 。由于 FPR 计算的是负样本中,预测为正样本的概率,因此 FPR= x (同理, TPR= x )。所以,基准线为从点 (0, 0) 到 (1, 1) 的斜线。
3.2 Python 代码
接下来,我们将结合代码讲解如何在 Python 中绘制 ROC 曲线。
下面的代码参考了《An Introduction to ROC Analysis》**[2]**中的算法 1(伪代码)。
——伪代码梳理
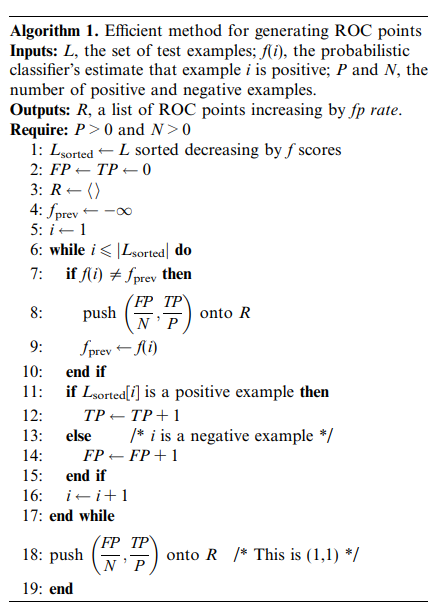
下面节选一部分原论文对于上述伪代码的解释:
The algorithm is shown in Algorithm 1. TP and FP both start at zero. For each positive instance we increment TP and for every negative instance we increment FP.We maintain a stack R of ROC points, pushing a new point onto R after each instance is processed. The final output is the stack R, which will contain points on the ROC curve.
算法如算法 1 所示。TP 和 FP 都从 0 开始。每处理一个正向实例,我们都会递增 TP,每处理一个负向实例,我们都会递增 FP。我们维护一个 ROC 点堆栈 R,每次处理完一个实例后,都会向 R 堆栈推送一个新点。最终的输出是堆栈 R,其中包含 ROC 曲线上的点。
Statements 7–10 need some explanation. These are necessary in order to correctly handle sequences of equally scored instances. Consider the ROC curve shown in Fig. 6.
需要对第 7-10 条进行一些解释。为了正确处理得分相同的实例序列,这些说明是必要的。请看图 6 所示的 ROC 曲线。
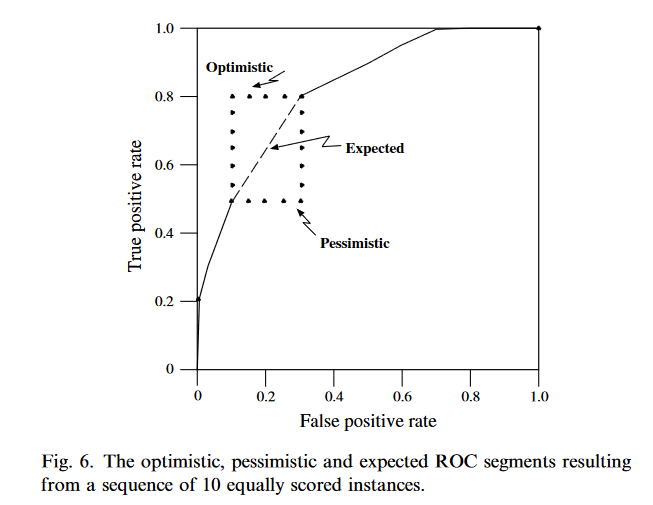
图 6.10 个得分相同的实例序列产生的乐观、悲观和预期 ROC 区段。
Assume we have a test set in which there is a sequence of instances, four negatives and six positives, all scored equally by f. The sort in line 1 of Algorithm 1 does not impose any specific ordering on these instances since their f scores are equal. What happens when we create an ROC curve? In one extreme case, all the positives end up at the beginning of the sequence and we generate the ‘‘optimistic’’ upper L segment shown in Fig. 6.
假设我们有一个测试集,其中有一系列实例,4 个阴性实例和 6 个阳性实例,f 对所有实例的评分相同。算法 1 第 1 行中的排序并没有对这些实例施加任何特定的排序,因为它们的 f 分数是相等的。创建 ROC 曲线时会发生什么情况?在一种极端的情况下,所有的阳性结果都会出现在序列的开头,我们就会生成图 6 所示的 "乐观的 "上 L 段。
In the opposite extreme, all the negatives end up at the beginning of the sequence and we get the ‘‘pessimistic’’ lower L shown in Fig. 6. Any mixed ordering of the instances will give a different set of step segments within the rectangle formed by these two extremes. However, the ROC curve should represent the expected performance of the classifier, which, lacking any other information, is the average of the pessimistic and optimistic segments. This average is the diagonal of the rectangle, and can be created in the ROC curve algorithm by not emitting an ROC point until all instances of equal f values have been processed. This is what the fprev variable and the if statement of line 7 accomplish.
在另一个极端,所有的负数都在序列的开头,我们就得到了图 6 所示的 "悲观的 "下 L。在这两个极端所形成的矩形范围内,实例的任何混合排序都会产生一组不同的阶跃段。然而,ROC 曲线应代表分类器的预期性能,在缺乏其他信息的情况下,它是悲观和乐观段的平均值。这个平均值就是矩形的对角线,可以在 ROC 曲线算法中创建,即在处理完所有 f 值相等的实例之前不发出 ROC 点。这就是 fprev 变量和第 7 行 if 语句的作用。
值得一提的是,知名机器学习库 scikit-learn 的 roc_curve 函数[3] 也参考了这个算法。

——代码梳理
首先给出RO曲线绘制的完成代码——这个函数接受三个参数:y_true表示真实标签,y_score表示模型预测分数,pos_label表示正样本标签。
- 函数首先统计了正样本和负样本的个数。然后,它初始化了一些变量,包括真阳性(tp)和假阳性(fp)的计数,以及存储真阳性率(tpr)、假阳性率(fpr)和阈值的列表。
- 函数通过对预测分数进行排序,从高到低遍历每个样本。在遍历过程中,它计算并记录了每个阈值下的假阳性率和真阳性率,同时处理了预测分数相同的样本。
- 最后,函数将最后一个阈值处的假阳性率、真阳性率和阈值添加到相应的列表中,并返回这些列表。
这个函数的返回值是ROC曲线上的假阳性率列表(fpr)、真阳性率列表(tpr)和阈值列表(thresholds)。可以使用这些列表来绘制ROC曲线或进行其他评估。
def roc(y_true, y_score, pos_label): """ y_true:真实标签 y_score:模型预测分数 pos_label:正样本标签,如“1” """ # 统计正样本和负样本的个数 num_positive_examples = (y_true == pos_label).sum() num_negtive_examples = len(y_true) - num_positive_examples tp, fp = 0, 0 tpr, fpr, thresholds = [], [], [] score = max(y_score) + 1 # 根据排序后的预测分数分别计算fpr和tpr for i in np.flip(np.argsort(y_score)): # 处理样本预测分数相同的情况 if y_score[i] != score: fpr.append(fp / num_negtive_examples) tpr.append(tp / num_positive_examples) thresholds.append(score) score = y_score[i] if y_true[i] == pos_label: tp += 1 else: fp += 1 fpr.append(fp / num_negtive_examples) tpr.append(tp / num_positive_examples) thresholds.append(score) return fpr, tpr, thresholds
- 1
下面来解释一下重点语句:
score = max(y_score) + 1
score = max(y_score) + 1 的目的是为了**确保在处理样本预测分数相同的情况下,能够正确地计算每个阈值处的假阳性率和真阳性率**。
首先,max(y_score)找到了y_score中的最大值。然后,将最大值加1,得到的结果赋值给变量score。
在循环遍历预测分数时,如果当前样本的预测分数与score不同,说明遇到了一个新的阈值点。这时,会将之前累积的假阳性率、真阳性率和阈值添加到相应的列表中,并更新score为当前样本的预测分数,以便下一个阈值点的计算。
通过将最大预测分数加1,可以确保在遍历完所有样本后,最后一个阈值点的假阳性率、真阳性率和阈值也能正确地添加到列表中。
这样做的目的是为了确保在处理样本预测分数相同的情况下,能够正确地计算每个阈值处的假阳性率和真阳性率,而不会丢失任何数据点。
导入上面 3.1 表格中的数据,通过上面实现的 roc 方法,计算 ROC 曲线的坐标值。
import numpy as np y_true = np.array( [1, 1, 0, 1, 1, 1, 0, 0, 1, 0, 1, 0, 1, 0, 0, 0, 1, 0, 1, 0] ) y_score = np.array([ .9, .8, .7, .6, .55, .54, .53, .52, .51, .505, .4, .39, .38, .37, .36, .35, .34, .33, .3, .1 ]) fpr, tpr, thresholds = roc(y_true, y_score, pos_label=1)
- 1
最后,通过 Matplotlib 将计算出的 ROC 曲线坐标绘制成图。
- 首先,代码导入了
matplotlib.pyplot模块,用于绘图。 plt.plot(fpr, tpr)将假阳性率(fpr)作为x轴,真阳性率(tpr)作为y轴,绘制ROC曲线。plt.axis("square")设置坐标轴的纵横比为1,以保证图形显示为正方形。plt.xlabel("False positive rate")设置x轴的标签为"False positive rate",表示假阳性率。plt.ylabel("True positive rate")设置y轴的标签为"True positive rate",表示真阳性率。plt.title("ROC curve")设置图形的标题为"ROC curve",表示ROC曲线。- 最后,使用
plt.show()显示绘制的ROC曲线图形。
通过这段代码,你可以将计算得到的假阳性率(fpr)和真阳性率(tpr)传递给plt.plot()函数,绘制出对应的ROC曲线,并使用plt.xlabel()、plt.ylabel()和plt.title()设置坐标轴标签和标题。最后,使用plt.show()显示绘制的图形。
import matplotlib.pyplot as plt plt.plot(fpr, tpr) plt.axis("square") plt.xlabel("False positive rate") plt.ylabel("True positive rate") plt.title("ROC curve") plt.show()
- 1
完整代码如下
import numpy as np import matplotlib.pyplot as plt def roc(y_true, y_score, pos_label): """ y_true:真实标签 y_score:模型预测分数 pos_label:正样本标签,如“1” """ # 统计正样本和负样本的个数 num_positive_examples = (y_true == pos_label).sum() num_negtive_examples = len(y_true) - num_positive_examples tp, fp = 0, 0 tpr, fpr, thresholds = [], [], [] score = max(y_score) + 1 # 根据排序后的预测分数分别计算fpr和tpr for i in np.flip(np.argsort(y_score)): # 处理样本预测分数相同的情况 if y_score[i] != score: fpr.append(fp / num_negtive_examples) tpr.append(tp / num_positive_examples) thresholds.append(score) score = y_score[i] if y_true[i] == pos_label: tp += 1 else: fp += 1 fpr.append(fp / num_negtive_examples) tpr.append(tp / num_positive_examples) thresholds.append(score) return fpr, tpr, thresholds y_true = np.array( [1, 1, 0, 1, 1, 1, 0, 0, 1, 0, 1, 0, 1, 0, 0, 0, 1, 0, 1, 0] ) y_score = np.array([ .9, .8, .7, .6, .55, .54, .53, .52, .51, .505, .4, .39, .38, .37, .36, .35, .34, .33, .3, .1 ]) fpr, tpr, thresholds = roc(y_true, y_score, pos_label=1) plt.plot(fpr, tpr) plt.axis("square") plt.xlabel("False positive rate") plt.ylabel("True positive rate") plt.title("ROC curve") plt.show()
- 1
