- 1一篇文章简单介绍YOLO v1到v8的演变
- 2预处理数据的方法总结(使用sklearn-preprocessing)_preprocessing.normalize text2vec-large-chinese
- 3Java三大器之拦截器(Intercepter)的实现原理和代码示例_java innerinterceptor
- 4Jmeter(5.6) TCP二次开发-接口返回500仍然使用长连接_jmeter tcp长连接
- 5matlab矩阵连接图解_matlab把矩阵中的各点用图连接起来
- 6教室预约微信小程序,教室预约系统小程序,教室预约小程序系统毕业设计作品_微信小程序教室预约管理系统(有前后台)
- 7Android Jetpack 从使用到源码深耕【调度任务组件WorkManager 从实践到原理 】(一)_android 任务框架
- 8LLM大语言模型(四):在ChatGLM3-6B中使用langchain_chatglm3-6b langchain
- 9App封装打包_app打包封装
- 10信息系统项目管理师(2022年)—— 重点内容:知识产权与标准规范(22)_在开发过程应使用充分的手段保证开发质量,包括但不限于以下手段:
uni-app中自定义图表(canvas实现chart图表)开发篇(1)-圆环带进度条_uniapp 环形进度条
赞
踩
经常开发中,会遇到各种各样图表,这时大家普遍会想到去找插件。uniapp中常用的有uchart.js和echart.js,这对图表要求不高的项目来说,是很便捷的。但有时会遇到一些定制图表,加上UI的美化,这时就很难达到设计稿上的效果和客户要求了,在修改过程中也会消耗掉大量精力。俗话说:爹有娘有不如自己有,这种情况还不如通过canvas直接去实现,反而效率会快很多。这里先简单介绍实现一个“圆环带进度”的小案例,希望对大家有帮助。
一、uni-app中创建图表页面
1.1 vue页面
- <template>
- <view class="wrap-box">
- <view class="echart-box chart01">
- <view class="title">图表:圆环带进度条</view>
- <view class="content">
- <canvas canvas-id="chartBox1" id="chartBox1" class="chart"></canvas>
-
- <view class="btn-box">
- <button type="default" class="btn">减小</button>
- <button type="default" class="btn">增加</button>
- </view>
- </view>
- </view>
- </view>
- </template>
-
- <script>
- export default {
- data() {
- return {}
- },
- mounted() {},
- methods: {}
- }
- </script>
-
- <style lang="scss">
- @import './index.scss';
- </style>
1.2 scss样式文件
- .wrap-box{ padding: 0 30rpx;
- .echart-box{ padding: 15px 0; border-bottom: 1px solid #DDDDDD;
- .title{ font-size: 32rpx; }
- .content{ padding-top: 15rpx;
- .chart{ width: 300rpx; height: 300rpx; margin: 0 auto; }
- }
- .btn-box{ text-align: center;
- .btn{ display: inline-block; vertical-align: middle; margin: 0 20rpx; font-size: 30rpx; background-color: #297DFE; color: #fff; }
- }
- }
- }
1.3 创建chart.js文件
- /**
- * 图表 - 圆环带进度条
- */
- export class CircleBox {
- constructor(){}
- }
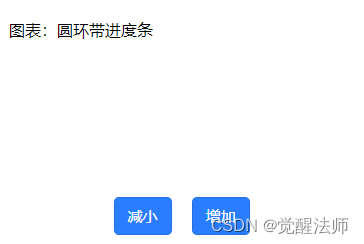
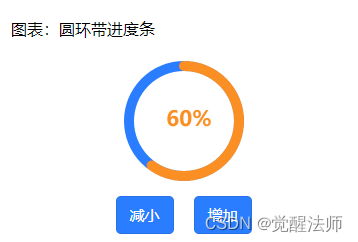
以上文件准备完成后,界面样式如下:

上图为现在样式

上图为实现后的样式。
二、实现chart图表绘制
2.1 chart.js中定义变量
在CircleBox类的构造函数中,初始化必须的变量,代码如下:
- /**
- * 构造函数
- * @param {Object} _context
- */
- constructor(_context){
- this.ctx = _context;
- //直径
- this.radius = uni.upx2px(300);
- //四周内填充
- this.padding = uni.upx2px(20);
- //圆环宽度
- this.lineWidth = uni.upx2px(20);
- //圆环颜色
- this.lineColor = '#297DFE';
- //当前百分比
- this.percent = 0;
- //进度条颜色
- this.percentLineColor = '#FB8F23';
- //字体大小
- this.fontSize = uni.upx2px(42);
- //字段颜色
- this.fontColor = '#FB8F23';
- }
2.2 chart.js中定义绘图函数
每次绘制前,需要先清理画布,先执行canvas的clearRect()函数,绘制完成记得执行draw()函数,否则页面不会显示绘图内容。代码如下:
- /**
- * 绘制圆环
- */
- drawCircle(){
- //清空画面
- this.ctx.clearRect(0, 0, this.radius, this.radius);
- //计算实际半径
- let _radius = this.radius/2-this.padding-this.lineWidth;
-
- //开始绘制圆环
- this.ctx.beginPath();
- this.ctx.arc(this.radius/2,this.radius/2,_radius,0,Math.PI*2, false);
- this.ctx.lineWidth = this.lineWidth;
- this.ctx.strokeStyle = this.lineColor;
- this.ctx.stroke();
-
- //绘制进度条部分
- this.ctx.beginPath();
- this.ctx.lineCap = 'round';
- this.ctx.arc(this.radius/2,this.radius/2,_radius,-(Math.PI / 2), ((Math.PI * 2) * this.percent) - Math.PI / 2, false);
- this.ctx.strokeStyle = this.percentLineColor;
- this.ctx.stroke();
- //恢复之前保存的绘图上下文
- this.ctx.restore();
-
- //绘制文字
- this.ctx.font = 'bold '+this.fontSize+'px sans-serif';
- this.ctx.setFillStyle(this.fontColor);
- this.ctx.setTextAlign('center');
- this.ctx.fillText(parseInt((this.percent*100))+'%', this.radius/2+(this.lineWidth/2), this.radius/2+(this.lineWidth/2), this.radius);
-
- //绘制图形
- this.ctx.draw();
- }
2.3 vue页面中定义对应变量
CircleBox类定义完成后,先通过import引入CircleBox类,代码如下:
import { CircleBox } from './charts.js';在vue页面中,定义相应变量,以便实现交互功能。data中创建相应变量,代码如下:
- data() {
- return {
- cbox1: null, //画布实例对象
- percent: 0, //当前进度值
- step: .1 //每次修改递增或递减值
- }
- }
2.4 vue页面中定义初始化函数
这时,可以在methods中定义个初始化函数,来展示下图表,代码如下:
- methods: {
- initCircle1(){
- //实例对象
- this.cbox1 = new CircleBox(uni.createCanvasContext('chartBox1'));
- //开始绘制
- this.cbox1.drawCircle();
- }
- }
图表需要在页面中渲染完成后,通过id获取canvas画布,所以咱们把初始函数放在mounted中执行,代码如下:
- export default {
- data() {
- return {
- cbox1: null, //画布实例对象
- percent: 0, //当前进度值
- step: .1 //每次修改递增或递减值
- }
- },
- mounted() {
- this.initCircle1();
- },
- methods: {
- initCircle1(){
- //实例对象
- this.cbox1 = new CircleBox(uni.createCanvasContext('chartBox1'));
- //开始绘制
- this.cbox1.drawCircle();
- }
- }
- }
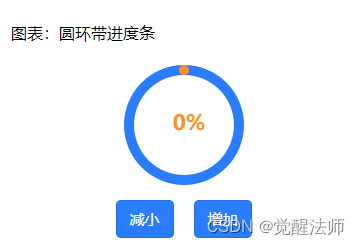
这里图表如下图所示:

2.5 vue页面中定义增加和减小函数
为了方便演示,这里添加了对percent值进行增加或减小功能,代码如下:
- methods: {
- initCircle1(){
- //实例对象
- this.cbox1 = new CircleBox(uni.createCanvasContext('chartBox1'));
- //开始绘制
- this.cbox1.drawCircle();
- }
- mulEvent(){
- //递减
- this.percent = this.percent - this.step <= 0 ? 0 : this.percent - this.step;
- //修改进度值
- this.cbox1.percent = this.percent;
- //重新绘制
- this.cbox1.drawCircle();
- },
- addEvent(){
- //递增
- this.percent = this.percent + this.step >= 1 ? 1 : this.percent + this.step;
- //修改进度值
- this.cbox1.percent = this.percent;
- //重新绘制
- this.cbox1.drawCircle();
- }
- }
在按钮上添加点击事件,代码如下:
- <button type="default" class="btn" @click="mulEvent()">减小</button>
- <button type="default" class="btn" @click="addEvent">增加</button>
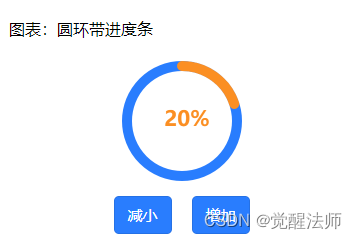
这时点击增加,进度条就会随之改变,比如点击2次后,显示为20%,如下图:

个人觉得,面对定制化功能,通过canvas原生去实现功能,不借助于插件,不仅可以更好实现定制化功能需求和减小不必要的精力消耗,对于后期积累也是至关重要的。后篇也会在此基础上,进行些复杂点图表改造,希望有助于大家。


