- 1python基于YOLOv7系列模型【yolov7-tiny/yolov7/yolov7x】开发构建钢铁产业产品智能自动化检测识别系统
- 2深度学习英语-迭代法(01)故事法,一个新的尝试_迭代学习英语
- 3利用卡尔曼滤波进行状态估计_恒定速度和转速模型 匀速圆周
- 4STM32CubeMX——定时器PWM实现_cubemax pwm
- 5前端开发服务器中的 Proxy 代理跨域实现原理解读_前端服务器代理请求
- 6C#变量_c# 带有静态存储持续时间的变量不能具有ref类型
- 7LangChain入门指南
- 8【使用python获取pdf所需数据】_python爬取pdf指定内容
- 9WebLogic 9新特性:Web Services_weblogic javax.jws.webservice 认证
- 10【MySQL】:DDL数据库定义与操作
win10+Python3.7.3+OpenCV3.4.1入门学习(十二 图像轮廓)———— 12.8 轮廓的特征值_min_val max_val min_loc max_loc
赞
踩
Python版本是Python3.7.3,OpenCV版本OpenCV3.4.1,开发环境为PyCharm
12.8 轮廓的特征值
轮廓自身的一些属性特征及轮廓所包围对象的特征对于描述图像具有重要意义。本节介绍几个轮廓自身的属性特征及轮廓所包围对象的特征。
12.8.1 宽高比
可以使用宽高比(AspectRation)来描述轮廓,例如矩形轮廓的宽高比为:
宽高比=宽度(Width)/高度(Height)
eg1:编写程序计算矩形轮廓的宽高比。
代码如下:
import cv2
o = cv2.imread('cc.bmp')
cv2.imshow("original",o)
gray = cv2.cvtColor(o,cv2.COLOR_BGR2GRAY)
ret, binary = cv2.threshold(gray,127,255,cv2.THRESH_BINARY)
image,contours, hierarchy = cv2.findContours(binary,
                                             cv2.RETR_LIST,
                                             cv2.CHAIN_APPROX_SIMPLE)
x,y,w,h = cv2.boundingRect(contours[0])
cv2.rectangle(o,(x,y),(x+w,y+h),(255,255,255),3)
aspectRatio = float(w)/h
print(aspectRatio)
cv2.imshow("result",o)
cv2.waitKey()
cv2.destroyAllWindows()
- 1
- 2
- 3
- 4
- 5
- 6
- 7
- 8
- 9
- 10
- 11
- 12
- 13
- 14
- 15
运行上述程序,会显示如下图所示的图像。其中:
● 左图是图像o。
● 右图显示了图像o的矩形轮廓。
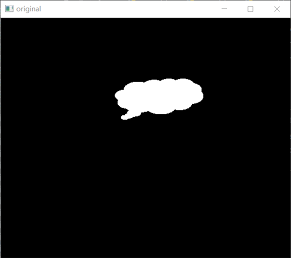
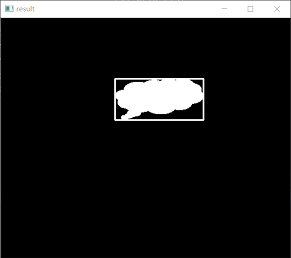
同时,程序还会显示如下的运行结果:
2.1506849315068495
- 1
可以看出,轮廓的宽高比约为2。
12.8.2 Extent
可以使用轮廓面积与矩形边界(矩形包围框、矩形轮廓)面积之比Extend来描述图像及其轮廓特征。计算方法为:

eg2:计算图像的轮廓面积与其矩形边界面积之比。
代码如下:
import cv2
o = cv2.imread('cc.bmp')
cv2.imshow("original",o)
gray = cv2.cvtColor(o,cv2.COLOR_BGR2GRAY)
ret, binary = cv2.threshold(gray,127,255,cv2.THRESH_BINARY)
image,contours, hierarchy = cv2.findContours(binary,
                                             cv2.RETR_LIST,
                                             cv2.CHAIN_APPROX_SIMPLE)
x,y,w,h = cv2.boundingRect(contours[0])
cv2.drawContours(o,contours[0],-1,(0,0,255),3)
cv2.rectangle(o,(x,y),(x+w,y+h),(255,0,0),3)
rectArea=w*h
cntArea=cv2.contourArea(contours[0])
extend=float(cntArea)/rectArea
print(extend)
cv2.imshow("result",o)
cv2.waitKey()
cv2.destroyAllWindows()
- 1
- 2
- 3
- 4
- 5
- 6
- 7
- 8
- 9
- 10
- 11
- 12
- 13
- 14
- 15
- 16
- 17
- 18
运行上述程序,会显示如下图所示的图像。其中:
● 左图是图像o。
● 右图内显示了图像o的矩形包围框及轮廓。


同时,程序还会显示如下的运行结果:
0.6717127650292296
- 1
可以看出,本例中图像的轮廓面积与矩形边界面积的比值大约为0.7。
12.8.3 Solidity
可以使用轮廓面积与凸包面积之比Solidity来衡量图像、轮廓及凸包的特征。其计算方法为:

eg3:编写程序计算图像轮廓面积与凸包面积之比。
代码如下:
import cv2
o = cv2.imread('hand.bmp')
cv2.imshow("original",o)
gray = cv2.cvtColor(o,cv2.COLOR_BGR2GRAY)
ret, binary = cv2.threshold(gray,127,255,cv2.THRESH_BINARY)
image,contours, hierarchy = cv2.findContours(binary,cv2.RETR_LIST,cv2.CHAIN_APPROX_SIMPLE)
cv2.drawContours(o,contours[0],-1,(0,0,255),3)
cntArea=cv2.contourArea(contours[0])
hull = cv2.convexHull(contours[0])
hullArea = cv2.contourArea(hull)
cv2.polylines(o, [hull], True, (0, 255, 0), 2)
solidity=float(cntArea)/hullArea
print(solidity)
cv2.imshow("result",o)
cv2.waitKey()
cv2.destroyAllWindows()
- 1
- 2
- 3
- 4
- 5
- 6
- 7
- 8
- 9
- 10
- 11
- 12
- 13
- 14
- 15
- 16
运行上述程序,会显示如下图所示的图像。其中:
● 左图是图像o。
● 右图是绘制了凸包和轮廓的图像。


同时,程序还会显示如下的运行结果:
0.6752344564084751
- 1
可以看出,本例中图像的轮廓面积与凸包面积的比值约为0.7。
12.8.4 等效直径(Equivalent Diameter)
可以用等效直径来衡量轮廓的特征值,该值是与轮廓面积相等的圆形的直径。其计算公式为:

eg4:计算与轮廓面积相等的圆形的直径,并绘制与该轮廓等面积的圆。
代码如下:
import cv2
import numpy as np
o = cv2.imread('cc.bmp')
cv2.imshow("original",o)
gray = cv2.cvtColor(o,cv2.COLOR_BGR2GRAY)
ret, binary = cv2.threshold(gray,127,255,cv2.THRESH_BINARY)
image,contours, hierarchy = cv2.findContours(binary,
                                             cv2.RETR_LIST,
                                             cv2.CHAIN_APPROX_SIMPLE)
cv2.drawContours(o,contours[0],-1,(0,0,255),3)
cntArea=cv2.contourArea(contours[0])
equiDiameter = np.sqrt(4*cntArea/np.pi)
print(equiDiameter)
cv2.circle(o,(100,100),int(equiDiameter/2),(0,0,255),3) #展示等直径大小的圆
cv2.imshow("result",o)
cv2.waitKey()
cv2.destroyAllWindows()
- 1
- 2
- 3
- 4
- 5
- 6
- 7
- 8
- 9
- 10
- 11
- 12
- 13
- 14
- 15
- 16
- 17
运行上述程序,会显示如下图所示的图像。其中:
● 左图是图像o。
● 右图显示了图像o的轮廓及与该轮廓等面积的圆(显示为灰色)。


同时,程序还会显示如下的运行结果:
99.00522529212108
- 1
可以看出,与本例中与轮廓面积相等的圆形的直径约为99。
12.8.5 方向
在OpenCV中,函数cv2.fitEllipse()可以用来构造最优拟合椭圆,还可以在返回值内分别返回椭圆的中心点、轴长、旋转角度等信息。使用这种形式,能够更直观地获取椭圆的方向等信息。
函数cv2.fitEllipse()返回各个属性值的语法格式为:
(x, y), (MA, ma), angle = cv2.fitEllipse(cnt)
- 1
式中几个返回值的意义如下:
● (x, y):椭圆的中心点。
● (MA, ma):椭圆水平方向轴和垂直方向轴的长度。
● angle:椭圆的旋转角度。
eg5:编写程序,观察函数cv2.fitEllipse()的不同返回值。
代码如下:
import cv2
o = cv2.imread('cc.bmp')
cv2.imshow("original",o)
gray = cv2.cvtColor(o,cv2.COLOR_BGR2GRAY)
ret, binary = cv2.threshold(gray,127,255,cv2.THRESH_BINARY)
image,contours, hierarchy = cv2.findContours(binary,
                                             cv2.RETR_LIST,
                                             cv2.CHAIN_APPROX_SIMPLE)
ellipse = cv2.fitEllipse(contours[0])
retval=cv2.fitEllipse(contours[0])
print("单个返回值形式:")
print("retval=\n",retval)
(x,y),(MA,ma),angle = cv2.fitEllipse(contours[0])
print("三个返回值形式:")
print("(x,y)=(",x,y,")")
print("(MA,ma)=(",MA,ma,")")
print("angle=",angle)
cv2.ellipse(o,ellipse,(0,0,255),2)
cv2.imshow("result",o)
cv2.waitKey()
cv2.destroyAllWindows()
- 1
- 2
- 3
- 4
- 5
- 6
- 7
- 8
- 9
- 10
- 11
- 12
- 13
- 14
- 15
- 16
- 17
- 18
- 19
- 20
- 21
运行上述程序,会显示如下图所示的图像。其中:
● 左图是图像o。
● 右图是图像o的最优拟合椭圆。


同时,程序还会显示如下的运行结果:
单个返回值形式:
retval=
 ((276.2112731933594, 139.6067352294922), (63.01350021362305, 166.72308349609375), 82.60102844238281)
三个返回值形式:
(x,y)=( 276.2112731933594 139.6067352294922 )
(MA,ma)=( 63.01350021362305 166.72308349609375 )
angle= 82.60102844238281
- 1
- 2
- 3
- 4
- 5
- 6
- 7
从以上运行结果可以看出,函数cv2.fitEllipse()以不同形式返回的值是相同的。
12.8.6 掩模和像素点
有时,我们希望获取某对象的掩模图像及其对应的点。12.2节介绍了将函数cv2.drawContours()的轮廓宽度参数thickness设置为“-1”,即可获取特定对象的实心轮廓,即特定对象的掩模。
另外,我们可能还希望获取轮廓像素点的具体位置信息。本节介绍如何获取轮廓(实心、空心)的像素点位置信息。
一般情况下,轮廓是图像内非零的像素点,可以通过两种方式获取轮廓像素点的位置信息。一种是使用Numpy函数,另外一种是使用OpenCV函数。
1.使用Numpy函数获取轮廓像素点
numpy.nonzero()函数能够找出数组内非零元素的位置,但是其返回值是将行、列分别显示的。
例如,对于如下数组a应用函数numpy.nonzero():
    a=
     [[0 0 0 1 0]
     [0 0 1 0 1]
     [0 0 1 1 1]
     [1 0 0 0 0]
     [1 0 0 0 1]]
- 1
- 2
- 3
- 4
- 5
- 6
返回的数组a内非零元素的位置信息为:
    (array([0, 1, 1, 2, 2, 2, 3, 4, 4], dtype=int64), array([3, 2, 4, 2, 3, 4, 0,
0, 4], dtype=int64))
- 1
- 2
使用numpy.transpose()函数处理上述返回值,则得到这些点的(x, y)形式的坐标:
    [[0 3]
     [1 2]
     [1 4]
     [2 2]
     [2 3]
     [2 4]
     [3 0]
     [4 0]
     [4 4]]
- 1
- 2
- 3
- 4
- 5
- 6
- 7
- 8
- 9
eg6:使用Numpy函数获取一个数组内的非零值元素的位置信息。
代码如下:
import numpy as np
#------------生成一个都是0值的a-------------------
a=np.zeros((5,5),dtype=np.uint8)
#-------随机将其中10个位置上的数值设置为1------------
#---times控制次数
#---i,j是随机生成的行、列位置
#---a[i,j]=1,将随机挑选出来的位置上的值设置为1
for times in range(10):
    i=np.random.randint(0,5)
    j=np.random.randint(0,5)
    a[i,j]=1
#-------打印a,观察a内值的情况-----------
print("a=\n",a)
#------查找a内非零值的位置信息------------
loc=np.transpose(np.nonzero(a))
#-----将a内非零值的位置信息输出------------
print("a内非零值位置:\n",loc)
- 1
- 2
- 3
- 4
- 5
- 6
- 7
- 8
- 9
- 10
- 11
- 12
- 13
- 14
- 15
- 16
- 17
- 18
运行上述程序,会显示如下的运行结果:
a=
 [[0 0 0 0 0]
 [1 1 0 0 0]
 [0 0 0 0 0]
 [1 0 0 0 1]
 [1 1 1 0 0]]
a内非零值位置:
 [[1 0]
 [1 1]
 [3 0]
 [3 4]
 [4 0]
 [4 1]
 [4 2]]
- 1
- 2
- 3
- 4
- 5
- 6
- 7
- 8
- 9
- 10
- 11
- 12
- 13
- 14
eg7:使用Numpy函数获取一个图像内的轮廓点位置。
:代码如下:
import cv2
import numpy as np
#-----------------读取原始图像----------------------
o = cv2.imread('cc.bmp')
cv2.imshow("original",o)
#-----------------获取轮廓------------------------
gray = cv2.cvtColor(o,cv2.COLOR_BGR2GRAY)
ret, binary = cv2.threshold(gray,127,255,cv2.THRESH_BINARY)
image,contours, hierarchy = cv2.findContours(binary,
                                             cv2.RETR_LIST,
                                             cv2.CHAIN_APPROX_SIMPLE)
cnt=contours[0]
#-----------------绘制空心轮廓------------------------
mask1 = np.zeros(gray.shape,np.uint8)
cv2.drawContours(mask1,[cnt],0,255,2)
pixelpoints1 = np.transpose(np.nonzero(mask1))
print("pixelpoints1.shape=",pixelpoints1.shape)
print("pixelpoints1=\n",pixelpoints1)
cv2.imshow("mask1",mask1)
#-----------------绘制实心轮廓---------------------
mask2 = np.zeros(gray.shape,np.uint8)
cv2.drawContours(mask2,[cnt],0,255,-1)
pixelpoints2 = np.transpose(np.nonzero(mask2))
print("pixelpoints2.shape=",pixelpoints2.shape)
print("pixelpoints2=\n",pixelpoints2)
cv2.imshow("mask2",mask2)
#-----------------释放窗口------------------------
cv2.waitKey()
cv2.destroyAllWindows()
- 1
- 2
- 3
- 4
- 5
- 6
- 7
- 8
- 9
- 10
- 11
- 12
- 13
- 14
- 15
- 16
- 17
- 18
- 19
- 20
- 21
- 22
- 23
- 24
- 25
- 26
- 27
- 28
- 29
运行上述程序,会显示如下图所示的图像。其中:
● 左图是图像o。
● 中间的是空心轮廓图像mask1。
● 右图是实心轮廓图像mask2。
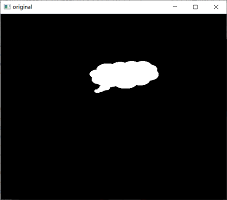
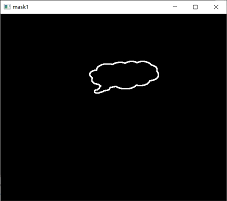
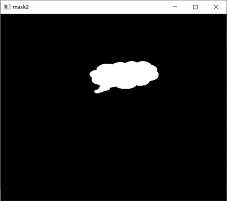
同时,程序还会显示如下的运行结果:
pixelpoints1.shape= (1400, 2)
pixelpoints1=
 [[106 292]
 [106 293]
 [106 294]
 ...
 [180 222]
 [180 223]
 [180 224]]
pixelpoints2.shape= (7892, 2)
pixelpoints2=
 [[107 293]
 [107 294]
 [107 295]
 ...
 [179 221]
 [179 222]
 [179 223]]
- 1
- 2
- 3
- 4
- 5
- 6
- 7
- 8
- 9
- 10
- 11
- 12
- 13
- 14
- 15
- 16
- 17
- 18
2.使用OpenCV函数获取轮廓点
OpenCV提供了函数cv2.findNonZero()用于查找非零元素的索引。该函数的语法格式为:
idx = cv2.findNonZero( src )
- 1
式中:
● idx为返回值,表示非零元素的索引位置。需要注意的是,在返回的索引中,每个元素对应的是(列号,行号)的格式。
● src为参数,表示要查找非零元素的图像。
eg8:使用OpenCV函数cv2.findNonZero()获取一个数组内的非零值。
代码如下:
import cv2
import numpy as np
#------------生成一个都是0值的a-------------------
a=np.zeros((5,5),dtype=np.uint8)
#-------随机将其中10个位置上的数值设置为1------------
#---times控制次数
#---i,j是随机生成的行、列位置
#---a[i,j]=1,将随机挑选出来的位置上的值设置为1
for times in range(10):
    i=np.random.randint(0,5)
    j=np.random.randint(0,5)
    a[i,j]=1
#-------打印a,观察a内值的情况-----------
print("a=\n",a)
#------查找a内非零值的位置信息------------
loc = cv2.findNonZero(a)
#-----将a内非零值的位置信息输出------------
print("a内非零值位置:\n",loc)
- 1
- 2
- 3
- 4
- 5
- 6
- 7
- 8
- 9
- 10
- 11
- 12
- 13
- 14
- 15
- 16
- 17
- 18
运行上述程序,会显示如下的运行结果:
a=
 [[0 0 0 1 0]
 [0 0 0 0 0]
 [0 0 1 1 0]
 [0 1 0 1 1]
 [0 0 0 0 1]]
a内非零值位置:
 [[[3 0]]

 [[2 2]]

 [[3 2]]

 [[1 3]]

 [[3 3]]

 [[4 3]]

 [[4 4]]]
- 1
- 2
- 3
- 4
- 5
- 6
- 7
- 8
- 9
- 10
- 11
- 12
- 13
- 14
- 15
- 16
- 17
- 18
- 19
- 20
eg9:使用OpenCV函数cv2.findNonZero()获取一个图像内的轮廓点的位置。
代码如下:
import cv2
import numpy as np
#-----------------读取原始图像----------------------
o = cv2.imread('cc.bmp')
cv2.imshow("original",o)
#-----------------获取轮廓------------------------
gray = cv2.cvtColor(o,cv2.COLOR_BGR2GRAY)
ret, binary = cv2.threshold(gray,127,255,cv2.THRESH_BINARY)
image,contours, hierarchy = cv2.findContours(binary,
                                             cv2.RETR_LIST,
                                             cv2.CHAIN_APPROX_SIMPLE)
cnt=contours[0]
#-----------------绘制空心轮廓------------------------
mask1 = np.zeros(gray.shape,np.uint8)
cv2.drawContours(mask1,[cnt],0,255,2)
pixelpoints1 = cv2.findNonZero(mask1)
print("pixelpoints1.shape=",pixelpoints1.shape)
print("pixelpoints1=\n",pixelpoints1)
cv2.imshow("mask1",mask1)
#-----------------绘制实心轮廓---------------------
mask2 = np.zeros(gray.shape,np.uint8)
cv2.drawContours(mask2,[cnt],0,255,-1)
pixelpoints2 = cv2.findNonZero(mask2)
print("pixelpoints2.shape=",pixelpoints2.shape)
print("pixelpoints2=\n",pixelpoints2)
cv2.imshow("mask2",mask2)
#-----------------释放窗口------------------------
cv2.waitKey()
cv2.destroyAllWindows()
- 1
- 2
- 3
- 4
- 5
- 6
- 7
- 8
- 9
- 10
- 11
- 12
- 13
- 14
- 15
- 16
- 17
- 18
- 19
- 20
- 21
- 22
- 23
- 24
- 25
- 26
- 27
- 28
- 29
运行上述程序,会显示如下图所示的图像。其中:
● 左图是图像o。
● 中间的是空心轮廓图像mask1。
● 右图是实心轮廓图像mask2。


同时,程序还会显示如下的运行结果:
pixelpoints1.shape= (1400, 1, 2)
pixelpoints1=
 [[[292 106]]

 [[293 106]]

 [[294 106]]

 ...

 [[222 180]]

 [[223 180]]

 [[224 180]]]
pixelpoints2.shape= (7892, 1, 2)
pixelpoints2=
 [[[293 107]]

 [[294 107]]

 [[295 107]]

 ...

 [[221 179]]

 [[222 179]]

 [[223 179]]]
- 1
- 2
- 3
- 4
- 5
- 6
- 7
- 8
- 9
- 10
- 11
- 12
- 13
- 14
- 15
- 16
- 17
- 18
- 19
- 20
- 21
- 22
- 23
- 24
- 25
- 26
- 27
- 28
- 29
- 30
12.8.7 最大值和最小值及它们的位置
OpenCV提供了函数cv2.minMaxLoc(),用于在指定的对象内查找最大值、最小值及其位置。该函数的语法格式是:
min_val, max_val, min_loc, max_loc = cv2.minMaxLoc(imgray, mask = mask)
- 1
式中的返回值为:
● min_val:最小值。
● max_val:最大值。
● min_loc:最小值的位置。
● max_loc:最大值的位置。
式中的参数如下:
● imgray:单通道图像。
● mask:掩模。通过使用掩模图像,可以得到掩模指定区域内的最值信息。
eg10:使用函数cv2.minMaxLoc()在图像内查找掩模指定区域内的最大值、最小值及其位置。
代码如下:
import cv2
import numpy as np
o = cv2.imread('ct.png')
cv2.imshow("original",o)
gray = cv2.cvtColor(o,cv2.COLOR_BGR2GRAY)
ret, binary = cv2.threshold(gray,127,255,cv2.THRESH_BINARY)
image,contours, hierarchy = cv2.findContours(binary,
                                             cv2.RETR_LIST,
                                             cv2.CHAIN_APPROX_SIMPLE)
cnt=contours[2]   #coutours[0]、coutours[1]是左侧字母R
#--------使用掩膜获取感兴趣区域的最值-----------------
#需要注意minMaxLoc处理的对象为灰度图像,本例中处理对象为灰度图像gray
#如果希望获取彩色图像的,需要提取各个通道,将每个通道独立计算最值
mask = np.zeros(gray.shape,np.uint8)
mask=cv2.drawContours(mask,[cnt],-1,255,-1)
minVal, maxVal, minLoc, maxLoc = cv2.minMaxLoc(gray,mask = mask)
print("minVal=",minVal)
print("maxVal=",maxVal)
print("minLoc=",minLoc)
print("maxLoc=",maxLoc)
#--------使用掩膜获取感兴趣区域并显示-----------------
masko = np.zeros(o.shape,np.uint8)
masko=cv2.drawContours(masko,[cnt],-1,(255,255,255),-1)
loc=cv2.bitwise_and(o,masko)
cv2.imshow("mask",loc)
#显示灰度结果
#loc=cv2.bitwise_and(gray,mask)
#cv2.imshow("mask",loc)
#--------释放窗口-----------------
cv2.waitKey()
cv2.destroyAllWindows()
- 1
- 2
- 3
- 4
- 5
- 6
- 7
- 8
- 9
- 10
- 11
- 12
- 13
- 14
- 15
- 16
- 17
- 18
- 19
- 20
- 21
- 22
- 23
- 24
- 25
- 26
- 27
- 28
- 29
- 30
- 31
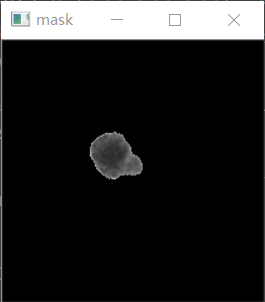
运行上述程序,会显示如下图所示的图像。其中:
● 左图是图像o。
● 右图是掩模图像mask。
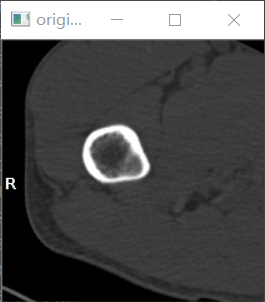
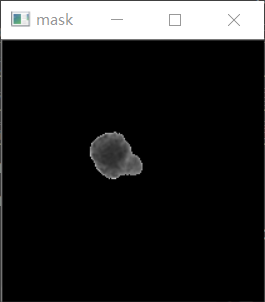
同时,程序还会显示如下的运行结果:
minVal= 42.0
maxVal= 200.0
minLoc= (87, 90)
maxLoc= (90, 110)
- 1
- 2
- 3
- 4
12.8.8 平均颜色及平均灰度
OpenCV提供了函数cv2.mean(),用于计算一个对象的平均颜色或平均灰度。该函数的语法格式为:
mean_val = cv2.mean(im, mask = mask)
- 1
式中的返回值为mean_val,表示返回的平均值。
式中的参数如下:
● im:原图像。
● mask:掩模。
eg11:使用函数cv2.mean()计算一个对象的平均灰度。
代码如下:
import cv2
import numpy as np
#--------读取并显示原始图像-----------------
o = cv2.imread('ct.png')
cv2.imshow("original",o)
#--------获取轮廓-----------------
gray = cv2.cvtColor(o,cv2.COLOR_BGR2GRAY)
ret, binary = cv2.threshold(gray,127,255,cv2.THRESH_BINARY)
image,contours, hierarchy = cv2.findContours(binary,
                                             cv2.RETR_LIST,
                                             cv2.CHAIN_APPROX_SIMPLE)
cnt=contours[2]
#--------使用掩膜获取感兴趣区域的均值-----------------
mask = np.zeros(gray.shape,np.uint8)#构造mean所使用的掩膜,必须是单通道的
cv2.drawContours(mask,[cnt],0,(255,255,255),-1)
meanVal = cv2.mean(o,mask = mask)  #mask是区域,所以必须是单通道的
print("meanVal=\n",meanVal)
#--------使用掩膜获取感兴趣区域并显示-----------------
masko = np.zeros(o.shape,np.uint8)
cv2.drawContours(masko,[cnt],-1,(255,255,255),-1)
loc=cv2.bitwise_and(o,masko)
cv2.imshow("mask",loc)
#--------释放窗口-----------------
cv2.waitKey()
cv2.destroyAllWindows()
- 1
- 2
- 3
- 4
- 5
- 6
- 7
- 8
- 9
- 10
- 11
- 12
- 13
- 14
- 15
- 16
- 17
- 18
- 19
- 20
- 21
- 22
- 23
- 24
- 25
运行上述程序,会显示如下图所示的图像。其中:
● 左图是图像o。
● 右图是获取的感兴趣区域。
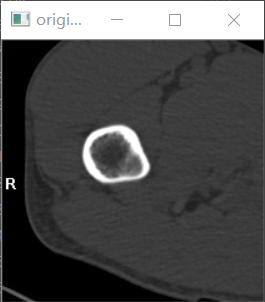
同时,程序还会显示如下的运行结果:
meanVal=
 (85.45594913714805, 85.45594913714805, 85.45594913714805, 0.0)
- 1
- 2
从上述结果可以看出,函数cv2.mean()能够计算各个通道的均值。上述4个值分别是RGB和A通道(alpha通道)的均值。本例中,RGB三个通道的值相同,所以计算出的均值也是一样的。
12.8.9 极点
有时,我们希望获取某个对象内的极值点,例如最左端、最右端、最上端、最下端的四个点。OpenCV提供了相应的函数来找出这些点,通常的语法格式是:
    leftmost = tuple(cnt[cnt[:, :,0].argmin()][0])
    rightmost = tuple(cnt[cnt[:, :,0].argmax()][0])
    topmost = tuple(cnt[cnt[:, :,1].argmin()][0])
    bottommost = tuple(cnt[cnt[:, :,1].argmax()][0])
- 1
- 2
- 3
- 4
eg12:计算一幅图像内的极值点。
代码如下:
import cv2
import numpy as np
o = cv2.imread('cs.bmp')
#--------获取并绘制轮廓-----------------
gray = cv2.cvtColor(o,cv2.COLOR_BGR2GRAY)
ret, binary = cv2.threshold(gray,127,255,cv2.THRESH_BINARY)
image,contours, hierarchy = cv2.findContours(binary,cv2.RETR_LIST,cv2.CHAIN_APPROX_SIMPLE)
mask = np.zeros(gray.shape,np.uint8)
cnt=contours[0]
cv2.drawContours(mask,[cnt],0,255,-1)
#--------计算极值-----------------
leftmost = tuple(cnt[cnt[:,:,0].argmin()][0])
rightmost = tuple(cnt[cnt[:,:,0].argmax()][0])
topmost = tuple(cnt[cnt[:,:,1].argmin()][0])
bottommost = tuple(cnt[cnt[:,:,1].argmax()][0])
#--------计算极值-----------------
print("leftmost=",leftmost)
print("rightmost=",rightmost)
print("topmost=",topmost)
print("bottommost=",bottommost)
#--------绘制说明文字-----------------
font=cv2.FONT_HERSHEY_SIMPLEX
cv2.putText(o,'A',leftmost, font, 1,(0,0,255),2)
cv2.putText(o,'B',rightmost, font, 1,(0,0,255),2)
cv2.putText(o,'C',topmost, font, 1,(0,0,255),2)
cv2.putText(o,'D',bottommost, font, 1,(0,0,255),2)
#--------绘制图像-----------------
cv2.imshow("result",o)
#--------释放窗口-----------------
cv2.waitKey()
cv2.destroyAllWindows()
- 1
- 2
- 3
- 4
- 5
- 6
- 7
- 8
- 9
- 10
- 11
- 12
- 13
- 14
- 15
- 16
- 17
- 18
- 19
- 20
- 21
- 22
- 23
- 24
- 25
- 26
- 27
- 28
- 29
- 30
- 31
运行上述程序,会显示如下图所示的图像。

同时,程序还会显示如下的运行结果:
leftmost= (202, 135)
rightmost= (423, 120)
topmost= (369, 69)
bottommost= (216, 179)
- 1
- 2
- 3
- 4


