- 1不知道如何测试?全网最全网络安全渗透测试流程给你答案!_网络安全测试
- 2我的技术博客地址_mjios cnblogs
- 35.gradle配置和project_gradle implementation project
- 4idea分支合并_idea 分支合并
- 5爬table数据_Python爬虫 福布斯排行榜 数据可视化
- 6Vue+ElmentUI在table表格中表头位置插入Dropdown下拉菜单实现过滤效果_table 表头下拉框
- 7基于混沌算法的图像加密解密系统_为什么图像加密要用混沌
- 8AI绘画Stable Diffusion 图生图必看教程:局部重绘和涂鸦重绘详解,超强操作流程奉上!_涂鸦重绘和局部重绘区别
- 9基于深度学习的聊天机器人项目
- 10Python绘制多分类ROC曲线_决策树多分类roc
第100+9步 ChatGPT文献复现:ARIMA预测百日咳_chat gpt 可以用spss吗
赞
踩
基于WIN10的64位系统演示
一、写在前面
我们来继续换一篇文章来学习学习:
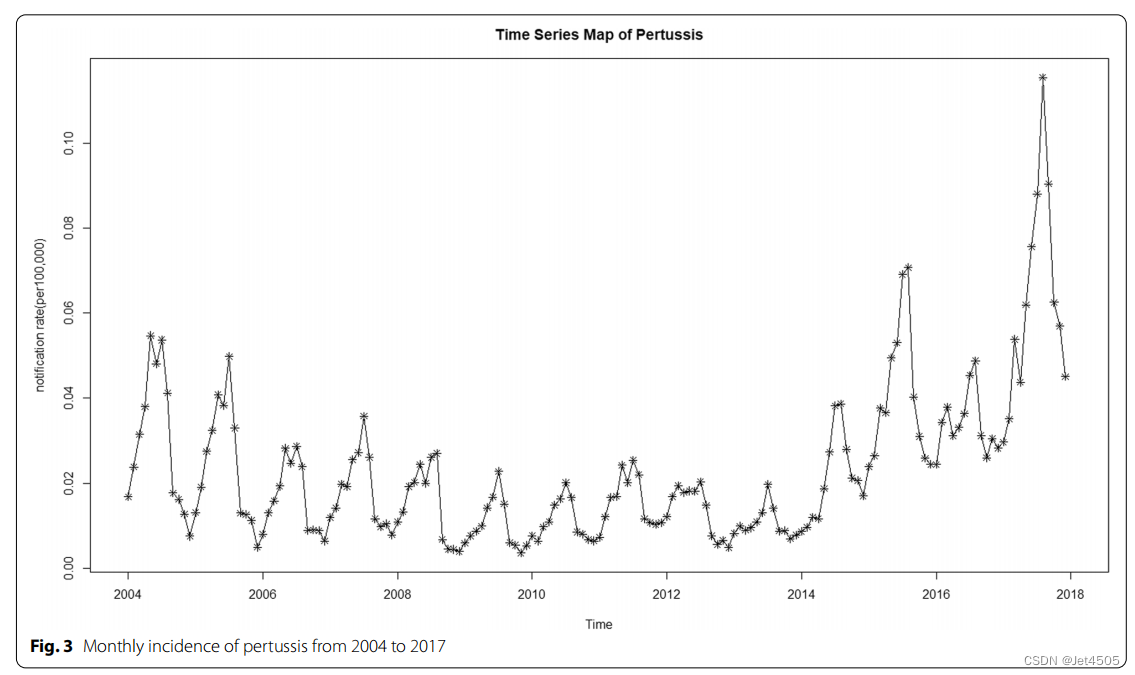
《BMC Public Health》杂志的2022年一篇题目为《ARIMA and ARIMA-ERNN models for prediction of pertussis incidence in mainland China from 2004 to 2021》文章的模拟数据做案例。
这文章做的是用:使用单纯ARIMA模型和ARIMA-ERNN组合模型预测中国大陆百日咳发病率。
文章是用单纯的ARIMA模型作为对照,更新了ARIMA-ERNN模型。本期,我们先来尝试ARIMA模型。
数据不是原始数据哈,是我使用GPT-4根据文章的散点图提取出来近似数据,只弄到了2004-2017年的。
二、闲聊和复现:
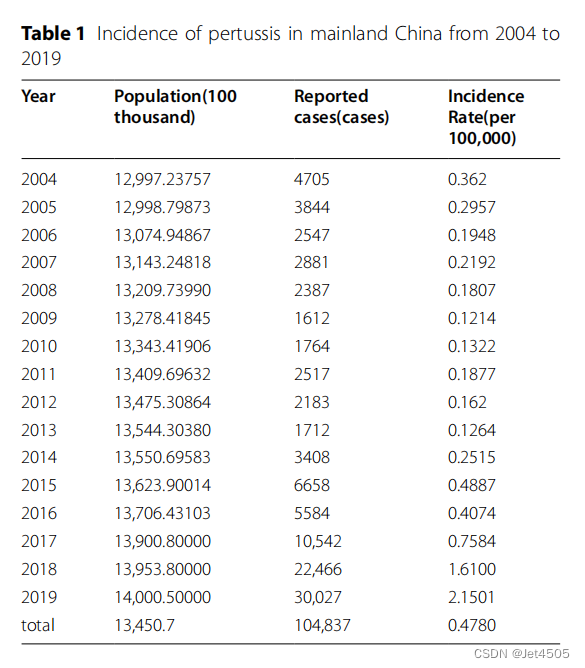
(1)数据基本描述
没啥好说的,就是最最基本的描述统计。
要是有原始数据,直接可以让GPT-4帮分析。
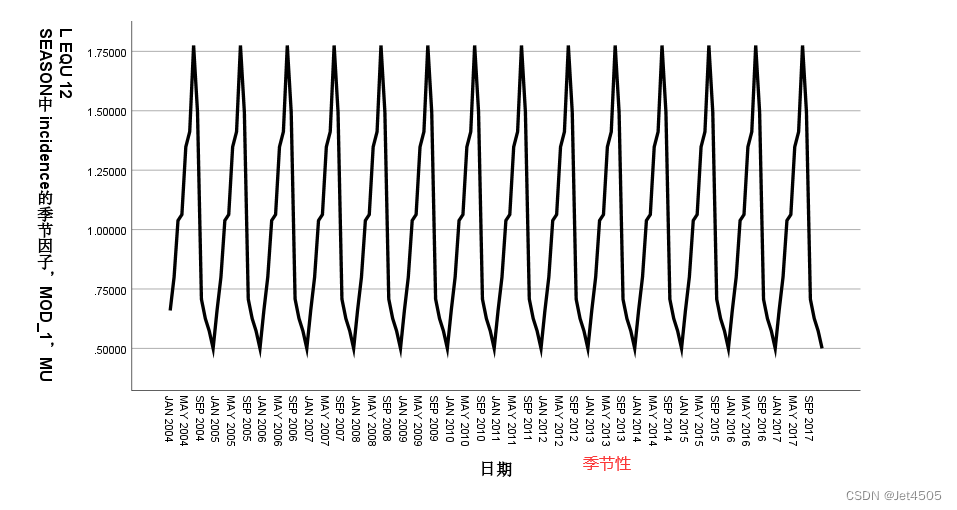
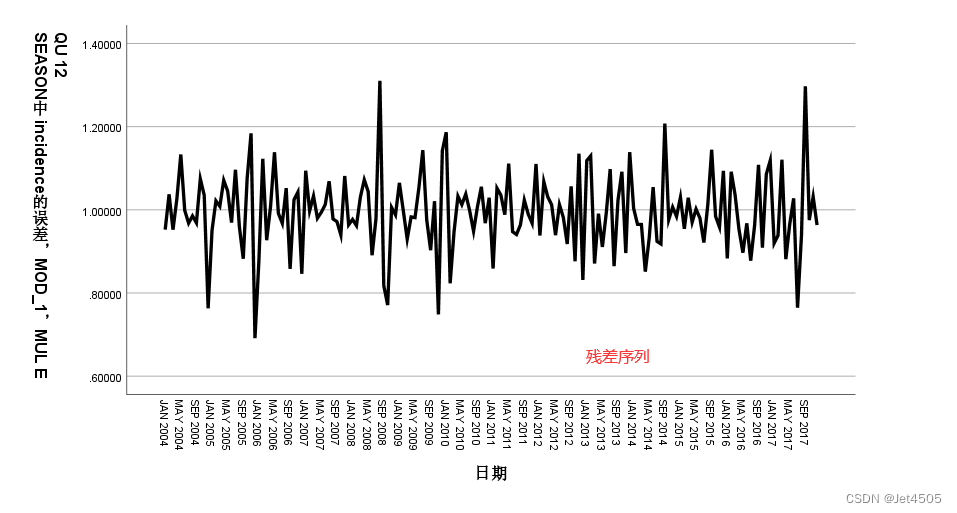
(2)季节拆分
之前介绍过了哈,使用SPSS也可以实现,文章使用的是R语言:
①首先,使用GPT-4生成:
咒语:
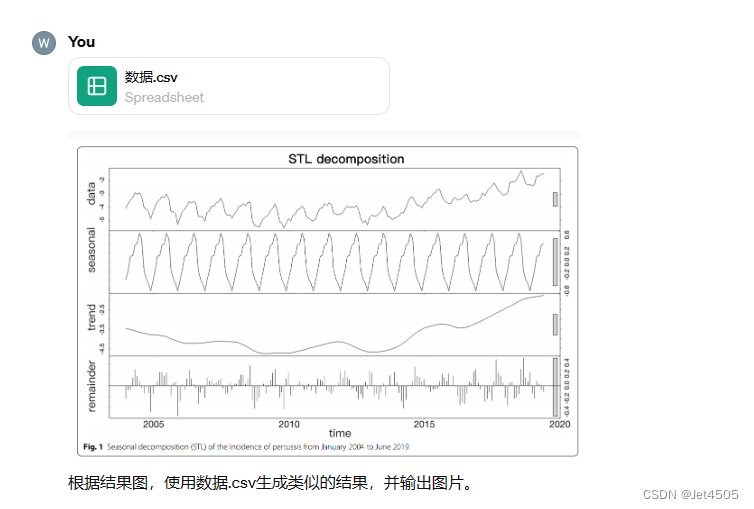
直接输出结果:

注意哈,我的数据是模拟数据,且只到2017年12月,所以乍一看跟文章的略有偏差。
GPT给出的代码(Python)供参考:
- import pandas as pd
- from statsmodels.tsa.seasonal import STL
- import matplotlib.pyplot as plt
-
- # Load the data from the CSV file
- data = pd.read_csv('/mnt/data/数据.csv')
-
- # Convert the 'time' column to datetime to facilitate resampling by year
- data['time'] = pd.to_datetime(data['time'], format='%b-%y')
-
- # Set the time column as index and set frequency to month start
- data.set_index('time', inplace=True)
- data.index.freq = 'MS'
-
- # Prepare the data for STL decomposition by ensuring it has a frequency (monthly data)
- # Apply STL decomposition with a seasonal period of 13 (adjusted as needed)
- stl = STL(data['incidence'], seasonal=13)
- result = stl.fit()
-
- # Plotting the results of the STL decomposition
- plt.figure(figsize=(12, 8))
-
- # Original data plot
- plt.subplot(4, 1, 1)
- plt.plot(result.observed)
- plt.title('Original Data')
-
- # Seasonal component plot
- plt.subplot(4, 1, 2)
- plt.plot(result.seasonal)
- plt.title('Seasonal Component')
-
- # Trend component plot
- plt.subplot(4, 1, 3)
- plt.plot(result.trend)
- plt.title('Trend Component')
-
- # Residual plot
- plt.subplot(4, 1, 4)
- plt.plot(result.resid)
- plt.title('Residual')
-
- # Adjust layout and save the figure to a file
- plt.tight_layout()
- plt.savefig('/mnt/data/STL_Decomposition_Corrected.png')
-
- plt.show()
②首先,使用SPSS生成:
步骤我在简单过一下,大家巩固记忆:
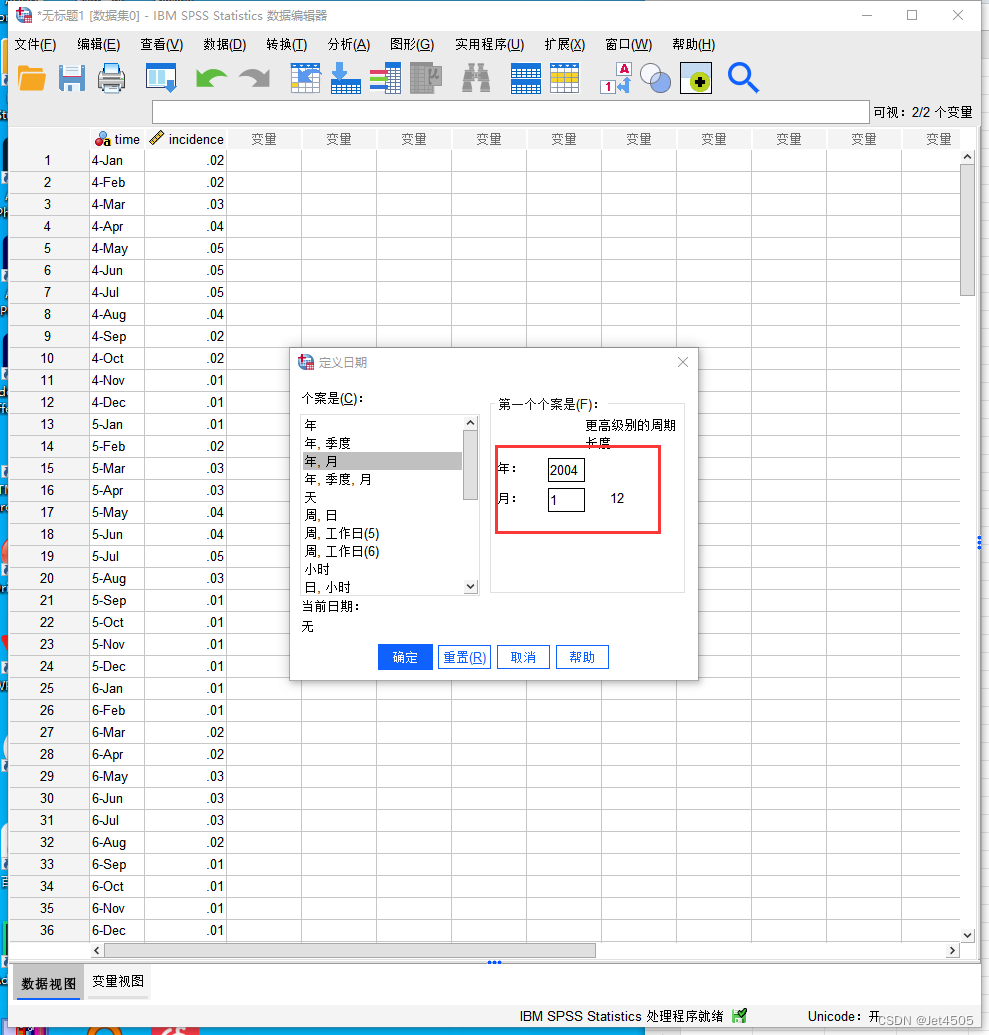
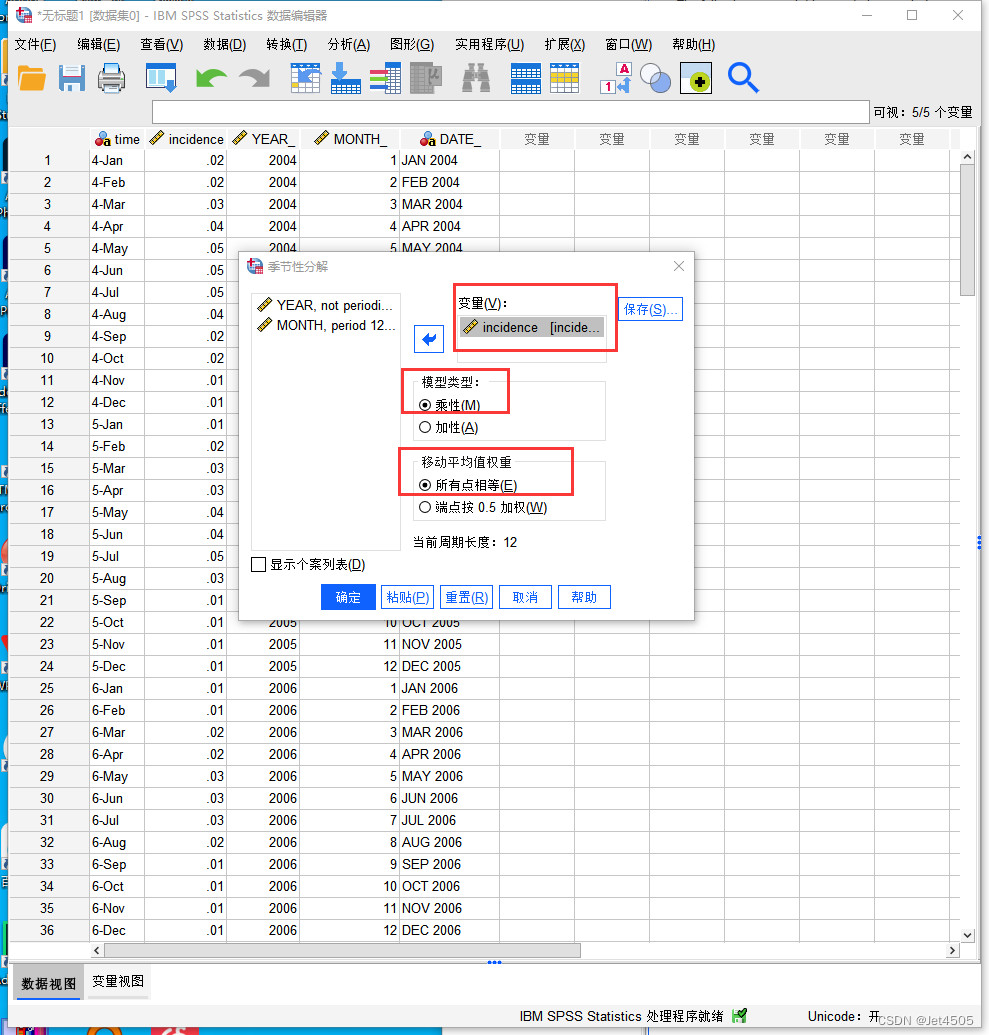
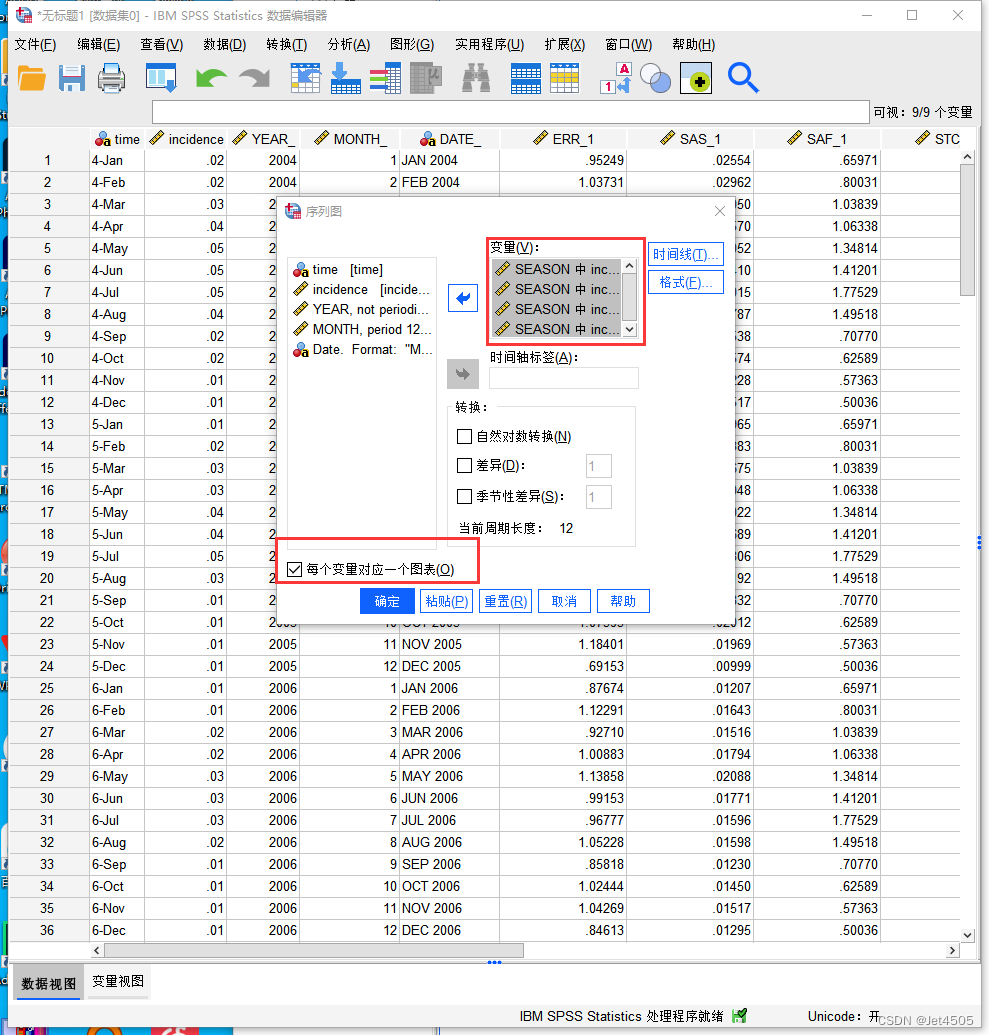
看结果:

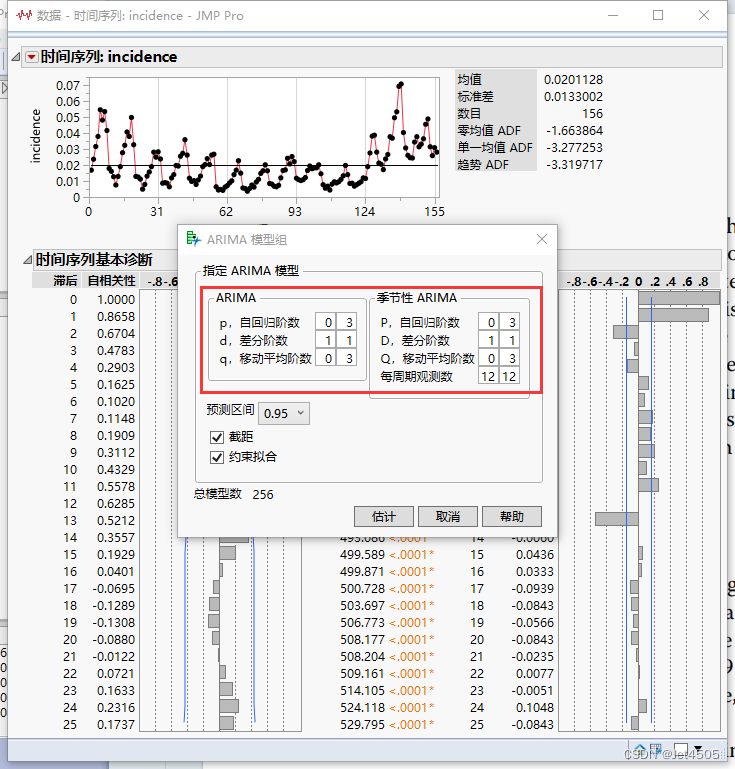
(2)构建ARIMA模型
文章使用的是SAS建模,那我就用JMP展示(传送门):
看到季节性和总体上升趋势,直接无脑d和D取1,然后p、q、P、Q取值0、1、2、3即可:
结果最优模型如下:
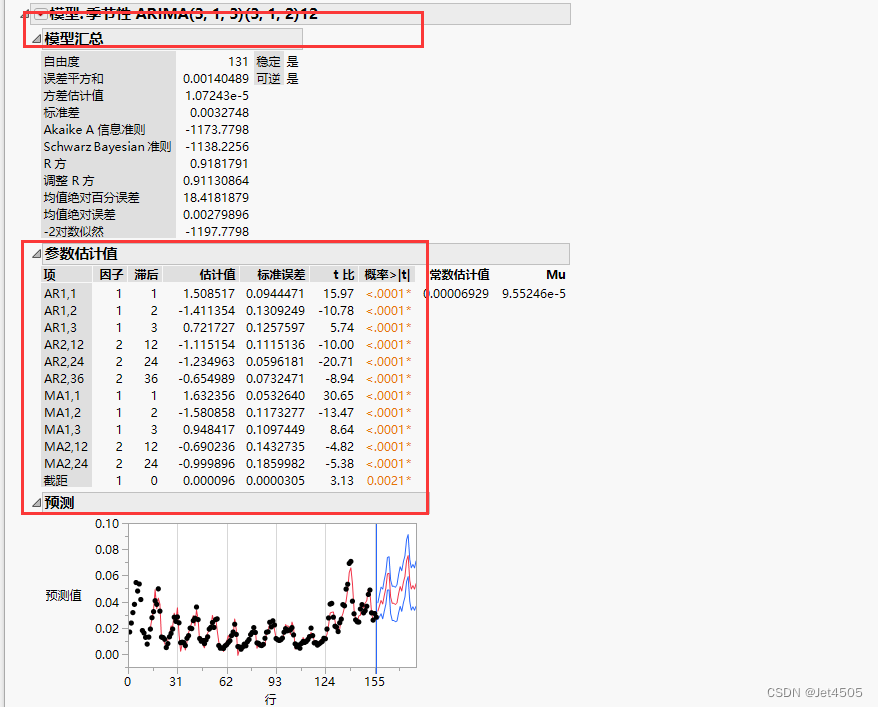
ARIMA(3,1,3)(3,1,2)12:拟合的MAPE为27%,预测的MAPE为18%,比文章的高一些,不过基本处于一个数量级水平。
不用纠结为啥ARIMA参数不同,实验条件都不一样。
三、后话
到目前为止,大家应该熟练掌握单纯ARIMA模型了吧。
四、数据
不提供,自行根据下图提取吧。
实在没有GPT-4,那就这个:
https://apps.automeris.io/wpd/index.zh_CN.html