热门标签
热门文章
- 1java开发工具和开发平台区别_重新认识一下当红应用开发工具——低代码开发平台...
- 2【力扣hot100】25 K个一组反转链表(c++)解析
- 3GitLab 详细安装及使用教程
- 4基于遗传算法实现无人机三维路径规划_三维路径规划算法如何生成初始种群
- 5【linux基础(七)】Linux中的开发工具(下)--make/makefile和git_make linux
- 6EdgeOne 边缘函数 - 如何实现“防盗”与访问控制
- 7旅游卡系统搭建小程序
- 8docker inspect --format 详解
- 9电力线路故障检测:机器学习应用于电力系统维护和故障预测_机器学习与水电机组故障检修的结合
- 10文件操作(c++)_c++写文件 ios
当前位置: article > 正文
matlab简单处理图像_matlab进行简单图像处理
作者:笔触狂放9 | 2024-04-05 03:17:25
赞
踩
matlab进行简单图像处理
前言
记载一些Matlab中处理图像的简单函数
1.读取图像
1.1 方法1
[filename pathname]=uigetfile('*.*,*.png','文件选择','*.png')
im = imread([pathname filename]);
imshow(im);
title('原图');
- 1
- 2
- 3
- 4
1.2 方法2
im = imread('rabbit.jpg');
imshow(im);
title('原图');
- 1
- 2
- 3
1.3 显示索引图像
[x,map] = imread('rabbit.jpg');
imshow(x);
title('原图');
- 1
- 2
- 3
1.4 直接显示图像
imshow('girl.jpg');
im=getimage;
- 1
- 2
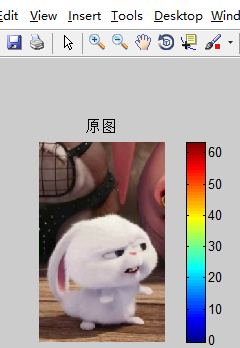
2.colorbar显示色阶颜色栏
[x,map] = imread('rabbit.jpg');
imshow(x);
title('原图');
colorbar;
- 1
- 2
- 3
- 4

3. 显示二值图像
3.1双精度灰度图像
bw1=zeros(100,100);
bw1(2:2:98,2:2:98)=1;
imshow(bw1);
- 1
- 2
- 3
运行结果:

3.2 8位的灰度图像
bw1 = zeros(100,100);
bw1(2:2:98,2:2:98)=1;
bw2 = uint8(bw1);
imshow(bw2,[]);
colorbar;
- 1
- 2
- 3
- 4
- 5

4. subimage 多图显示
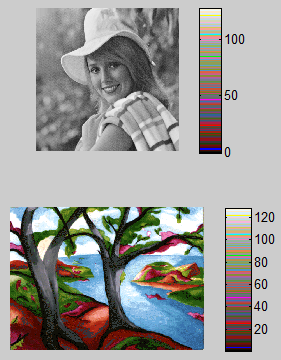
4.1多图显示多个调色板的图像
load trees;
[x2,map2]=imread('girl.jpg');
subplot(2,1,1),subimage(X,map);colorbar;
subplot(2,1,2),subimage(x2);colorbar ;
- 1
- 2
- 3
- 4

4.2不用专用函数显示多图
load trees;      %读取二进制数据文件
[x2,map2]=imread('girl.jpg');
subplot(2,1,1),imshow(x2,map2);colorbar
subplot(2,1,2),imshow(X,map);colorbar
- 1
- 2
- 3
- 4

5.保存图像
代码如下(示例):
[x,map] = imread('girl.jpg');
imwrite(x,'girl.tif');
- 1
- 2
6.数字图像读取
imfinfo('girl.jpg')
- 1

7.图像的灰度直方图
im = imread('girl.jpg');
if ndims(im) == 3
   im = rgb2gray(im);      %如果非灰度图像,则转换为灰度图像
end
imhist(im);
- 1
- 2
- 3
- 4
- 5

8.图像对比度增强
I = imread('girl.jpg');
J = imadjust(I,[0.3 0.7],[]);
subplot(1,2,1);
imshow(I);
title('原图');
subplot(1,2,2);
imshow(J);
title('对比度增强后');
- 1
- 2
- 3
- 4
- 5
- 6
- 7
- 8

9.人为加噪声
I=imread('F:\已学专业课\大三专业课\数字图像处理\作业\实验\02\image\girl.jpg');
J1=imnoise(I, 'gaussian',0,0.02);
J2=imnoise(I, 'salt & pepper',0.02);
J3=imnoise(I, 'speckle',0.02);
subplot(2,2,1),imshow(I),title('原图像');
subplot(2,2,2),imshow(J1),title('加高斯噪声');
subplot(2,2,3),imshow(J2),title('加椒盐噪声');
subplot(2,2,4),imshow(J3),title('加乘性噪声')
- 1
- 2
- 3
- 4
- 5
- 6
- 7
- 8

10.图像差值放大
I=imread('rabbit.jpg');
J = imresize(I,10);
imshow(I),title('原图像')
figure,imshow(J),title('放大后的图像');
- 1
- 2
- 3
- 4
11.图像旋转
I=imread('girl.jpg');
J=imrotate(I,30,'bilinear');
subplot(1,2,1);imshow(I);title('原图像')
subplot(1,2,2);imshow(J);title('旋转后的图像');
- 1
- 2
- 3
- 4

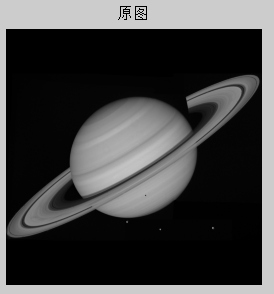
12.傅里叶变换
load imdemos saturn2
imshow(saturn2);title('原图');
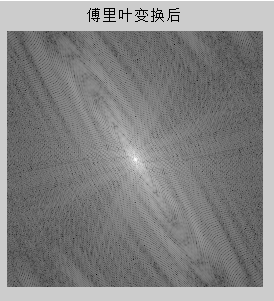
B = fftshift(fft2(saturn2));
figure;
imshow(log(abs(B)),[]);title('傅里叶变换后');
- 1
- 2
- 3
- 4
- 5


声明:本文内容由网友自发贡献,不代表【wpsshop博客】立场,版权归原作者所有,本站不承担相应法律责任。如您发现有侵权的内容,请联系我们。转载请注明出处:https://www.wpsshop.cn/w/笔触狂放9/article/detail/362964
推荐阅读
相关标签


