当前位置:   article > 正文

全球翻译公司25强排行榜 _commonsenseadvisory数据

commonsenseadvisory数据

出处:Common Sense Advisory    作者:Renato S. Beninatto, Donald A. DePalma  【编辑录入:giltworld

2007年全球翻译公司25强排行榜


2005年开始,Common Sense Advisory公司每年发布一次全球20强语言服务提供商(LSPs)的排名。由于过去一年中翻译、本地化和国际化市场的稳定增长,我们将今年的排行榜从20家增加到25家。


首先是数字:2007年市场增长快于往年


根据我们搜集到的营收数据以及通过和各种类型、不同规模语言服务提供商的谈话,2007年是收获颇丰的一年。07年榜上有名的全球20强语言服务提供商平均年度同比增长率高达26.68%。我们将2007年的估算从100亿美元调整到121亿美元,并相应地调整我们对今后五年的的预测(见表1 根据过去五年的趋势线,我们预测市场将会在2012年达到240亿美元。这样的增量相当于未来五年内每年14.6%的复合年增长率。

区域

市场份额

2008

2009

2010

2011

2012

欧洲

43%

6,145

7,202

8,306

9,336

10,350

美国

40%

5,770

6,762

7,799

8,767

9,718

亚洲

12%

1,648

1,932

2,228

2,504

2,776

其它地区

5%

686

804

928

1,043

1,156

总和


14,250

16,700

19,260

21,650

24,000

1 2008-2012年美国语言服务行业营收预测 (百万美元)
数据来源: Common Sense Advisory, Inc.

部分营收增长——准确说是4%——可归结于外汇原因。然而,主要的推动力是国际贸易和关系有利经济环境下销售额的增加。

这些简单的行和列掩盖了市场中一个标志性的改变。目前欧洲的翻译营收超过了美国。史无前例地,由15国组成的欧元区GDP总和超过了美国。整个欧盟的宽带渗透率超过了美国。翻译行业也搭上了这趟顺风车。语言服务提供商正得益于一个更加全球化的经济环境,尽管美国显示有经济衰退的迹象,这些公司仍在成长。


我们如何给公司排名


一如既往地,Common Sense Advisory公司推出的“全球表现杰出翻译公司排行榜”不仅仅包含翻译公司,而是包括公司或大公司的翻译部门,只要它们的大部分营收来自语言服务,而不论其从事的业务是笔译还是口译,业务形式是纸面的还是网络的,是现场翻译,还是通过录像带,或是嵌在软件内部,无论这些公司是在捷克共和国的布鲁诺市,在美国的得梅因市,还是在中国的深圳。

由于在语言服务的竞赛场上上市公司少之又少,因此打造这样一份排行榜比起汽车或电信行业来说要多些周折和功夫。事情就是这样进行的。

  • 上市公司。所有上市的翻译公司都出现在我们的榜单中,占到了我们最终排名的36%。对于这些公司中的大多数,我们都能够享受到查阅年报和正式文档的便利。然而,其中也不乏一些大公司的专门业务部门,这些公司不向外公布部门相关数据。对于那些主营业务非语言服务但拥有提供此类服务的业务部门的公司,我们只考虑该业务部门的收入。虽然拿到这些数据绝非易事。
  • 私人公司。我们大部分的时候都花费在对这些公司的调查上,因为我们调查了100多家的候选公司以推出我们的25强排名。我们打电话给这些公司的执行官们,探询他们在上一年中的收入,然后通过向他们询问财务陈述以证实这些数据。有些国家的私人公司没有义务发布任何数据,因此我们只能在他们允许的范围内查阅他们的财务数据。不过,我们一查完数据就会要求至少三个独立的信息源来证实这些数据的真实性,以此来验证他们的数字符合我们的嗅觉测试中的一组行业标准。


每过一年全球25强都变得更加全球化


2007年全球25强语言服务提供商排行榜中的公司分别来自17个国家: 美国(6家)、 英国(4家)、 捷克共和国(2家)、瑞士(2家),和中国、芬兰、法国、爱尔兰、意大利、日本、卢森堡、荷兰、挪威以及瑞典(各1家)。而LLCJ是一家合资企业,投资方分别来自比利时、德国、意大利和西班牙。

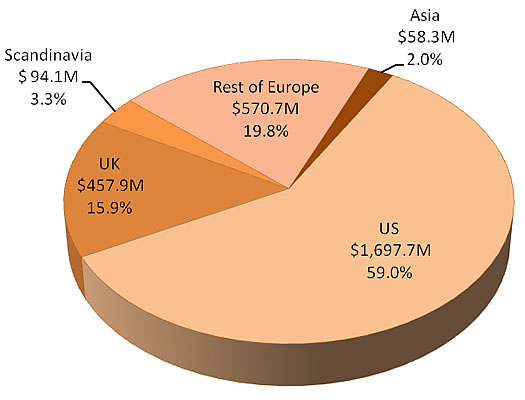
尽管美国公司和英国公司仍然占据了排行榜上的多数席位,但上榜的斯堪的纳维亚国家(芬兰、挪威、瑞典)公司增加了三倍,另外还有一家名为LanguageWire的丹麦公司虽未进入25强,但是排名也靠前。同时,亚洲第二大的语言服务提供商——中国的hiSoft(海辉集团)同亚洲最大的语言服务提供商——日本的Honyaku Center(翻译中心)公司一同跻身全球25强。

Fig01

图表1 美国和英国公司的营收总和仍旧占据了排行榜的大片河山(按美元计算)
数据来源 Common Sense Advisory公司

由于25强中很多公司报告的营收是以美元以外的货币呈现的,将它们转换为统一的单位——美元——变得比过去更加重要。对于美国境外的非美资公司,我们使用当地本财政年度365天的平均汇率计算营收。因此,排名第十位的RWS集团在2007930日结束的财政年度的平均汇率是每1英镑兑换1.9692美元。按日历年报告财务结果的SDL公司,得益于2007年收支平衡表受英镑对美元汇率上升到2.0018的影响,位列第三。


六家位于顶级公司和中层公司之间语言服务提供商引人注目


正如我们在20079月的Global Watchtower中指出的(见表2),市场分为明显的几个层级。如果把SDL的技术营收从总收入中减掉,就可以将其归类于一组高速增长的年营收在1亿到2亿美元之间的公司,它们分别是:SDL公司, Language Line公司, STAR公司, TransPerfect公司, euroscript公司和SDI公司。

商业出版社也开始关注这一产业。去年,《Inc.》杂志开始关注语言产业,将Eriksen Translations公司(2,552)Iverson Language Associates 公司(2,589)New Global Translations公司 (2,023)The Language Works公司(3,478),和Welocalize公司 (859)标记为美国5000家增长最快的私人企业。各家公司都列作“商务服务”提供商。

排名

公司

总部所在国

营业收入

(百万美元)

员工人数

办事处数量

公司性质

1

L-3 Communications Linguist Operations 技术支持部

美国

753.00

8,127

8

上市公司

2

Lionbridge Technologies

美国

452.00

4,600

45

上市公司

3

SDL International

英国

235.01

1,751

39

上市公司

4

Language Line Holdings

美国

183.20

2,378

7

私人公司

5

STAR Group

CH

161.75

900

42

私人公司

6

TransPerfect/Translations.com

美国

156.00

780

51

私人公司

7

euroscript International

卢森堡

120.93

1,235

32

私人公司

8

SDI Media Group

美国

119.80

591

25

私人公司

9

Xerox Global Services

英国

98.90

500

9

上市公司

10

RWS Group

英国

90.98

379

10

上市公司

11

CLS Communication

瑞士

49.22

343

14

私人公司

12

Logos Group

意大利

46.50

150

17

私人公司

13

Semantix

瑞典

43.73

150

10

私人公司

14

Manpower Business Solutions

荷兰

38.84

150

7

上市公司

15

Moravia Worldwide

捷克

38.20

406

12

私人公司

16

LCJ EEIJ

比利时/德国
/
西班牙/意大利

38.04

282

15

私人公司

17

Honyaku Centre

日本

36.30

174

4

上市公司

18

Welocalize

美国

33.70

295

8

私人公司

19

thebigword Group

英国

33.03

195

7

私人公司

20

Skrivanek Group

捷克

32.40

395

53

私人公司

21

AAC Global Group

芬兰

31.66

289

11

上市公司

22

Hewlett-Packard ACG

法国

23.00

121

9

上市公司

23

hiSoft Product Engineering Services/ 国际化与本地化业务部

中国

22.00

3,100

15

私人公司

24

VistaTEC

爱尔兰

21.79

100

5

私人公司

25

Amesto Translations Holding

挪威

18.75

85

5

私人公司

2 2007语言服务提供商全球25
资料来源:各家公司及Common Sense Advisory, Inc.


语言服务市场仍旧分散


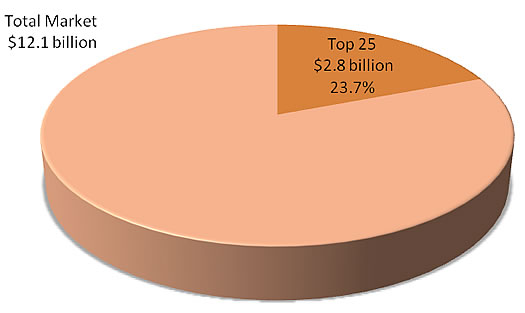
在以前的排行榜上,我们注意到全球20(现在25)强的语言服务提供商整体收入不高。这一情况没有改变,尽管它们占到的行业份额比去年提升了几个百分点(见图表2)。此外,我们很早以前就决定将所有的语言服务类别——笔译、口译、本地化、国际化、技术支持、工程甚至语言学习——合并为一个单一的、可测量的类别。否则,我们就得面对各种各样的小规模的、甚至高度切分的分割市场。

Fig02

图表2 2007年全球25强收入总和占全球市场百分比 (美元

数据来源 Common Sense Advisory, Inc.

最后,为判断市场是支离破碎得更严重了,还是合并得太过了,我们使用了Herfindahl-Hirschman指数(HHI) 来测量市场的集中程度和竞争强度。HHI指数计算市场份额的加权平均值(用每家公司市场份额的平方和来表示)。得分范围从010,000。分数低表明有大量的小规模公司存在,分数很高则表明有单一的、垄断企业存在。25强的HHI指数是66.34。这意味着即使行业内最大的10家公司合并成一家市值20亿美元的公司,也不太可能受到美国反托拉斯政府的威胁。


部分公司增长更迅速


收购行动加速了euroscriptSDL这类公司的增长。尽管如此,多数公司的报告中提到了由于语言服务需求提升而带给组织重要的成长。去年Moravia Worldwide公司曾告戒我们当微软历时长久的Vista项目结束时,本地化公司收入会减少,但是微软之外的业务却在以高于行业平均水平的速度增加。

排名

公司收入增长从2006年到2007

2007收入增加

(对比2006年)

1

euroscript International

92.5%

2

thebigword Group

57.6%

3

Xerox Global Services

45.4%

4

Semantix

40.0%

5

TransPerfect/Translations.com

38.3%

6

Skrivanek Group

37.3%

7

SDL International

34.7%

8

SDI Media Group

26.1%

9

RWS Group

23.9%

10

L-3 Communications Linguist Operations and Technical Support Division

21.1%

11

CLS Communication

20.9%

12

Welocalize

19.6%

13

LCJ EEIG

18.6%

14

Language Line Holdings

12.2%

15

Honyaku Centre

11.5%

16

Lionbridge Technologies

7.9%

17

Logos Group

7.3%

18

Hewlett-Packard ACG

4.5%

19

Moravia Worldwide

(12.2%)

20

Merrill Brink International

缺少数据

3 2006-2007公司收入增长(减少)
数据来源: Common Sense Advisory公司


规模最大的语言服务提供商 人均创收最少


人均创收是测量某一公司管理员工效率高低的一项指标。一般说来,人均创收上升是一个积极的迹象,暗示公司正在想方设法从单个员工身上挤压出更多的销售额。当我们把全球25强语言服务提供商的雇员数和人均创收做成交叉表以后,发现员工最多的公司三家公司(即L-3公司、Lionbridge公司和hiSoft公司)是25强中效率最低的公司。这三家公司在人均生产率一项上排名靠后,分别位列第22、第19和第25见表4)。

通过测量人均创收,我们注意到所有的25强公司效率都在提升。在我们的2006排名中,20强的平均人均创收是102,648.88美元。2007年,这一数字达到了162,914.48美元,同比进步了58.71%

按人均创收排名

按员工数排名

公司

员工数

人均创收(美元)

1

20

Logos Group

   150

310,000.00

2

21

Semantix

   150

291,558.33

3

22

Manpower Business Solutions

   150

258,931.63

4

13

RWS Group

   379

240,044.96

5

25

Amesto Translations Holding

85

220,560.36

6

24

VistaTEC

   100

217,947.66

7

19

Honyaku Centre

   174

208,640.80

8

9

SDI Media Group

   591

202,707.28

9

8

TransPerfect/Translations.com

   780

200,000.00

10

10

Xerox Global Services

   500

197,800.00

11

23

Hewlett-Packard ACG

   121

190,082.64

12

7

STAR Group

   900

179,719.24

13

18

thebigword Group

   195

169,383.92

14

14

CLS Communication

   343

143,499.01

15

17

LCJ EEIG

   282

134,886.65

16

5

SDL International

 1,751

134,216.16

17

15

Welocalize

   295

114,237.29

18

16

AAC Global Group

   289

109,564.34

19

2

Lionbridge

 4,600

  98,260.87

20

6

euroscript International

 1,235

  97,916.34

21

11

Moravia Worldwide

   406

  94,088.67

22

1

L-3 Communications

 8,127

  92,654.12

23

12

Skrivanek Group

   395

  82,025.32

24

4

Language Line Holdings

 2,378

  77,039.53

25

3

hiSoft

 3,100

   7,096.77

平均值

1,099

162,914.48

4 全球25强按人均创收排名
数据来源 Common Sense Advisory公司


语言服务行业的增长动力和机遇


前方等待语言服务提供商的是什么?Common Sense Advisory公司认为随着各公司在全球不断扩张,以及各国政府都在努力满足国内和国外多样化人口的不同需求,翻译需求量会上升。

  • 美元疲软推动美国出口 一些顶级的美国品牌——不管哪个行业——开始利用美元贬值来保护他们的利润不会出现暴跌。美元汇率全线下滑,美国产品在海外看起来更便宜了,而当销售额转换回美元的时候,回报是十分可观的。
  • 多元文化吸引公共资金和营销资金。地球上各个社会变得越来越不同源。有了因特网和卫星电视,人们可以在一个国家生活和工作,使用当地的服务和基础设施,但是永远不需要使用当地语言。在日本的巴西人、在德国的土耳其人、在大不列颠群岛的波兰人、在瑞典的阿拉伯人和在美国的西语裔人口都是如此。这种趋势推动了政府部门的语言服务需求,并为多文化的零售业务提供了大量机会(见连接美国的E-拉美人:再次”2007年五月)
  • 美国经济受挫改写翻译预算。世界上的发展中国家不再像过去那样需要依靠美国和其它的发达国家来实现自身发展。发展中国家的消费者支出增长速度是发达国家的近三倍。现实资本开支正在以两位数的速度提升,而在富裕国家年增长率只有1%多一点。同时,新兴经济体之间的贸易增长速度也超过了它们同富裕国家之间的贸易增速。不以英语作为中介语的贸易促进了翻译需求的增长。
  • 汇率波动让语言服务提供商趁机套利。精明的买家正在利用不同市场的价格差来降低成本。例如,欧洲的语言服务提供商在欧洲市场出售服务的同时也从美国购买翻译服务,以提升毛利。出人意料的是译员所处的地理位置不再是一个关键的区分项。了解超导体陶瓷、家住秘鲁的瑞典语译员比家住瑞典的普通译员价值更高,但价格更低。


Ranking of Top 25 Translation Companies

Since 2005, Common Sense Advisory has published an annual list of the 20 largest language service providers (LSPs). Solid growth in the translation, localization, and internationalization space led us to expand our list this year to the Top 25.


 But First, the Numbers: The Market Grew Faster Than in Previous Years
 

Based on the revenue data we collected and in conversations with LSPs of every shape and size, 2007 was a banner year. The average year-over-year growth rate of companies in our 2007 Top 20 list was 26.68 percent. We revised our 2007 estimate from US$10 billion to US$12.1 billion and adjusted our projections accordingly (see Table 1). Based on the trend-line over the last five years, we predict that the market will reach US$24 billion by 2012. That growth equates to a compound annual growth rate (CAGR) of 14.6 percent over the coming quinquennium.

RegionMarket
Share
2008
US$ M
2009
US$ M
2010
US$ M
2011
US$ M
2012
US$ M

Europe

43%

6,145

7,202

8,306

9,336

10,350

U.S.

40%

5,770

6,762

7,799

8,767

9,718

Asia

12%

1,648

1,932

2,228

2,504

2,776

ROW

5%

686

804

928

1,043

1,156

Totals


14,250

16,700

19,260

21,650

24,000

Table 1: Projected Language Services Revenues for 2008-2012 in U.S. Millions of Dollars
Source: Common Sense Advisory, Inc.

We can attribute some of the revenue growth – four percent, to be exact – to foreign exchange issues. However, the main driver for growth was increased sales in an economic environment favorable to international trade and relations.

These simple rows and columns mask a landmark change in the market. Europe now represents more translation revenue than the United States. The 15 euro-zone countries surpassed the U.S. in GDP for the first time. The European Union as a whole topped the United States in terms of broadband penetration. The translation industry went along for the ride. LSPs are reaping the benefits of a more global economy and are growing despite indications of a recession in the United States.


 How We Ranked the Companies
 

As always, Common Sense Advisory’s list of the top-performing translation companies goes beyond translation to include companies or divisions of companies that make most of their revenue by providing language services, be it in written or verbal form, on paper, over the web, in person, via video, inside software applications, in Brno, Des Moines, or Shenzhen.

Because there are so few publicly traded companies in the language arena, this list always involves a lot more legwork than producing a similar register for the automotive or telecommunications industries. So it goes.

  • Public companies. All the public companies show up on our list, accounting for 36 percent of our final tally. For most of these firms, we have the luxury of reviewing annual reports and official filings. However, some of these are large corporations with specialized business units for which they do not break out numbers. For these companies whose main activity is not language services, but have business units or divisions that provide such services, we considered only that unit’s revenue. Getting these numbers can be a challenge.
  • Privately-held companies. These firms consume most of our time, since we approach 100-plus candidate companies to come up with our list of 25. We call their executives to find out what they earned in the preceding year, probe for the magic number, and then ask them for financial statements to confirm their data. Private firms in some countries are not obligated to release any data, so we can only check their financials to the extent that they allow us. Once we’ve done that, we confirm the information with at least three independent sources and verify their numbers against a set of industry metrics in our “smell test.”
 
  
 The Top 25 List Becomes More Global with Each Passing Year
 

Our list for 2007 includes LSPs from 17 countries: the U.S. (6), U.K. (4), Czech Republic (2), Switzerland (2), and China, Finland, France, Ireland, Italy, Japan, Luxembourg, Netherlands, Norway, and Sweden (one each). LLCJ is a joint venture of companies from four countries (Belgium, Germany, Italy, and Spain).

While American and British companies still dominate the rankings, Scandinavia tripled its contribution of LSPs to the list with companies from Finland, Norway, and Sweden – and a Danish company, LanguageWire, also almost made it to the Top 25. Meanwhile, a second Asian LSP, hiSoft, joins Honyaku in the top echelon.

Fig01
Figure 1: U.S. and U.K. Companies Still Dominate the Top 25 List in Total Revenues Earned
in U.S. Dollars
Source: Common Sense Advisory, Inc.

With so many of the Top 25 reporting revenue in other currencies, our conversion into a baseline unit – the U.S. dollar – becomes even more important than in the past. For non-U.S. companies outside the United States, we divide their revenue in local currency by average exchange rate for the 365 days of their fiscal year. Thus, the average exchange rate for tenth-ranked RWS Group was US$1.9692 per pound sterling (GBP) for the fiscal year ended on 30 September 2007. Third-ranked SDL, reporting its results on a calendar year, benefits from the run-up of the pound against the dollar for the balance of 2007, with the dollar quoted at US$2.0018.


 Six LSPs Open Up Some Daylight between Top- and Mid-Tier Firms
 

The market is organized into several visible tiers, as we pointed out in the Global Watchtower in September 2007 (see Table 2). If we exclude SDL’s technology revenue from its total, it joins a cluster of high-growth rivals in the range of US$100-200 million: SDL, Language Line, STAR, TransPerfect, euroscript, and SDI.

The business press is beginning to pay attention to this sector. Last year Inc. magazine took notice of the language sector, flagging Eriksen Translations (#2,552), Iverson Language Associates (#2,589), New Global Translations (#2,023), The Language Works (#3,478), and Welocalize (#859) among the 5,000 fastest-growing private companies in the U.S., all listed as providers of “Business Services.”

RankCompanyHQ CountryRevenue in US$MEmployeesOfficesStatus

1

L-3 Communications Linguist Operations and Technical Support Division

US

753.00

8,127

8

Public

2

Lionbridge Technologies

US

452.00

4,600

45

Public

3

SDL International

UK

235.01

1,751

39

Public

4

Language Line Holdings

US

183.20

2,378

7

Private

5

STAR Group

CH

161.75

900

42

Private

6

TransPerfect/Translations.com

US

156.00

780

51

Private

7

euroscript International

LU

120.93

1,235

32

Private

8

SDI Media Group

US

119.80

591

25

Private

9

Xerox Global Services

UK

98.90

500

9

Public

10

RWS Group

UK

90.98

379

10

Public

11

CLS Communication

CH

49.22

343

14

Private

12

Logos Group

IT

46.50

150

17

Private

13

Semantix

SE

43.73

150

10

Private

14

Manpower Business Solutions

NL

38.84

150

7

Public

15

Moravia Worldwide

CZ

38.20

406

12

Private

16

LCJ EEIJ

BE/DE
/ES/IT

38.04

282

15

Private

17

Honyaku Centre

JP

36.30

174

4

Public

18

Welocalize

US

33.70

295

8

Private

19

thebigword Group

UK

33.03

195

7

Private

20

Skrivanek Group

CZ

32.40

395

53

Private

21

AAC Global Group

FI

31.66

289

11

Public

22

Hewlett-Packard ACG

FR

23.00

121

9

Public

23

hiSoft Product Engineering Services/ Globalization and Localization BU

CN

22.00

3,100

15

Private

24

VistaTEC

IE

21.79

100

5

Private

25

Amesto Translations Holding

NO

18.75

85

5

Private

Table 2: Top 25 Language Service Providers Worldwide for 2007
Source: Cited Companies and Common Sense Advisory, Inc.


 The Market in Language Services Remains Fragmented
 

In previous lists, we've noted how little of the overall language revenue is earned by the Top 20 (now 25) language service providers. That hasn’t changed, although they cranked the percentage up a few points over last year (see Figure 2).  Beyond that reality, we decided long ago to conflate all language service categories – translation, localization, interpretation, internationalization, supporting technologies, engineering, and even language learning – into a single measurable category. Otherwise, we would have been writing about a variety of very small, even more highly Balkanized segments.

Fig02
Figure 2: Top 25 Aggregate Revenue for 2007 as a Percentage of Total Market Size
in U.S. Dollars
Source: Common Sense Advisory, Inc.

Finally, to determine whether the fragmentation is getting worse or consolidation increasing too much, we apply the Herfindahl-Hirschman Index (HHI) to gauge industry concentration and competition in the marketplace. The HHI calculates a weighted average market share (which is represented by the sum of the squares of the market shares of each individual firm). The scores range from 0 to 10,000. Low numbers indicate a very large amount of very small firms, while a large number correlates to a single, monopolistic producer. The HHI for the Top 25 companies is 66.34. This means that even if the 10 biggest companies in the industry merged to form a US$2 billion company, it is unlikely that it would be challenged by anti-trust authorities in the United States.


 Some Companies Are Growing Faster
 

Acquisitions fueled the growth of companies like euroscript and SDL. However, most companies report significant organic growth from the increased demand for their language services. Moravia had warned us last year that when the Microsoft long-march-to-Vista software program ended, it would have a drop in revenues, but that its non-Microsoft business was growing above industry averages.

RankCompanyRevenue Growth from 2006 to 2007

1

euroscript International

92.5%

2

thebigword Group

57.6%

3

Xerox Global Services

45.4%

4

Semantix

40.0%

5

TransPerfect/Translations.com

38.3%

6

Skrivanek Group

37.3%

7

SDL International

34.7%

8

SDI Media Group

26.1%

9

RWS Group

23.9%

10

L-3 Communications Linguist Operations and Technical Support Division

21.1%

11

CLS Communication

20.9%

12

Welocalize

19.6%

13

LCJ EEIG

18.6%

14

Language Line Holdings

12.2%

15

Honyaku Centre

11.5%

16

Lionbridge Technologies

7.9%

17

Logos Group

7.3%

18

Hewlett-Packard ACG

4.5%

19

Moravia Worldwide

(12.2%)

20

Merrill Brink International

Data not available

Table 3: Revenue Growth (Reduction) by Company from 2006 to 2007
Source: Common Sense Advisory, Inc.


 The Biggest LSPs Earn the Least Revenue Per Employee
 

Revenue per employee is a measure of how efficiently a particular company is using its employees. In general, rising revenue per employee is a positive sign that suggests the company is finding ways to squeeze more sales out of each of its workers. When we cross-tabbed the number of employees and revenue per employee at the Top 25, we saw that the companies with the most employees – L-3, Lionbridge, and hiSoft – are also the least efficient. These three firms trail in productivity per employee, holding the twenty-second, nineteenth, and twenty-fifth places, respectively (see Table 4).

Across the Top 25, we noticed an increase in efficiency as measured by revenue per employee. In our 2007 ranking, the average revenue per employee for the Top 20 companies was US$102,648.88. In 2007, that number reached US$162,914.48, for an improvement of 58.71 percent.

Ranking by Revenue per EmployeeRanking by Number of EmployeesCompanyNumber of EmployeesRevenue by Employee in USD

1

20

Logos Group

   150

310,000.00

2

21

Semantix

   150

291,558.33

3

22

Manpower Business Solutions

   150

258,931.63

4

13

RWS Group

   379

240,044.96

5

25

Amesto Translations Holding

85

220,560.36

6

24

VistaTEC

   100

217,947.66

7

19

Honyaku Centre

   174

208,640.80

8

9

SDI Media Group

   591

202,707.28

9

8

TransPerfect/Translations.com

   780

200,000.00

10

10

Xerox Global Services

   500

197,800.00

11

23

Hewlett-Packard ACG

   121

190,082.64

12

7

STAR Group

   900

179,719.24

13

18

thebigword Group

   195

169,383.92

14

14

CLS Communication

   343

143,499.01

15

17

LCJ EEIG

   282

134,886.65

16

5

SDL International

 1,751

134,216.16

17

15

Welocalize

   295

114,237.29

18

16

AAC Global Group

   289

109,564.34

19

2

Lionbridge

 4,600

  98,260.87

20

6

euroscript International

 1,235

  97,916.34

21

11

Moravia Worldwide

   406

  94,088.67

22

1

L-3 Communications

 8,127

  92,654.12

23

12

Skrivanek Group

   395

  82,025.32

24

4

Language Line Holdings

 2,378

  77,039.53

25

3

hiSoft

 3,100

   7,096.77

Average of Top 25 Companies

1,099

162,914.48

Table 4: Top 25 Companies Ranked by Revenue per Employee
Source: Common Sense Advisory, Inc.


 Drivers and Opportunities for Growth in the Language Services Industry
 

What’s ahead for providers of language services? Common Sense Advisory sees an increasing need as companies increase their global exposure and, along with governments, strive to meet the needs of diverse populations at home and abroad.

  • The ailing dollar pushes exports from the U.S.  Some of the biggest American brands – across all industries – have used the retrenchment of the dollar to shield themselves from slumping profit margins. Declines against world currencies make U.S. products look cheaper overseas, and translate into big returns when sales are converted back into dollars.
  • Multiculturalism attracts public funds and marketing dollars.  Societies across the globe are becoming more heterogenous. With the internet and satellite TV, a person can live and work in a country, use its services and infrastructure, and never need to speak the local language. This is the case of Brazilians in Japan, Turks in Germany, Poles in the British Isles, Arabs in Sweden, and Spanish-speakers in the U.S. This trend drives the need for language services in the public sector and big opportunities for multicultural retailing efforts (see “Reaching America’s e-Latinos: Otra Vez” May07).
  • Decoupling of the U.S. economy shifts translation budgets. The world's developing nations are no longer nearly as dependent as they used to be on the United States and other developed nations to keep themselves going. Consumer spending is rising almost three times as fast in developing nations as it is in rich nations. Real capital spending is rising by double digits there, while it's rising only a bit over one percent a year in rich nations. Meanwhile, emerging economies' trade with each other is rising faster than their trade with richer nations. Trade without the inter-language of English intensifies the demand for translations.
  • Exchange rate fluctuations enable language services arbitrage. Savvy buyers are taking advantage of the price differential between markets to reduce their costs. European LSPs are selling services in euros and buying translations in the United States to improve their margins. An unintended consequence is that the location of a translator is no longer a key differentiator. A Swedish translator with knowledge in superconductive ceramics living in Peru is more valuable but cheaper than a generic translator living in Sweden.

声明:本文内容由网友自发贡献,不代表【wpsshop博客】立场,版权归原作者所有,本站不承担相应法律责任。如您发现有侵权的内容,请联系我们。转载请注明出处:https://www.wpsshop.cn/w/繁依Fanyi0/article/detail/250926?site
推荐阅读
相关标签
  

闽ICP备14008679号