使用PCL库将KITTI数据集可视化_python pcl kitti数据可视化
赞
踩
PCL点云可视化
KITTI数据集浅析
KITTI数据集的数据采集平台装配有2个灰度摄像机,2个彩色摄像机,一个Velodyne 64线3D激光雷达,4个光学镜头,以及1个GPS导航系统。
本次重点讨论激光雷达数据部分
KITTI数据集简介
1.KITTI是目前国际上最大的自动驾驶场景下的计算机视觉算法评测数据集
2.KITTI包含市区、乡村和高速公路等场景采集的真实图像数据,每张图像中最多达15辆车和30个行人,还有各种程度的遮挡与截断。
3.对于3D物体检测,label细分为car, van, truck, pedestrian, pedestrian(sitting), cyclist, tram以及misc组成。
4. 激光雷达为1台Velodyne HDL-64E激光,扫描频率10Hz,64线,0.09°角度分辨率,2cm探测精度,每秒130万点数,探测距离120m
KITTI基本结构

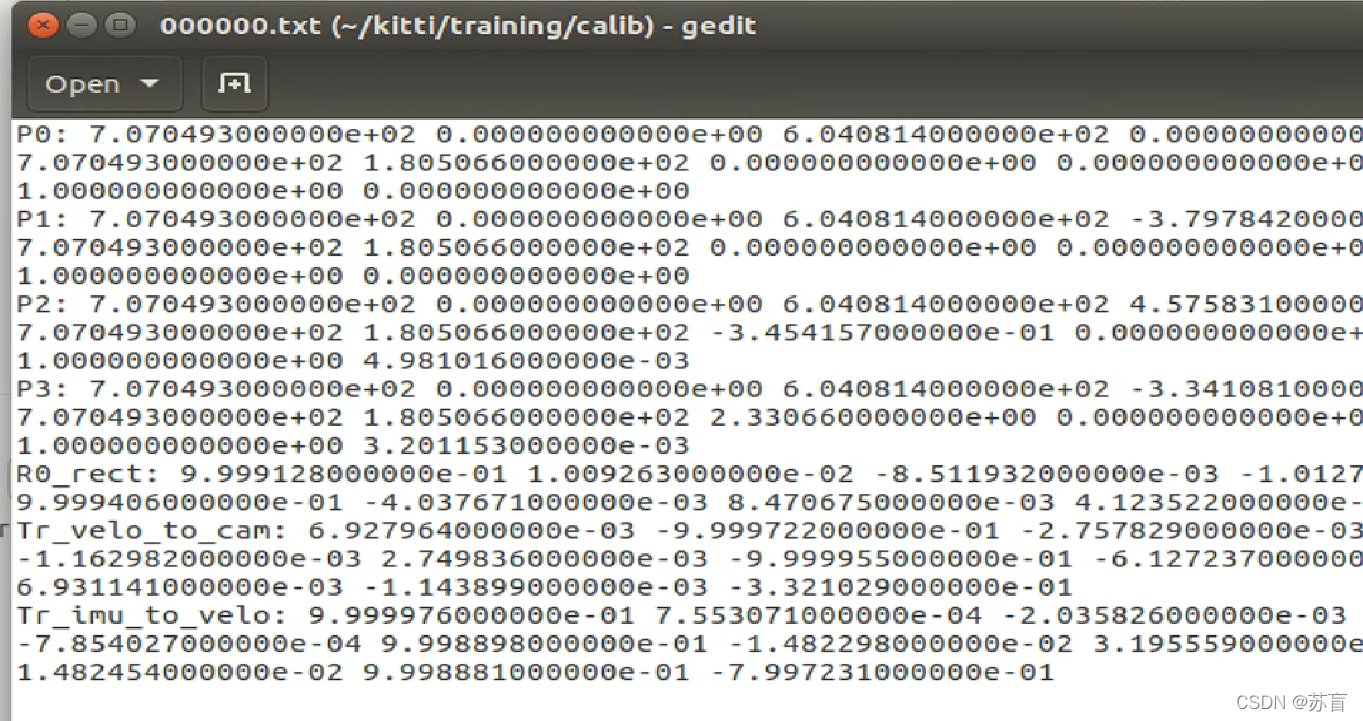
Calib: 000000~007480.txt 传感器标定数据
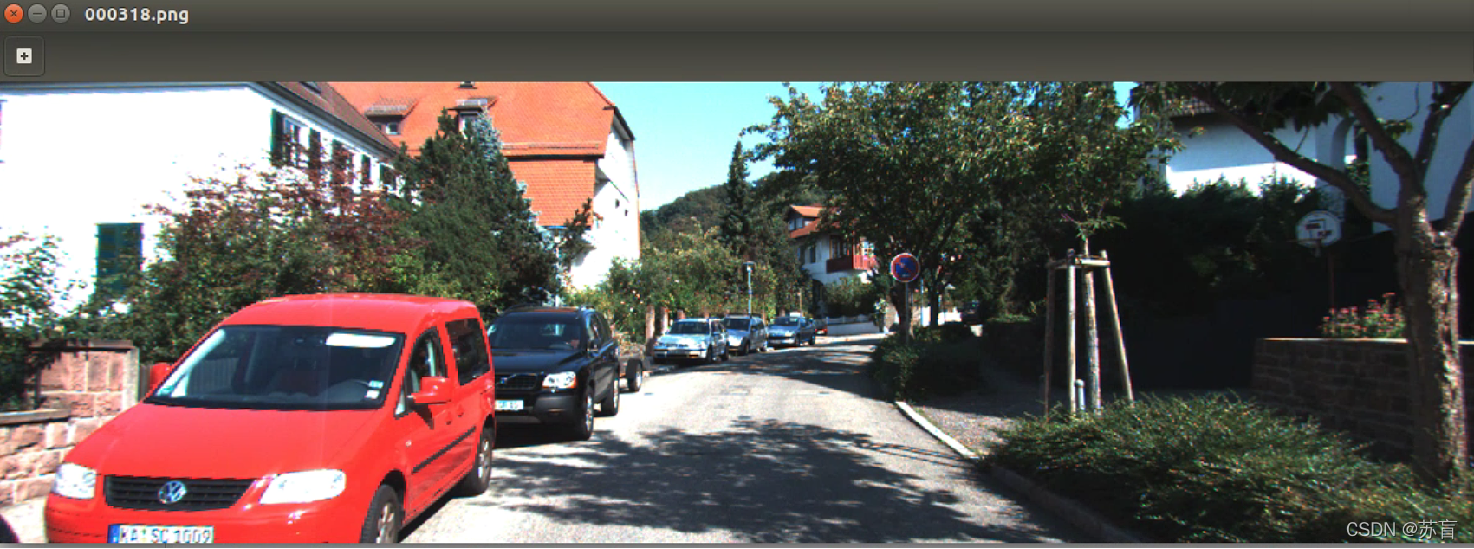
Image_2: 000000~007480.png 彩色相机图像
Label_2: 000000~007480.txt 标注数据集合
Velodyne: 000000~007480.bin 激光点云数据
Velodyne_reduced: 空
Calib


Velodyne
激光雷达点云数据采用浮点数二进制文件保存。保存激光雷达坐标系下,激光点( x , y , z ) 坐标和反射率r信息,每一帧平均12万个激光点。
读取KITTI数据集中velodyne的.bin文件
pcl::PointCloud<PointXYZI>::Ptr points (new pcl::PointCloud<PointXYZI>);
for (int i=0; input.good() && !input.eof(); i++)
{
	PointXYZI point;
	input.read((char *) &point.x, 3*sizeof(float));
	input.read((char *) &point.intensity, sizeof(float));
	points->push_back(point);
}
input.close();
- 1
- 2
- 3
- 4
- 5
- 6
- 7
- 8
- 9
写入.pcd文件
pcl::PCDWriter writer;
writer.write<PointXYZI> (outfile, *points, false);
PointCloud<PointXYZ>::Ptr cloud(new PointCloud<PointXYZ>);
- 1
- 2
- 3
用vscode打开.pcd文件,可以直观的看到每行都由x,y,z,r(反射强度,一般没用)组成

标签数据解析
先打开一个label看一下

一共15个字段

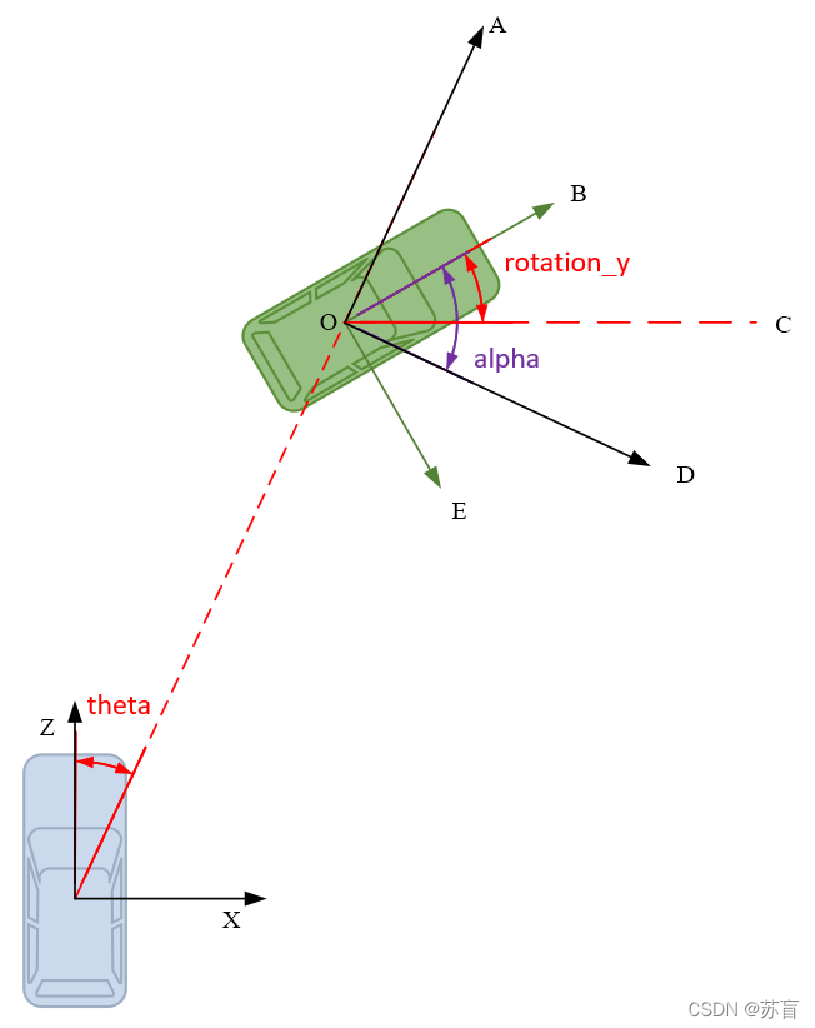
值得提一下的是alpha和rotation_y的区别和联系,rotation_y和alpha都是以逆时针方向为负。它们之间可以互相转换。

从示意图可以分析得到:alpha = rotation_y - theta
注意:直接对数据集转换,会有轻微的精度损失
点云数据可视化
本文主要使用PCL库中的PCLVisualizer类对点云数据进行可视化操作
创建点云对象
读取pcd文件,载入点云数据
PointCloud<PointXYZ>::Ptr cloud(new PointCloud<PointXYZ>);
if (io::loadPCDFile("test.pcd", *cloud) == -1)
	return -1;
- 1
- 2
- 3
创建视窗对象
给标题栏定义名称“3D viewer”。viewer的类型为boost::shared_ptr,只能共享指针,保证该指针在整个程序中全局使用,不引起内存错误
boost::shared_ptr<visualization::PCLVisualizer> viewer(new visualization::PCLVisualizer("3D viewer"));
- 1
设置窗口viewer的背景为全黑色
viewer->setBackgroundColor(0, 0, 0);
- 1
如果不想要单色的点云,可以按z轴方向深度渲染一下点云的色彩
pcl::visualization::PointCloudColorHandlerGenericField<pcl::PointXYZ> fildColor(cloud, "z");
- 1
添加点云到视窗
viewer->addPointCloud<PointXYZ>(cloud, fildColor, "sample cloud");
viewer->setPointCloudRenderingProperties(visualization::PCL_VISUALIZER_POINT_SIZE, 2, "sample cloud");
/*设置XYZ三个坐标轴的大小和长度,该值也可以缺省
查看复杂的点云图像会让用户没有方向感,为了让用户保持正确的方向判断,需要显示坐标轴。三个坐标轴X(R,红色)Y(G,绿色)Z(B,蓝色)分别用三种不同颜色的圆柱体代替
*/
- 1
- 2
- 3
- 4
- 5
将点云数据添加到视窗中,并为其定义一个唯一的字符串作为ID号,利用此ID号保证其他成员方法也能表示该点云。
*多次调用addPointCloud()可以实现多个点云的叠加
*还有updatePointCloud()方法实现点云的更新
相机参数的设置

这张图清楚地展示了相机坐标系和雷达坐标系的关系
• Camera: x = right, y = down, z = forward
• Velodyne: x = forward, y = left, z = up
• GPS/IMU: x = forward, y = left, z = up

而物理距离可以由上图获得
由此可以确定点云中相机的视角和方向
viewer->addCoordinateSystem(1.0);
/* 通过设置相机参数是用户从默认的角度和方向观察点 */
viewer->initCameraParameters();
viewer->setCameraPosition(0.27, 0, -0.08, 1, 0, 0, 0, 0, 1);
- 1
- 2
- 3
- 4
解释一下setCameraPostion中的几个变量
posX,posY,posZ: 观察点坐标
viewX,viewY,viewZ: 视角朝向
upX,upY,upZ: 向上方向
看下效果


还没有涉及可视化label,此处只是为了方便对照
可以看到,不用手动拖拽,设置好后,运行窗口默认和相机同一视角
保持窗口打开
通过while循环保持窗口一直处于打开状态,并且按照规定时间刷新窗口
while (!viewer->wasStopped())
{
	viewer->spinOnce(100);
	boost::this_thread::sleep(boost::posix_time::microseconds(1000));
}
- 1
- 2
- 3
- 4
- 5
3D标签数据可视化
在KITTI数据集的标签里,我们用到它标签数据里的x,y,z,length,height,width6个数据,来求解pcl绘制矩形所需要的6个角点坐标
先定义一个标签结构体
struct Kitti_Label
{
	//类别
	std::string cls;// 9 classes
	//截断程度 from 0(截断)-1(非截断)
	float truncated;
	//遮挡程度 0 完全可见 1 小部分遮挡 2 大部分遮挡 3 完全遮挡
	short occlusion;
	//物体的观察角度 范围[-pi,pi]
	float alpha;
	//物体的2维边界框,左上角和右下角的像素坐标
	float pt1[2];
	float pt2[2];
	//三维物体的尺寸,单位m
	float height;
	float width;
	float length;
	//三维物体的位置(相机坐标系下,单位m)
	float x;
	float y;
	float z;
	//三维物体的空间方向,在相机坐标系下,相对于y轴的旋转角,范围[-pi,pi]
	float rotation_y;
}
- 1
- 2
- 3
- 4
- 5
- 6
- 7
- 8
- 9
- 10
- 11
- 12
- 13
- 14
- 15
- 16
- 17
- 18
- 19
- 20
- 21
- 22
- 23
- 24
读取label,写入成员变量
ifstream txtfile("test.txt");
Kitti_Label test[100];
string s;

int num_tar = 0;
while (getline( txtfile, s))
{
	string sTmp[15];
	istringstream istr(s);
	int i = 0;
	while(!istr.eof())
	{
		istr >> sTmp[i];
		i++;
	}
	test[num_tar].cls = sTmp[0]
	test[num_tar].x = atof(sTmp[11].c_str());
	test[num_tar].y = atof(sTmp[12].c_str());
	test[num_tar].z = atof(sTmp[13].c_str());
	test[num_tar].height = atof(sTmp[8].c_str());
	test[num_tar].width = atof(sTmp[9].c_str());
	test[num_tar].length = atof(sTmp[10].c_str());

}
- 1
- 2
- 3
- 4
- 5
- 6
- 7
- 8
- 9
- 10
- 11
- 12
- 13
- 14
- 15
- 16
- 17
- 18
- 19
- 20
- 21
- 22
- 23
- 24
坐标转换
参照文章上面图片的坐标系,从相机三维坐标到激光雷达坐标,对应关系如下:
z->x
y->-z
x->-y
还有一点要注意的,点云标签的坐标定义是以底面中心为准
由此得到如下转换:
float x_min = test[num_tar].z - test[num_tar].length/2;
float y_min = -test[num_tar].x - test[num_tar].length/2;
float z_min = -test[num_tar].y;
float x_max = test[num_tar].z + test[num_tar].length/2;
float y_max = -test[num_tar].x + test[num_tar].length/2;
float z_max = -test[num_tar].y + test[num_tar].length;
- 1
- 2
- 3
- 4
- 5
- 6
矩形框绘制
viewer->addCube (x_min, x_max, y_min, y_max, z_min, z_max, 255, 0, 0, name, 0);
viewer->setShapeRenderingProperties(pcl::visualization::PCL_VISUALIZER_REPRESENTATION,pcl::visualization::PCL_VISUALIZER_REPRESENTATION_WIREFRAME, name);
- 1
- 2
参考的一些博客:
https://blog.csdn.net/zjguilai/article/details/90168564
https://blog.csdn.net/qq_37534947/article/details/106628308
参考的资料不胜枚举,本文如有使用您的资料,却遗漏引出链接,请与博主联系,谢谢!


