- 1鸿蒙应用开发 闹钟实现_鸿蒙开发实现倒计时
- 2yum安装python3_centos 安装python3详细指南
- 3CSS 详解grid布局(网格布局)与应用
- 4吴恩达机器学习-可选实验室:简单神经网络(Simple Neural Network)
- 5Android N Audio: Audio Track play_audio_port_type_t
- 6AI帮忙做论文笔记——高端Prompt技巧——chatGPT时代背景下文献阅读新范式_阅读论文的prompt
- 7平时多看看---前端中小厂一二线城市薪资水平报告_中厂初级前端月薪多少
- 8H3C-Cloud Lab实验-静态路由配置实验_h3c cloud lab
- 9php添加图片水印类,PHP图片水印类的封装
- 10ft232 mac usb串口驱动_【电路“芯”说】聊聊你知道的串口
Python机器学习建模的标准流程(特征工程+建模调参+模型评估+全流程可视化)_python 如何自己定义模型的工作流程,可视化每一步的流程
赞
踩
作者CSDN:进击的西西弗斯
本文链接:https://blog.csdn.net/qq_42216093/article/details/116994199
版权声明:本文为作者原创文章,转载需征得作者同意
如今机器学习炙手可热,而对于数据分析师或是从事数据相关的工作者而言,Python是一种最常用的机器学习实现方式。本文将从实践的角度出发,以经典的泰坦尼克号幸存者数据集为例,以sklearn为主要工具,全面细致地讲解Python机器学习建模的标准化流程。
1. 特征工程
特征工程,就是将原始数据处理转化为能够更好地表达问题本质的特征,使得将这些特征运用到机器学习模型中能提高对新数据的预测精度。
为什么在机器学习建模之前要先做特征工程?业内有句有名的话:“样本数据和特征质量决定了机器学习能达到的上限,而模型和算法只不过是不断逼近这个上限而已”。因此,特征工程是机器学习算法建模之前的重要准备工作。

1). 数据清洗
本文使用的数据取自Kaggle网站的泰坦尼克号幸存者数据集,如下图。样本数量共891个,算上类别标签列总共有12个维度,包括姓名、性别、年龄、登船港口、票价等特征属性,其中Survived列是结果类别列(0代表死亡,1代表幸存)。
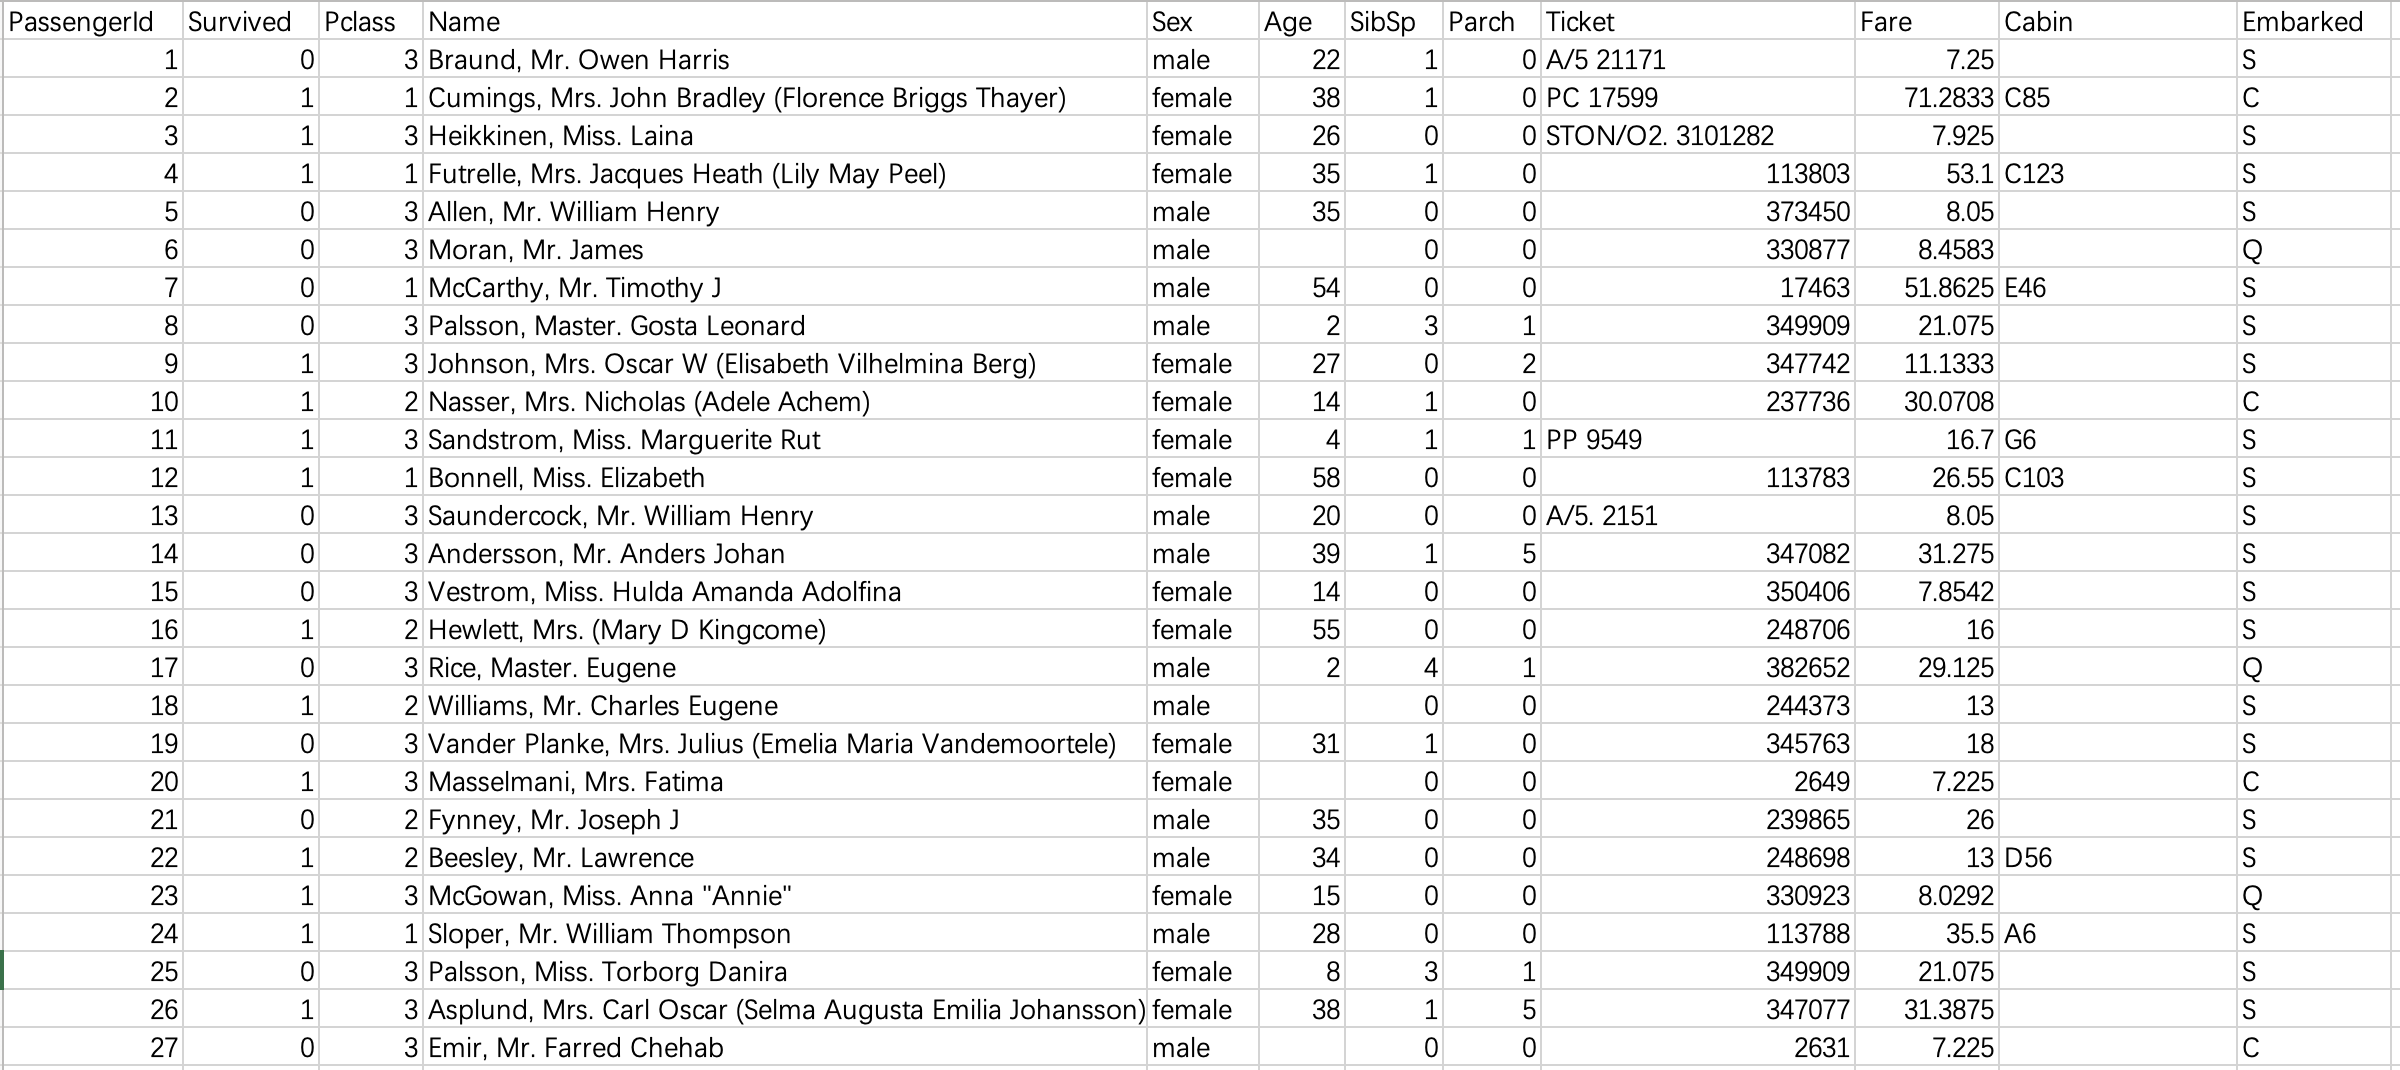
可以看出,原始数据未经清洗,噪音很大。我们接下来的工作主要集中在:
(1). 通过直观分析,先删除对于幸存没有影响的特征,包括:乘客编号、姓名、船票号。再删除船舱列,因为该列的缺失值太多。
(2). 将性别、登录港口这两列的字符值替换为数值型,因为后面要调用sklearn建模,它对于输入数据有格式要求。
(3). 对有缺失值的列进行处理,将缺失值替换为该列的众数。其中对于年龄列单独处理:直接删除有年龄缺失值的样本(行),因为年龄是个关键属性,我们不允太大误差。
(4). 对年龄特征重新构建:连续型变量离散化处理。但是这一点要结合具体要用到的算法,比如本文使用了随机森林算法,它可以处理连续型变量,故可以省略该步骤。
代码如下,附详细注释
# 先载入该项目要用到的所有库
import pandas as pd		# 数据分析必备
import numpy as np		# 数据分析必备
import matplotlib.pyplot as plt		# 可视化作图
from sklearn.feature_selection import SelectKBest,f_classif,chi2	# 特征分析与特征选择
from sklearn.model_selection import train_test_split, cross_val_score, learning_curve		# 训练集测试集划分、十折交叉验证、学习曲线
from sklearn.decomposition import PCA		# 主成分分析
from sklearn.preprocessing import scale		# 数据标准化
from sklearn.ensemble import RandomForestClassifier		# 随机森林分类器
from sklearn.metrics import roc_curve,auc,precision_recall_curve,average_precision_score	# ROC曲线、PR曲线


# 读取文件
df = pd.read_csv('Titanic.csv')

# 删除乘客编号、姓名、船票号这几列,因为主观判断它们对幸存与否没有影响;删除船舱列,因为缺失值太多
df = df.drop(['PassengerId','Name','Ticket','Cabin'], axis=1)

# 将性别、登录港口这两列的字符值替换为数值型,为了后面适配sklearn数据格式要求
df.loc[df['Sex'] == 'male','Sex'] = 1
df.loc[df['Sex'] == 'female','Sex'] = 0
df.loc[df['Embarked'] == 'C', 'Embarked'] = 0
df.loc[df['Embarked'] == 'S', 'Embarked'] = 1
df.loc[df['Embarked'] == 'Q', 'Embarked'] = 2

# 对有缺失值的列进行处理,将缺失值替换为该列的众数。其中对于年龄列单独处理:直接删除有年龄空值的样本(行),因为年龄是个关键属性,我们不允太大误差
df = df.dropna(axis=0, subset=['Age'])
df = df.reset_index(drop=True)
df['SibSp'] = df['SibSp'].fillna(df['SibSp'].mode()[0])     # 众数结果是Series类型,不同于上面均值,故索引
df['Embarked'] = df['Embarked'].fillna(df['Embarked'].mode()[0])

# # 对年龄特征重新构建:连续型变量离散化处理。本文的随机森林算法可以省略该步骤
# for i in range(df.shape[0]):
#     if df.loc[i, 'Age']<=10 and df.loc[i, 'Age']>=0:
#         df.loc[i, 'Age'] = 0
#     elif df.loc[i, 'Age']<=20 and df.loc[i, 'Age']>10:
#         df.loc[i, 'Age'] = 1
#     elif df.loc[i, 'Age']<=30 and df.loc[i, 'Age']>20:
#         df.loc[i, 'Age'] = 2
#     elif df.loc[i, 'Age']<=40 and df.loc[i, 'Age']>30:
#         df.loc[i, 'Age'] = 3
#     elif df.loc[i, 'Age']<=50 and df.loc[i, 'Age']>40:
#         df.loc[i, 'Age'] = 4
#     elif df.loc[i, 'Age']<=60 and df.loc[i, 'Age']>50:
#         df.loc[i, 'Age'] = 5
#     elif df.loc[i, 'Age']<=70 and df.loc[i, 'Age']>60:
#         df.loc[i, 'Age'] = 6
#     elif df.loc[i, 'Age']<=80 and df.loc[i, 'Age']>70:
#         df.loc[i, 'Age'] = 7

df.to_csv('cleaned.csv')
- 1
- 2
- 3
- 4
- 5
- 6
- 7
- 8
- 9
- 10
- 11
- 12
- 13
- 14
- 15
- 16
- 17
- 18
- 19
- 20
- 21
- 22
- 23
- 24
- 25
- 26
- 27
- 28
- 29
- 30
- 31
- 32
- 33
- 34
- 35
- 36
- 37
- 38
- 39
- 40
- 41
- 42
- 43
- 44
- 45
- 46
- 47
- 48
- 49
- 50
- 51
- 52
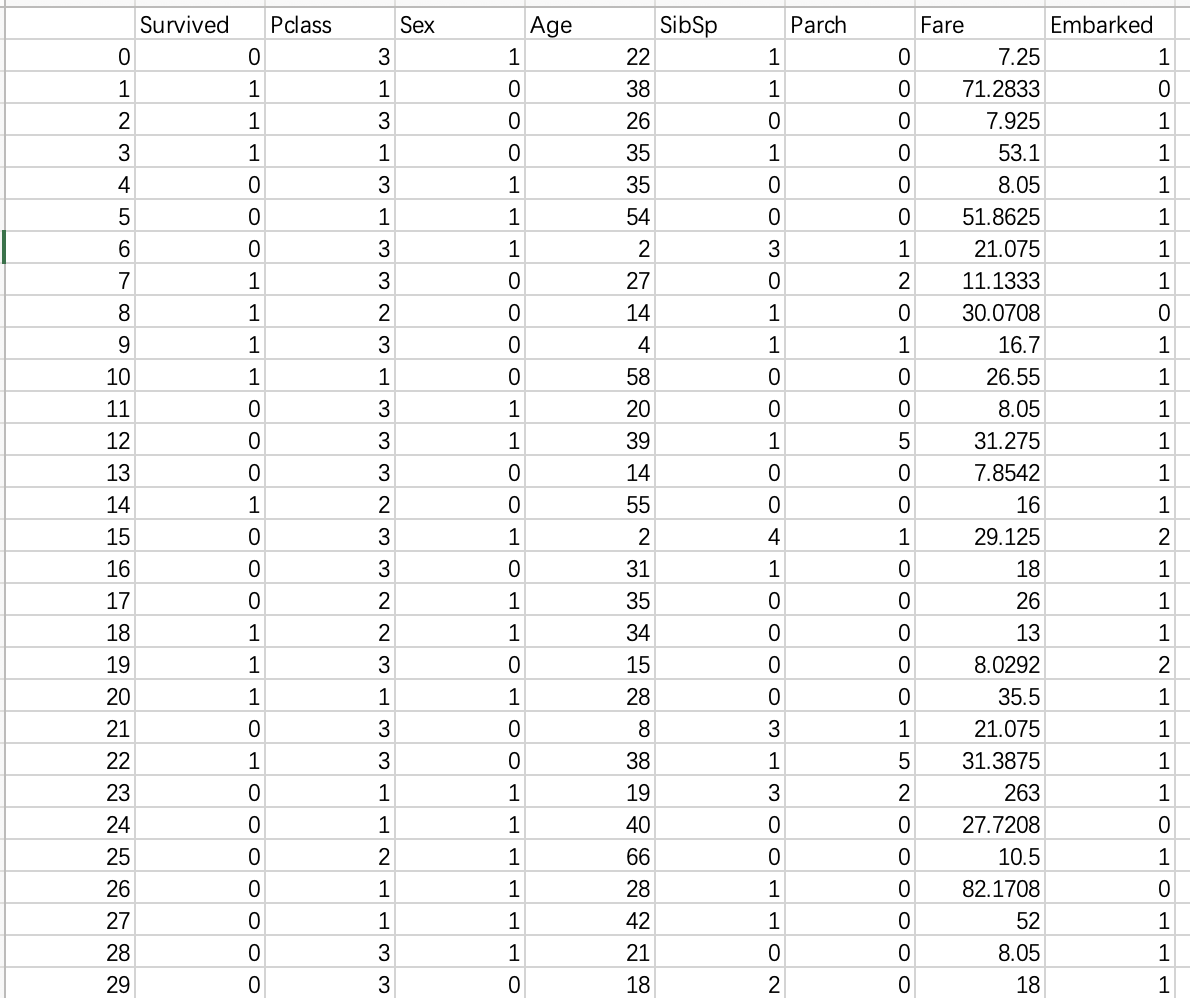
清洗后的数据如下:
2). 特征分析
特征分析就是评估每个特征的质量,也就是特征与因变量(类别标签)的相关性程度,常用的方法有方差分析、卡方统计等。这里我们调用sklearn.feature_selection.SelectKBest模块,构建特征选择模型,使用F值方差分析来分析各个特征,并最终将结果可视化为条形图。
代码如下(接上部分),附详细注释
x = df.drop(['Survived'], axis=1)		# 自变量集
y = df['Survived']		# 因变量
# 把y列转化成颜色列表,绘图使用
colors = list()
for i in y:
    if i == 0:
        colors.append('c')
    elif i == 1:
        colors.append('y')

# 构建特征选择模型,参数score_func:特征得分计算方式,这里使用F值方差分析;k:选取得分最高的前k个特征
skb = SelectKBest(score_func=f_classif,k='all')
# 使用数据集拟合模型
skb.fit(x,y)
# 每个特征的得分
F_scores = skb.scores_
# 前k个特征选择之后的新数据集
x_new = skb.transform(x)
features = x.columns
# 将每个特征精确到小数点后一位
for i in range(len(F_scores)):
    F_scores[i] = round(F_scores[i],1)
# 使用卡方统计重新构建特征选择模型并打分
skb = SelectKBest(score_func=chi2, k='all')
skb.fit(x, y)
Chi_scores = skb.scores_
for i in range(len(Chi_scores)):
    Chi_scores[i] = round(Chi_scores[i], 1)

# 将两个特征得分结果分别可视化为条形图
fig = plt.figure(dpi=200, figsize=(10,5))
ax1 = fig.add_subplot(121)
ax1.bar(features, F_scores, alpha=0.8, color='dodgerblue')
for i in zip(features, F_scores, F_scores):
    ax1.text(i[0],i[1],i[2], horizontalalignment = 'center')
ax1.set_title('F-scores of the features')
ax2 = fig.add_subplot(122)
ax2.bar(features, Chi_scores, alpha=0.8, color='dodgerblue')
for i in zip(features, Chi_scores, Chi_scores):
    ax2.text(i[0],i[1],i[2], horizontalalignment = 'center')
ax2.set_title('Chi-scores of the features')
plt.savefig('Features analysis.jpg')
plt.show()
- 1
- 2
- 3
- 4
- 5
- 6
- 7
- 8
- 9
- 10
- 11
- 12
- 13
- 14
- 15
- 16
- 17
- 18
- 19
- 20
- 21
- 22
- 23
- 24
- 25
- 26
- 27
- 28
- 29
- 30
- 31
- 32
- 33
- 34
- 35
- 36
- 37
- 38
- 39
- 40
- 41
- 42
- 43
结果:
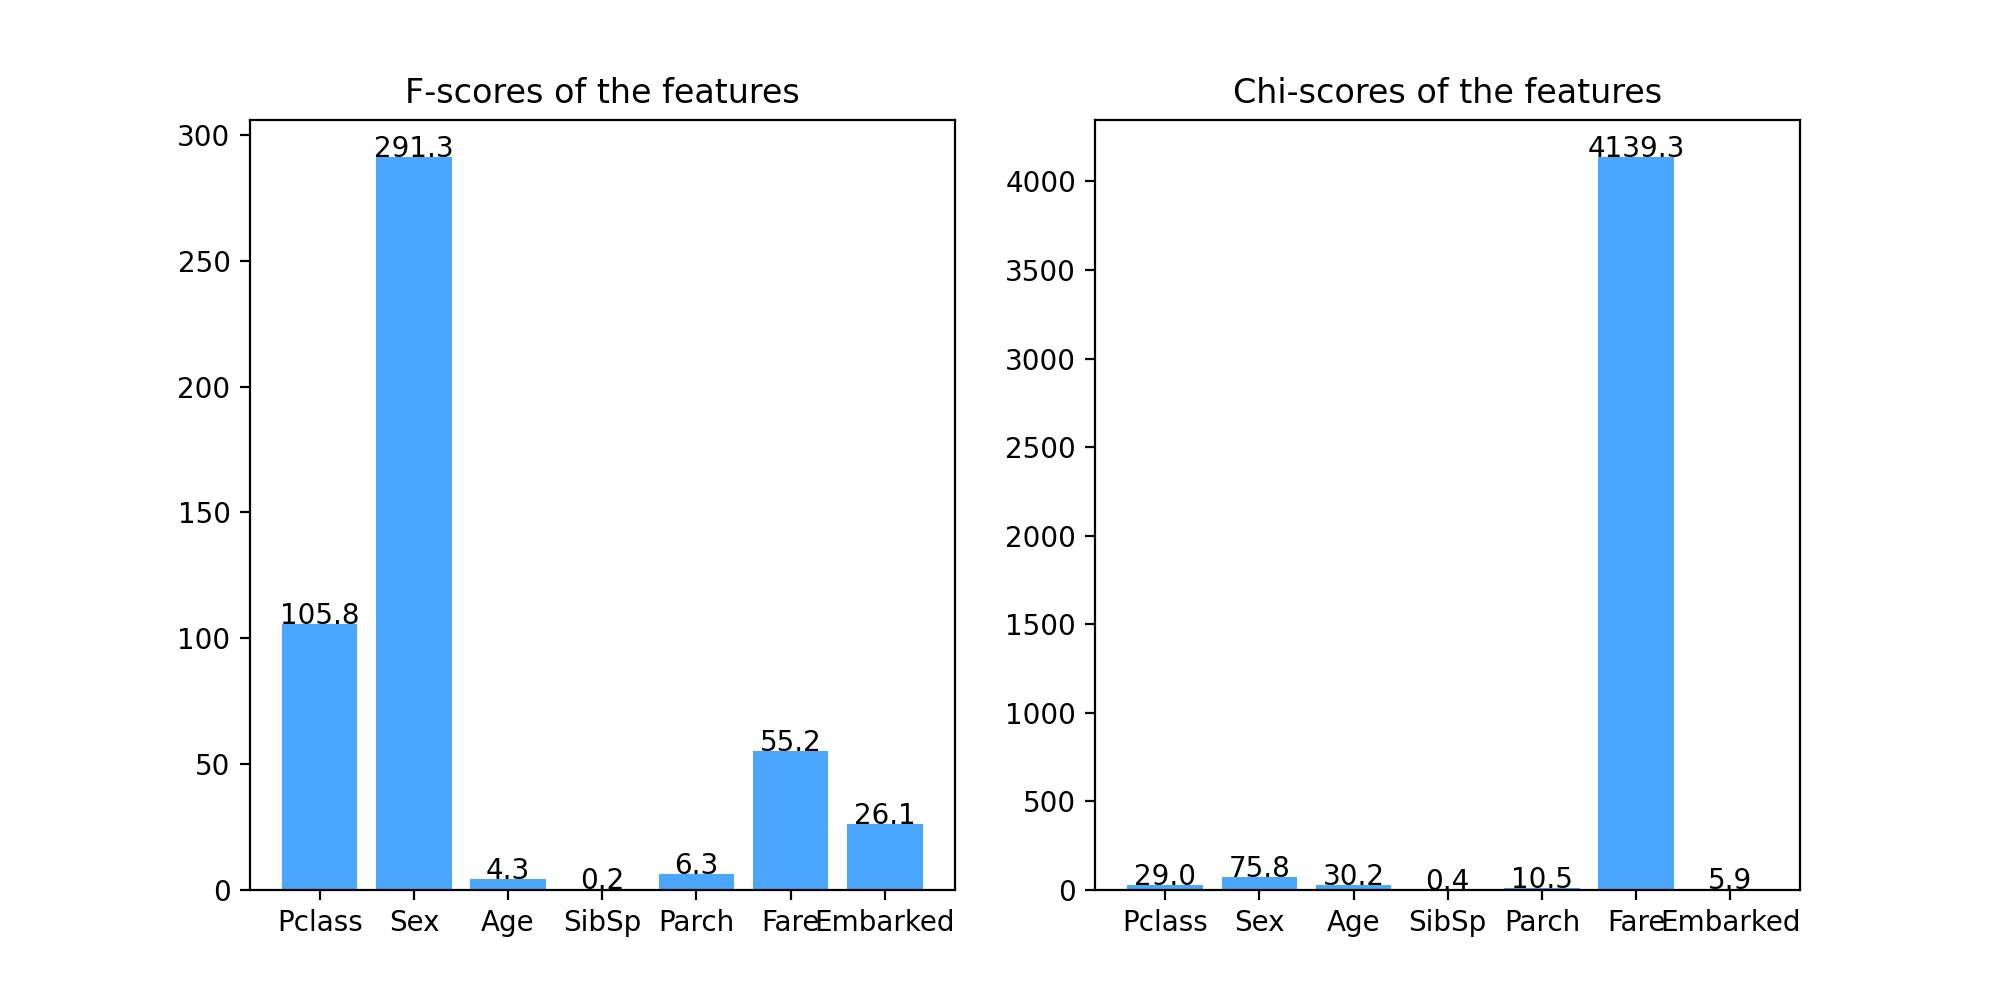
从方差分析(左图)和卡方统计分析(右图)结果可以看出,特征SibSp的得分非常低,接近1,也就是说,该特征和分类预测结果的相关性程度非常低,几乎无关,故在构建模型的时候可以考虑删除该特征,但由于我们要构建的是随机森林模型,它对无关特征有着极强的鲁棒性,因此该特征也可以保留。
3). 降维可视化
在构建分类器之前,我们通常想要直观地从图像上来看一下我们的数据集长什么样,也就是不同类别的数据集之间的差异性情况,一般来讲,类别差异性越大,构建的分类模型效果越好。这个时候我们就要用到降维可视化了,接下来我们分别使用PCA(主成分分析)和Andrews curve来对数据集降维并绘制图像。
代码如下(接上部分),附详细注释
# 使用PCA对数据集降维并可视化
standard_x = scale(x, axis=0, with_mean=True, with_std=True)   # with_mean:均值标准化;with_std:方差标准化;axis=0:标准化每个特征,如果取1则标准化每个观测样本
pca = PCA(n_components = 2)
res_x = pca.fit_transform(standard_x)
fig = plt.figure(dpi=200, figsize=(10,5))
ax1 = fig.add_subplot(121)
ax1.scatter(res_x[:,0], res_x[:,1], c=colors)
ax1.set_title('PCA')
ax1.legend()

# 使用Andrews Curve对数据集降维可视化
ax2 = fig.add_subplot(122)
pd.plotting.andrews_curves(df, 'Survived', color=['g','m'], ax = ax2)     # 参数ax可以把绘图结果传递给matplotlib的axes
ax2.grid(True)
ax2.set_title('Andrews curve')

plt.savefig('Feature_analyze.jpg')
plt.show()
- 1
- 2
- 3
- 4
- 5
- 6
- 7
- 8
- 9
- 10
- 11
- 12
- 13
- 14
- 15
- 16
- 17
- 18
结果:
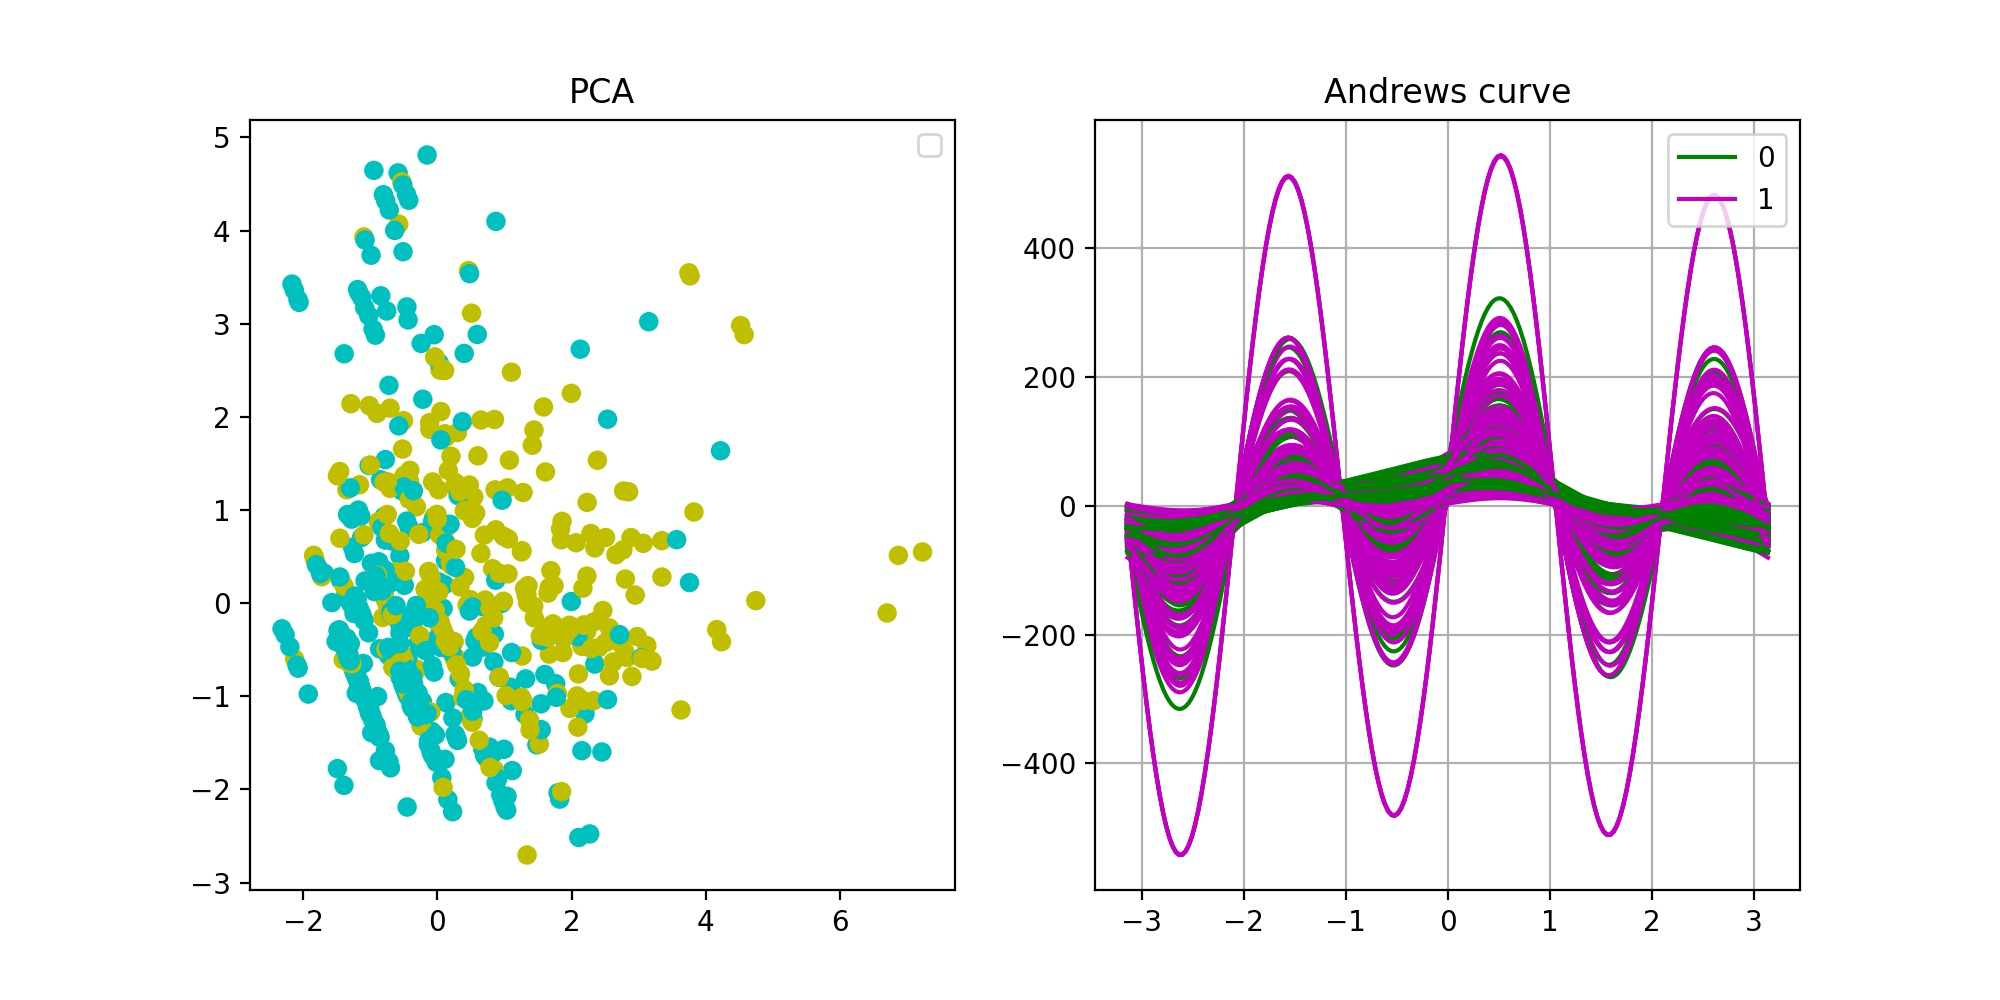
从PCA降维可视化结果(左图)可以看出,两种类别数据集之间有一定的差异性,但不是很显著,分开的不明显,这说明样本数据集的质量不够高。分析其原因,可能是因为样本集存在一定的偏差;也可能由于特征的纯度还不够,某些与分类预测强相关的特征还没有收集到数据集中。Andrews曲线(右图)结果和PCA结果相似,两类样本之间有差异性,但不够显著。
2. 建模调参
做完特征分析,接下来就可以构建模型了。本文我们使用的是随机森林,是一种性能强大的分类算法,属于集成学习(bagging)中的一种。关于随机森林算法的介绍,感兴趣可以参阅我的另一篇博文:随机森林算法介绍
首先,对数据集进行划分,训练集80%测试集20%,然后通过调用sklearn.ensemble.RandomForestClassifier模块来构建随机森林模型,再调整参数。调参的常用方法是网格搜索法,但是这里不推荐,因为太耗费时间和计算机资源。这里我们直接基于原始模型对每个参数分别调整,并分别可视化作图来观察最优参数。
注意:最终的调参的目标要以验证集得分高为主,训练集得分为辅,否则会出现过拟合。
代码如下(接上部分),附详细注释
# 自变量集
x = df.drop(['Survived'], axis=1)
# 因变量集
y = df['Survived']

# 数据集划分:训练集80%,测试集20%
x_train, x_test, y_train, y_test = train_test_split(
    x,      # 自变量集
    y,      # 因变量集
    stratify = y,   # 按照y列的比例来分层抽样
    random_state = 0,     # 指定随机状态
    train_size = 0.8)     # 训练集比例

# 调整参数:n_estimators(森林中的决策树数量),构建模型,绘制交叉验证得分图像
trees = list()
cross_val_scores = list()
train_set_scores = list()
for i in range(1,51):
    rf = RandomForestClassifier(n_estimators=i)
    rf.fit(x_train, y_train)
    scores = cross_val_score(rf, x_train, y_train)
    cross_val_scores.append(scores.mean())
    train_set_scores.append(rf.score(x_train, y_train))
    trees.append(i)
fig = plt.figure(figsize=(12,10), dpi=200)
ax1 = fig.add_subplot(221)      # 接下来总共要绘制4个子图合在一起
ax1.plot(trees, train_set_scores, color='dodgerblue', alpha=0.8)
ax1.plot(trees, cross_val_scores, color='g', alpha=0.8)
ax1.set_title('Scores for the number of trees')
ax1.legend(labels=['train_set_scores', 'cross_val_scores'])

# 调整参数:max_depth(树的最大深度),构建模型,绘制交叉验证得分图像
trees = list()
cross_val_scores = list()
train_set_scores = list()
for i in range(1,21):
    rf = RandomForestClassifier(max_depth=i)
    rf.fit(x_train, y_train)
    scores = cross_val_score(rf, x_train, y_train)
    cross_val_scores.append(scores.mean())
    train_set_scores.append(rf.score(x_train, y_train))
    trees.append(i)
ax2 = fig.add_subplot(222)
ax2.plot(trees, train_set_scores, color='dodgerblue', alpha=0.8)
ax2.plot(trees, cross_val_scores, color='g', alpha=0.8)
ax2.set_title('Scores for the maximum depth of tree')
ax2.legend(labels=['train_set_scores', 'cross_val_scores'])

# 调整参数:min_samples_leaf(叶子的最小样本数量),构建模型,绘制交叉验证得分图像
trees = list()
cross_val_scores = list()
train_set_scores = list()
for i in range(1,21):
    rf = RandomForestClassifier(min_samples_leaf=i)
    rf.fit(x_train, y_train)
    scores = cross_val_score(rf, x_train, y_train)
    cross_val_scores.append(scores.mean())
    train_set_scores.append(rf.score(x_train, y_train))
    trees.append(i)
ax1 = fig.add_subplot(223)
ax1.plot(trees, train_set_scores, color='dodgerblue', alpha=0.8)
ax1.plot(trees, cross_val_scores, color='g', alpha=0.8)
ax1.set_title('Scores for the minimum samples of leaf')
ax1.legend(labels=['train_set_scores', 'cross_val_scores'])

# 调整参数:min_samples_split(分裂内部节点需要的最少样例数),构建模型,绘制交叉验证得分图像
trees = list()
cross_val_scores = list()
train_set_scores = list()
for i in range(1,21):
    rf = RandomForestClassifier(min_samples_leaf=i)
    rf.fit(x_train, y_train)
    scores = cross_val_score(rf, x_train, y_train)
    cross_val_scores.append(scores.mean())
    train_set_scores.append(rf.score(x_train, y_train))
    trees.append(i)
ax1 = fig.add_subplot(224)
ax1.plot(trees, train_set_scores, color='dodgerblue', alpha=0.8)
ax1.plot(trees, cross_val_scores, color='g', alpha=0.8)
ax1.set_title('Scores for the minimum samples of split')
ax1.legend(labels=['train_set_scores', 'cross_val_scores'])

plt.savefig('Parameter adjustment.jpg')
plt.show()
- 1
- 2
- 3
- 4
- 5
- 6
- 7
- 8
- 9
- 10
- 11
- 12
- 13
- 14
- 15
- 16
- 17
- 18
- 19
- 20
- 21
- 22
- 23
- 24
- 25
- 26
- 27
- 28
- 29
- 30
- 31
- 32
- 33
- 34
- 35
- 36
- 37
- 38
- 39
- 40
- 41
- 42
- 43
- 44
- 45
- 46
- 47
- 48
- 49
- 50
- 51
- 52
- 53
- 54
- 55
- 56
- 57
- 58
- 59
- 60
- 61
- 62
- 63
- 64
- 65
- 66
- 67
- 68
- 69
- 70
- 71
- 72
- 73
- 74
- 75
- 76
- 77
- 78
- 79
- 80
- 81
- 82
- 83
- 84
- 85
结果:
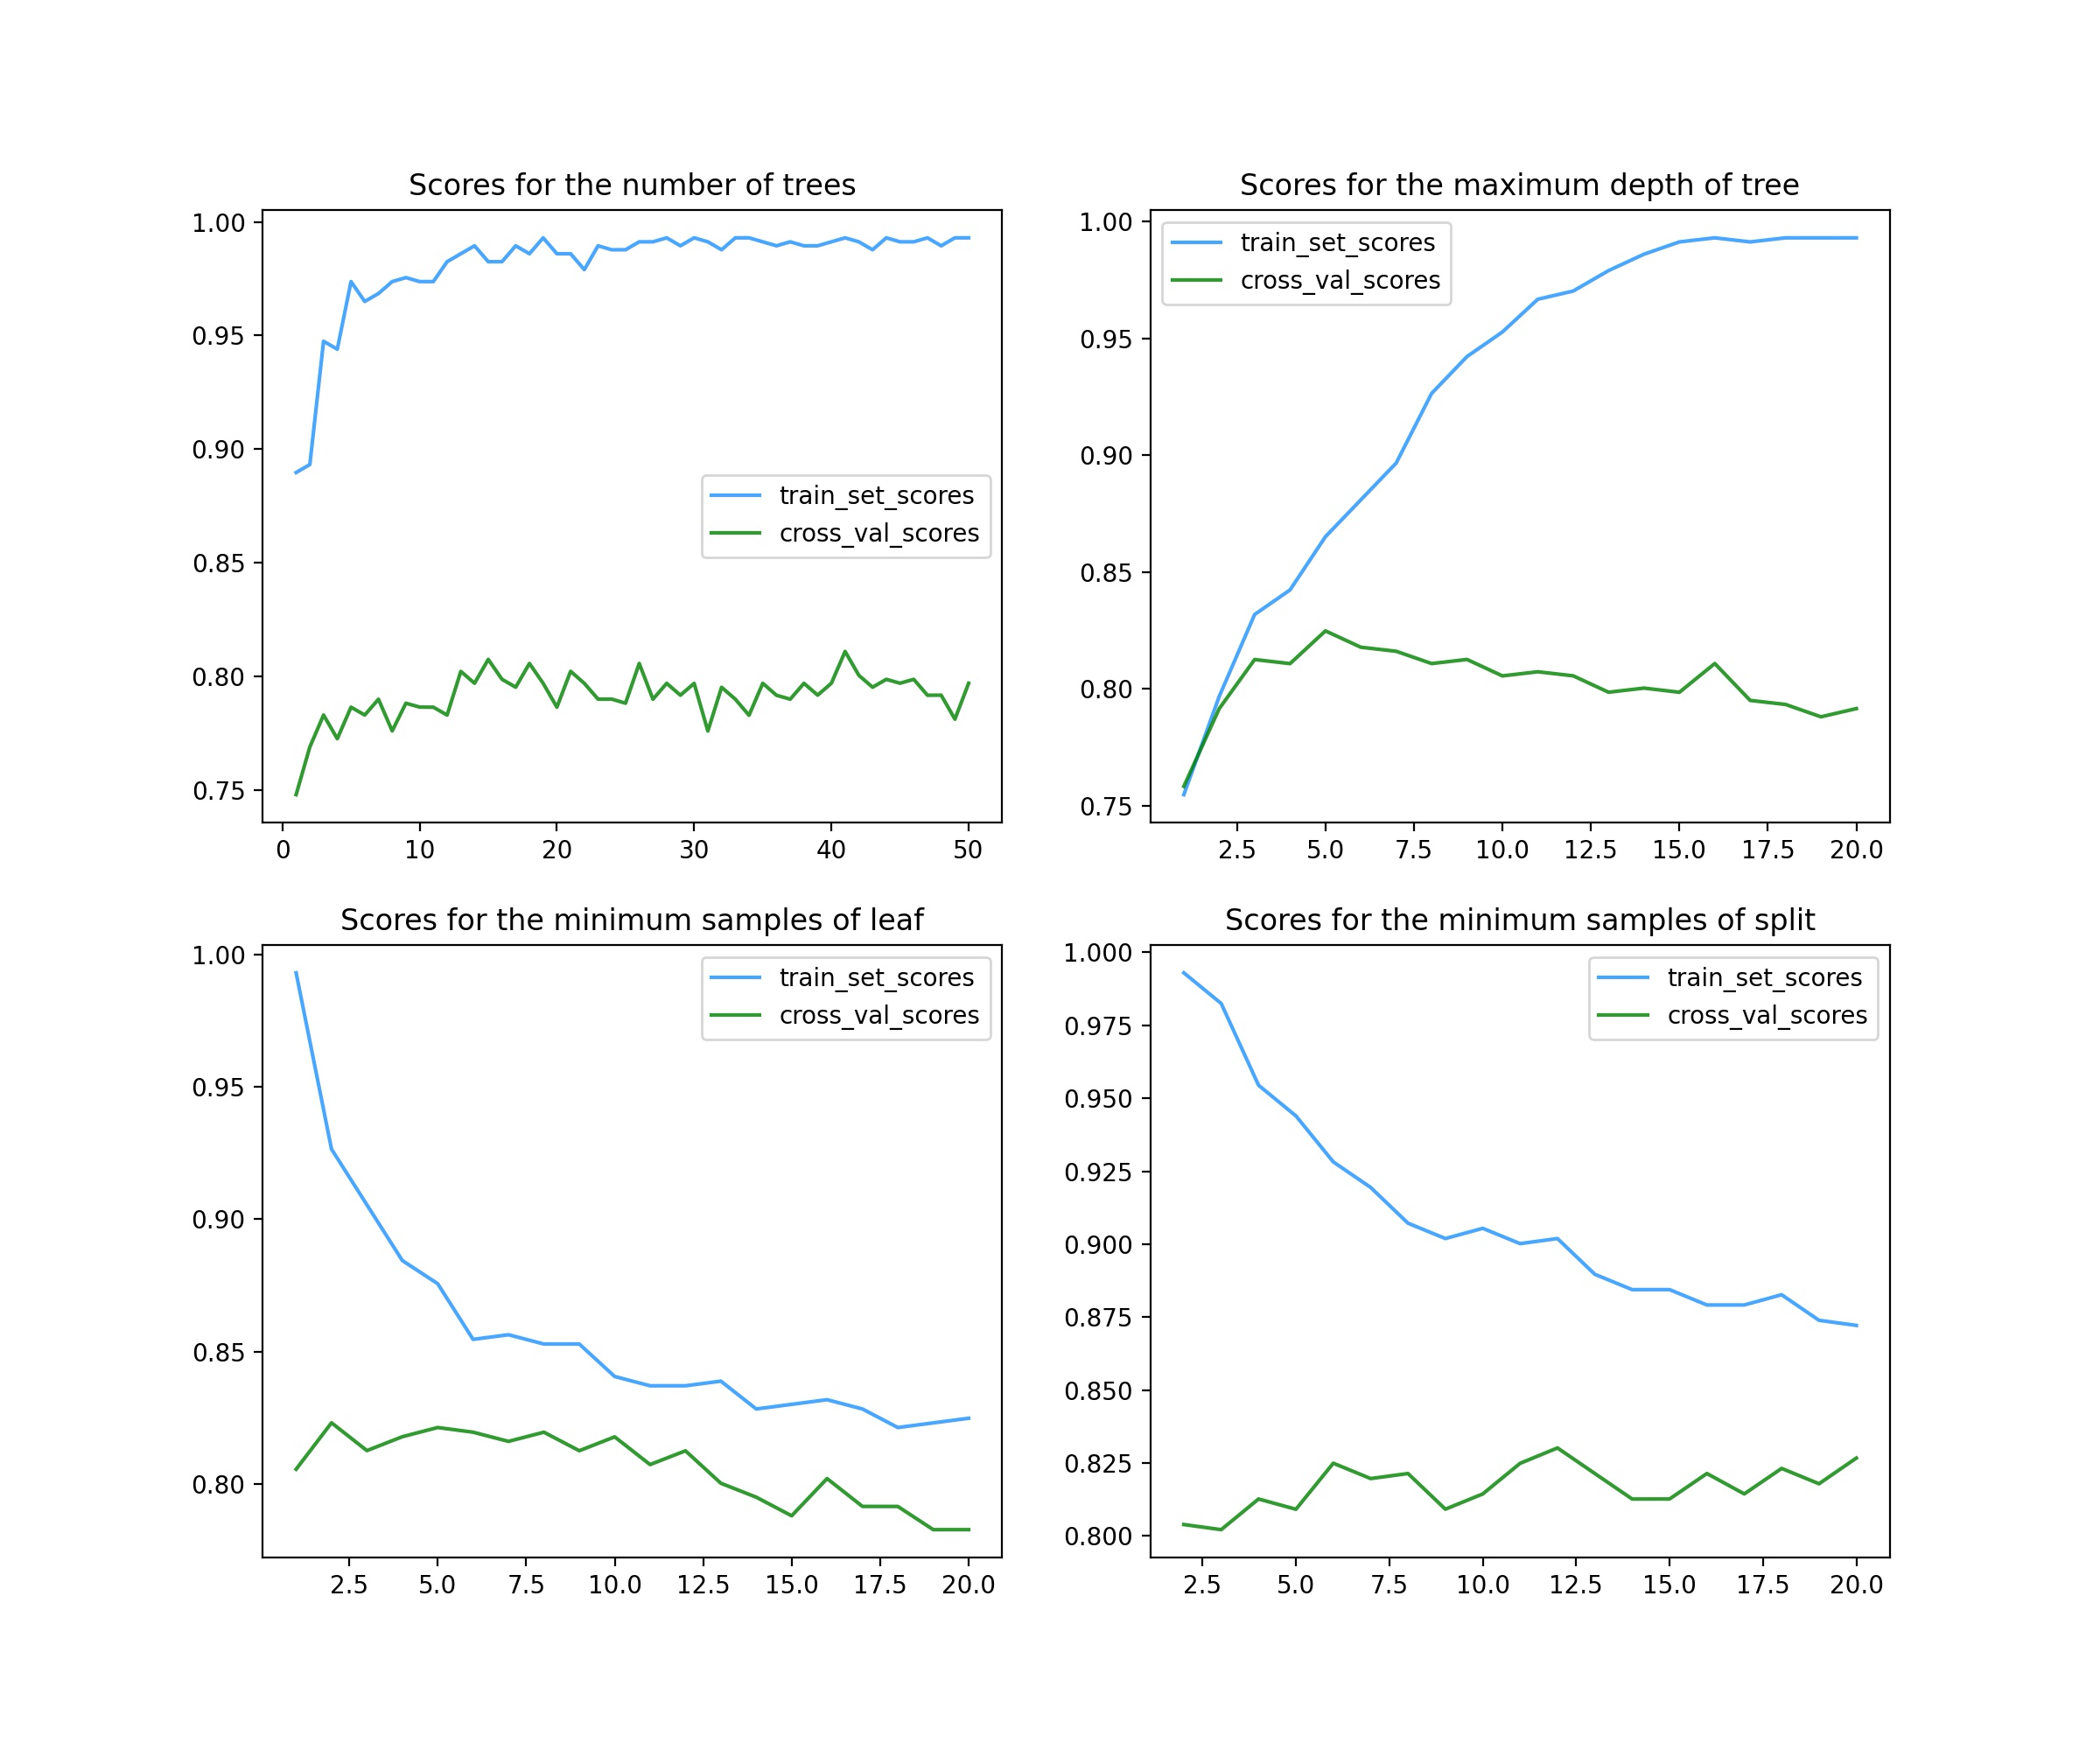
这里总共调整了4个参数。
第一个参数是n_estimators(左上图),代表随机森林中的决策树数量。在集成学习分类器中,一般情况下该参数越大,分类器效果越好,但同时运算速度会大大下降,故应该权衡来考虑。从图中可以看出,选择20以上都是可以的。
第二个参数是max_depth(右上图),代表单棵树的最大深度。深度越大,模型复杂度越高,偏差会下降但方差可能会升高(过拟合),从图中可以看出选择5~7都是没问题的。
第三个参数是min_samples_leaf(左下图),代表叶子的最小样本数量。这个参数调整的得分图像基本呈下降趋势,故使用默认值1就好。
第四个参数是min_samples_split,代表分裂内部节点需要的最少样例数。从图像看得分影响不大,可以选择11左右也可以不调整。
3. 模型评估
构建好了模型,接下来要对模型的效果进行评估。常用的评估方法有学习曲线、ROC曲线、PR曲线等。关于模型评估的详细介绍,感兴趣可以参阅我的另一篇博文:机器学习模型常用评估方法和指标
学习曲线是一种用来检测机器学习算法运行是否正常,或者改进算法模型的有效工具。可以通过调用sklearn.model_selection。learning_curve模块实现。ROC曲线和PR曲线也是评估模型质量的常用工具,通过调用sklearn.metrics.roc_curve和sklearn.metrics.precision_recall_curve来实现。最终,再用模型在测试集上进行测试并打分。
代码如下(接上部分),附详细注释
# 用调整好的参数构建模型,绘制学习曲线
rf = RandomForestClassifier(n_estimators=40, max_depth=6)
train_sizes, train_scores, cv_scores = learning_curve(
    rf,
    x_train,
    y_train,
    cv=5,
    train_sizes=np.linspace(0.01,1,100)   # 训练样本数量的递增比例情况,默认为np.linspace(0.1,1,5)
)           # 调用学习曲线函数,返回三个值:训练样本数递增的一维数组、交叉验证中训练集得分的二维表(包括每次cv)、交叉验证中验证集得分的二维表(包括每次cv)
train_scores_mean = np.mean(train_scores, axis=1)   # 求每次训练样本数量对应的训练集得分关于多次cv的均值
train_scores_std = np.std(train_scores, axis=1)     # 求每次训练样本数量对应的验证集得分关于多次cv的方差
cv_scores_mean = np.mean(cv_scores, axis=1)     # 求每次训练样本数量对应的验证集得分关于多次cv的均值
cv_scores_std = np.std(cv_scores, axis=1)       # 求每次训练样本数量对应的验证集得分关于多次cv的方差
# 可视化
fig = plt.figure(figsize=(8,6), dpi=200)
ax = fig.add_axes([0.1, 0.1, 0.8, 0.8])
ax.plot(train_sizes, train_scores_mean, color='dodgerblue', alpha=0.8)
ax.plot(train_sizes, cv_scores_mean, color='g', alpha=0.8)
ax.fill_between(train_sizes, train_scores_mean - train_scores_std, train_scores_mean + train_scores_std, alpha=0.1, color="dodgerblue")
ax.fill_between(train_sizes, cv_scores_mean - cv_scores_std, cv_scores_mean + cv_scores_std, alpha=0.1, color="g")
ax.legend(labels=['train_set_scores', 'cross_val_scores'], loc='best')
ax.set_title('Learning curve of the random forests')
ax.grid(True)
ax.set_xlabel('The number of training samples')
ax.set_ylabel('Model score')
plt.savefig('Learning curve of the random forests.jpg')
plt.show()

# 用构建好的模型,改变阈值梯度,用测试集数据绘制ROC曲线和PR曲线
rf.fit(x_train, y_train)
scores = rf.predict_proba(x_test)      # 得到数组(n_samples, n_features),每个样本预测为0和1分别的概率
y_score = scores[:,1]
fpr, tpr, shresholds = roc_curve(y_test, y_score, pos_label=1)   # 得到假阳性率数组、真阳性率数组、y_score排序后的数组(作为阈值)
aucval = auc(fpr, tpr)      # 计算AUC(ROC曲线下面积)
precision, recall, shresholds = precision_recall_curve(y_test, y_score, pos_label=1)   # 得到精确率数组、召回率率数组、y_score排序后的数组(作为阈值)
apval = average_precision_score(y_test, y_score)       # 计算AP(PR曲线下面积,平均精确率)
# 可视化
fig = plt.figure(dpi=200, figsize=(10,5))
ax1 = fig.add_subplot(121)
ax1.plot([0,1], [0,1], linestyle='--', color='dodgerblue')
ax1.plot(fpr, tpr, color='orange', linewidth = 3)
ax1.text(0, 0.9, 'AUC = '+str(round(aucval, 2)), color='orange', fontsize=15)
ax1.set_title('ROC curve')
ax1.set_xlabel('FPR')
ax1.set_ylabel('TPR')
ax2 = fig.add_subplot(122)
ax2.plot([0,1], [1,0], linestyle='--', color='dodgerblue')
ax2.plot(recall, precision, color='orange', linewidth=3)
ax2.text(0.7, 0.9, 'AP = '+str(round(apval, 2)), color='orange', fontsize=15)
ax2.set_title('PR curve')
ax2.set_xlabel('Recall')
ax2.set_ylabel('Precision')
plt.savefig('ROC curve and PR curve of the model')
plt.show()

# 最终用测试集测试模型,打分
test_score = rf.score(x_test, y_test)
print("最终模型的测试集的得分是:{}".format(test_score))
- 1
- 2
- 3
- 4
- 5
- 6
- 7
- 8
- 9
- 10
- 11
- 12
- 13
- 14
- 15
- 16
- 17
- 18
- 19
- 20
- 21
- 22
- 23
- 24
- 25
- 26
- 27
- 28
- 29
- 30
- 31
- 32
- 33
- 34
- 35
- 36
- 37
- 38
- 39
- 40
- 41
- 42
- 43
- 44
- 45
- 46
- 47
- 48
- 49
- 50
- 51
- 52
- 53
- 54
- 55
- 56
- 57
- 58
- 59
学习曲线结果:
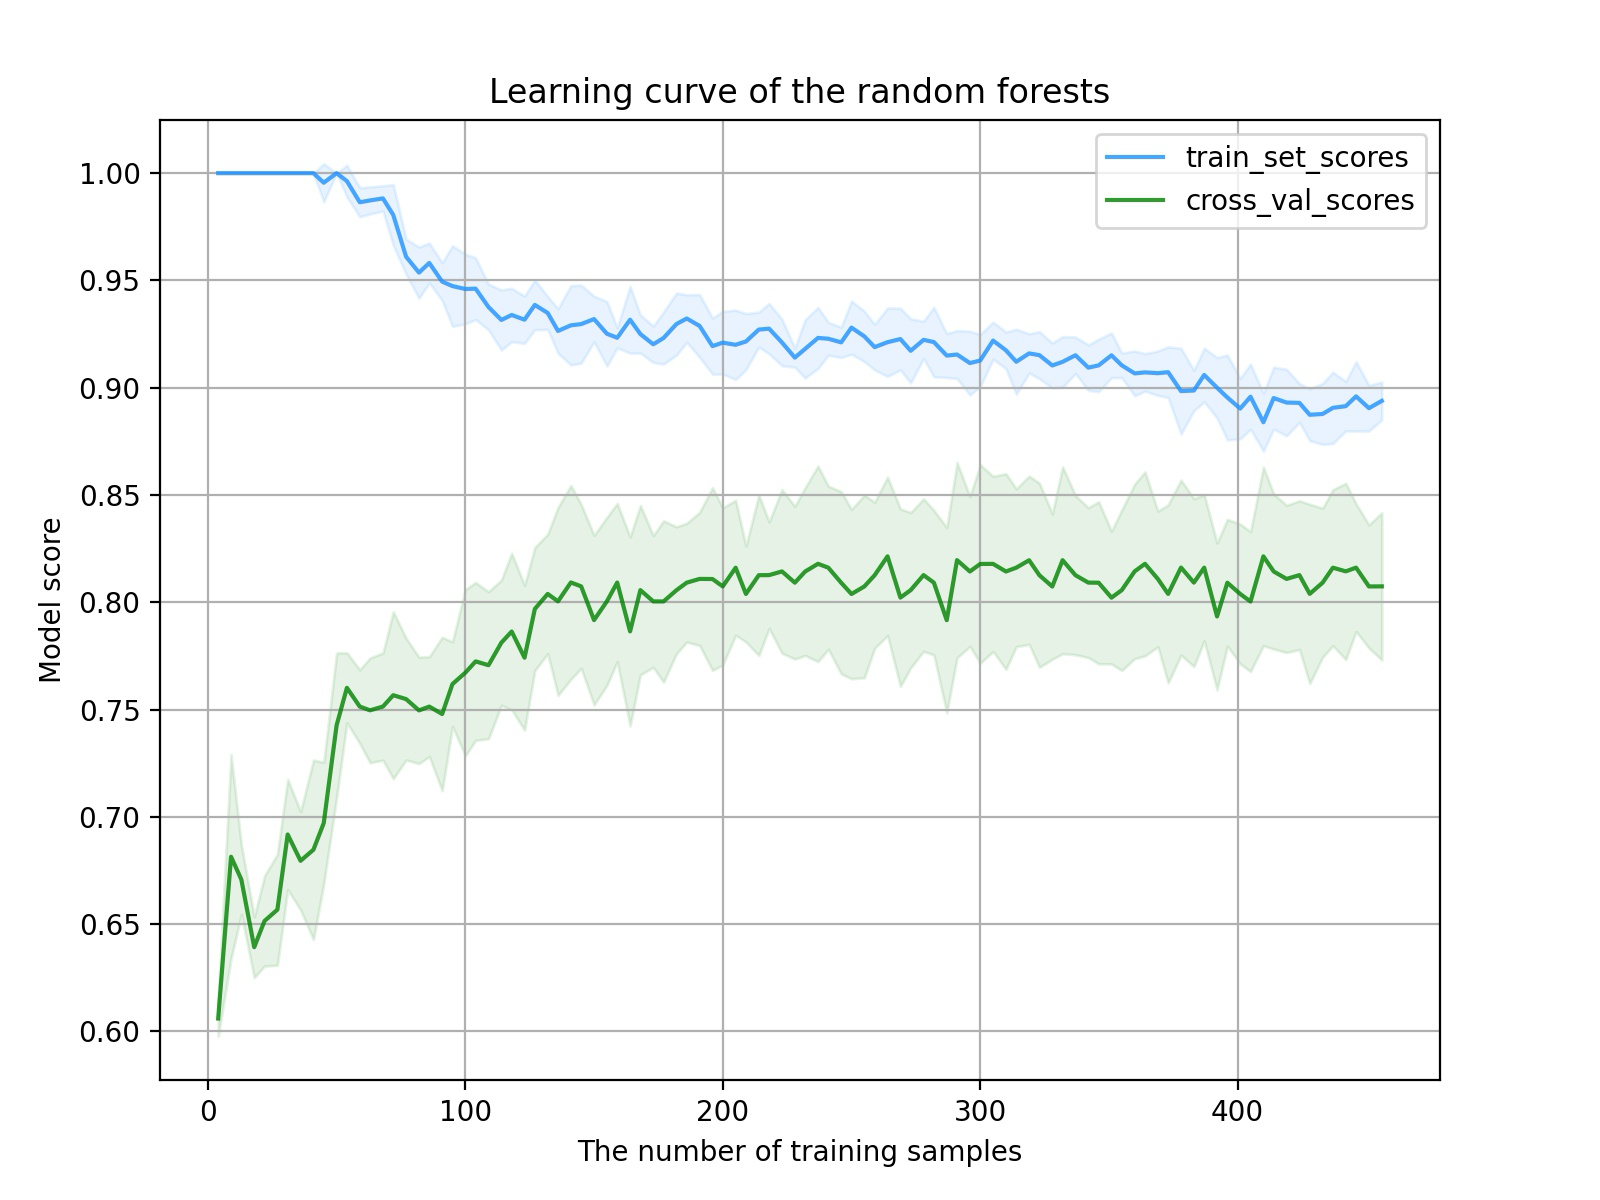
从图像可以看出,随着样本数的递增,训练集得分下降,验证集得分上升,模型训练过程正常,没什么大问题。但是进一步分析,该模型的学习曲线存在两个问题,一是到中间部分曲线的变化比较平缓,这说明特征的质量还不够高,无法让模型快速学习到分类的关键因素;另一个问题是最终训练集得分和验证集得分的距离相差不够小,这说明此时模型还没有达到最佳拟合状态,继续增加样本量可以改善这一问题(前提是还有样本的话)。
ROC曲线和PR曲线结果:
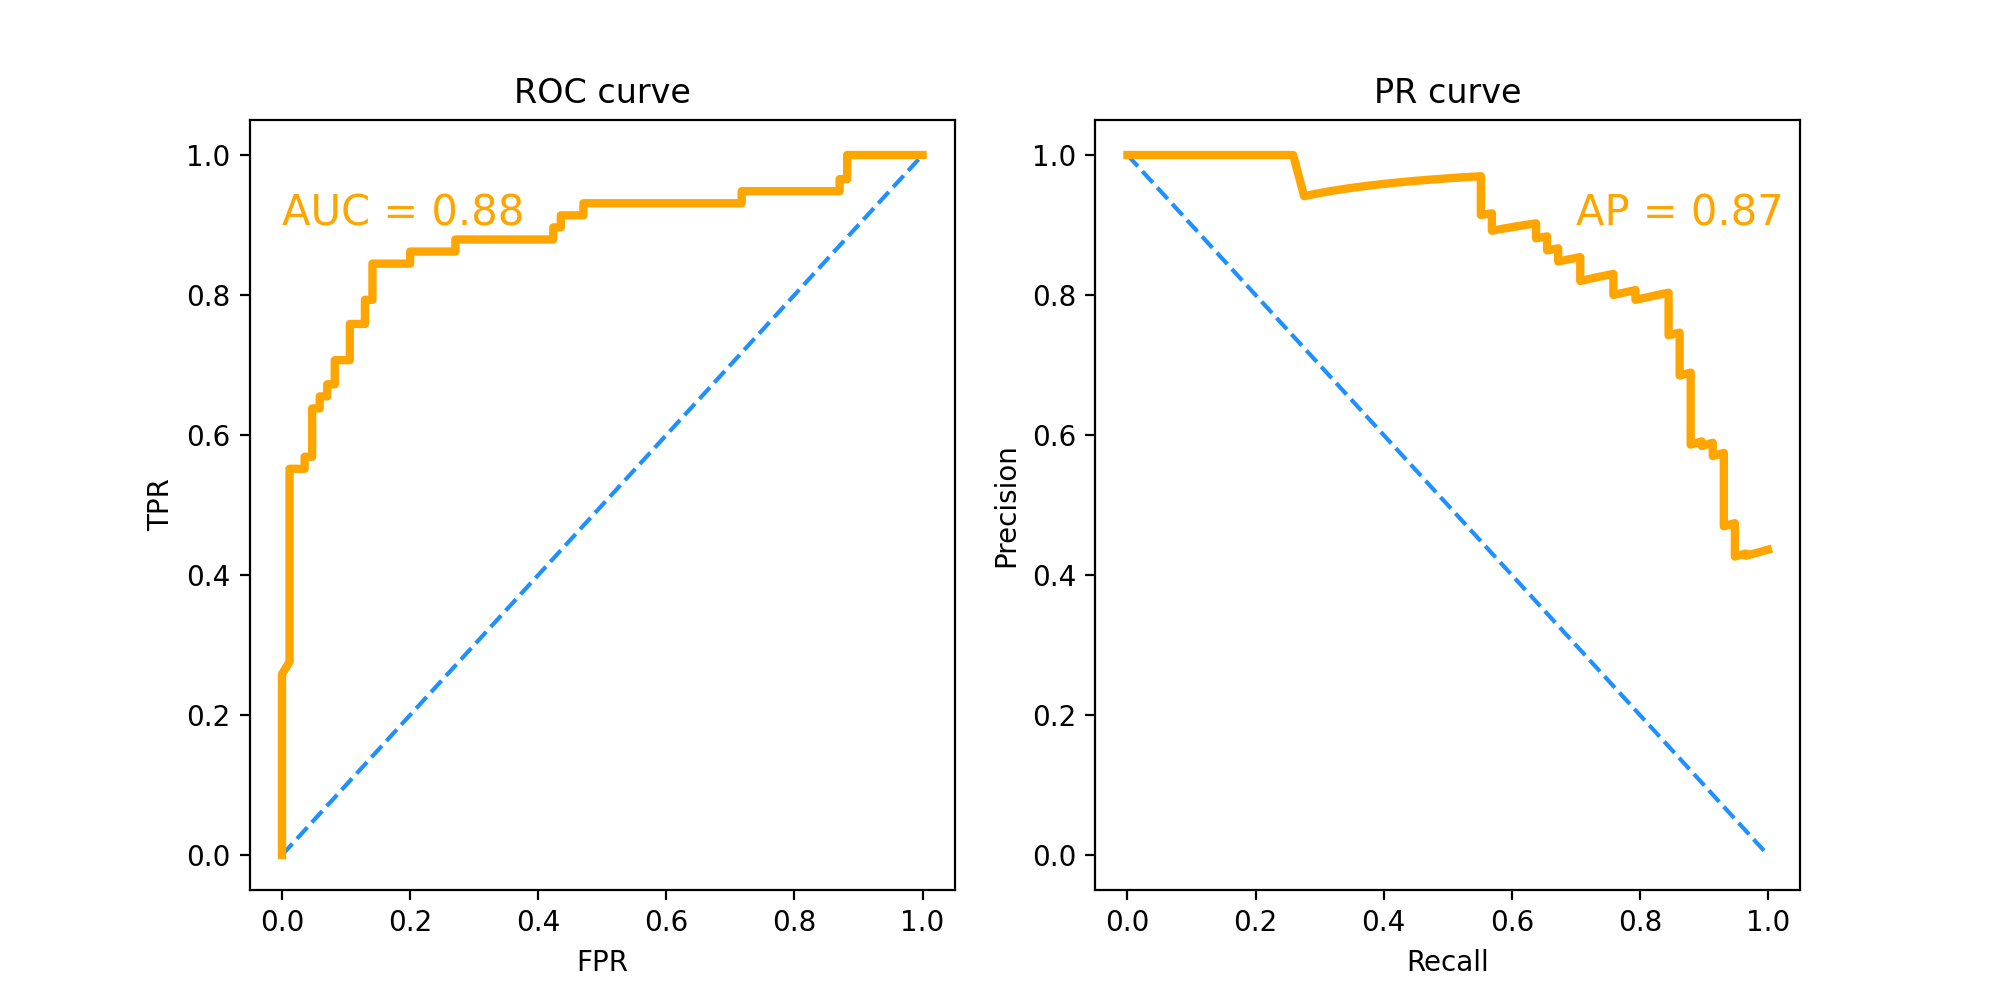
ROC曲线和PR曲线主要用来对比不同分类器之间的性能,其中ROC曲线对正负样本类别不平衡的数据集有很强的鲁棒性。
这里主要看AUC和AP的数值大小,也就是曲线下面积。AUC=0.88,AP=0.87,这个分数已经是比较高了,说明最终模型的性能良好。
有问题欢迎留言交流。
最后,如果你对Python数据分析、数据挖掘、机器学习等内容感兴趣,欢迎关注我!


