- 1新 CentOS 7 服务器的基本配置
- 2stm32_断点调试无法进入串口接收中断_stm32无法进入接收中断
- 3手把手教你安装VS2022_vs2022官网
- 4html登录页面整理_paxg.mcnhywc.cn
- 5H5网页微信支付成功后一直回调的解决方法_微信支付成功,一直回调
- 6Rxjava 操作符之辩解map和flatmap的区别_observable.flatmap
- 7three.js实现3D汽车展厅效果展示_threejs 停车场进出效果
- 8linux篇-用户密码与登录安全策略设置_linux密码策略
- 9html5 自动设置全屏,HTML5全屏(Fullscreen)API详细介绍
- 10Ubuntu 16.04下安装sogou 拼音输入法的错误问题_libopencc2
[Python] 三维散点/曲线/曲面 ( 含有笔记、代码、注释 )_python 三维曲面拟合
赞
踩
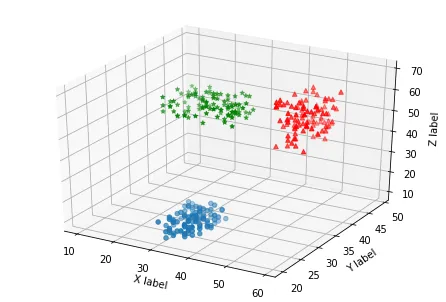
3D散点
## 3D散点
import matplotlib as mpl
import matplotlib.pyplot as plt
from mpl_toolkits.mplot3d import Axes3D
import numpy as np

xs1 = np.random.randint(30,40,100)
ys1 = np.random.randint(20,30,100)
zs1 = np.random.randint(10,20,100)
xs2 = np.random.randint(50,60,100)
ys2 = np.random.randint(30,40,100)
zs2 = np.random.randint(50,70,100)
xs3 = np.random.randint(10,30,100)
ys3 = np.random.randint(40,50,100)
zs3 = np.random.randint(40,50,100)

# 方式1:设置三维图形模式
fig = plt.figure() # 创建一个画布figure,然后在这个画布上加各种元素。
ax = Axes3D(fig) # 将画布作用于 Axes3D 对象上。

ax.scatter(xs1,ys1,zs1) # 画出(xs1,ys1,zs1)的散点图。
ax.scatter(xs2,ys2,zs2,c='r',marker='^')
ax.scatter(xs3,ys3,zs3,c='g',marker='*')

ax.set_xlabel('X label') # 画出坐标轴
ax.set_ylabel('Y label')
ax.set_zlabel('Z label')

plt.show()
- 1
- 2
- 3
- 4
- 5
- 6
- 7
- 8
- 9
- 10
- 11
- 12
- 13
- 14
- 15
- 16
- 17
- 18
- 19
- 20
- 21
- 22
- 23
- 24
- 25
- 26
- 27
- 28
- 29
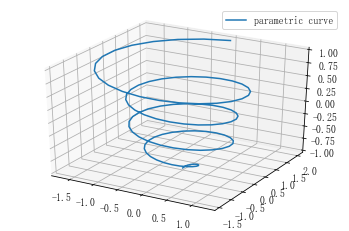
3D曲线
import matplotlib as mpl
from mpl_toolkits.mplot3d import Axes3D
import numpy as np
import matplotlib.pyplot as plt

# 设置图例字号
mpl.rcParams['legend.fontsize'] = 10

# 方式2:设置三维图形模式
fig = plt.figure()
ax = fig.gca(projection='3d')

# 测试数据
theta = np.linspace(-4 * np.pi, 4 * np.pi, 100)
z = np.linspace(-4, 4, 100) / 4
r = z**3 + 1
x = r * np.sin(theta)
y = r * np.cos(theta)

# 绘制图形
ax.plot(x, y, z, label='parametric curve')

# 显示图例
ax.legend()

# 显示图形
plt.show()
- 1
- 2
- 3
- 4
- 5
- 6
- 7
- 8
- 9
- 10
- 11
- 12
- 13
- 14
- 15
- 16
- 17
- 18
- 19
- 20
- 21
- 22
- 23
- 24
- 25
- 26
- 27
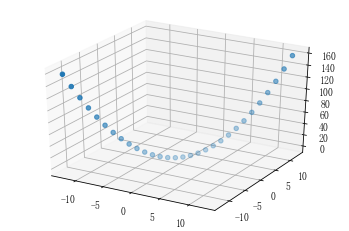
3D曲线拟合(含噪音)
# 不含噪声散点图
import matplotlib as mpl
from mpl_toolkits.mplot3d import Axes3D
import numpy as np
import matplotlib.pyplot as plt

# 设置图例字号
mpl.rcParams['legend.fontsize'] = 10

# 方式2:设置三维图形模式
fig = plt.figure()
ax = fig.gca(projection='3d')

# 测试数据
x = np.linspace(-4 * np.pi, 4 * np.pi, 30)
y = x
z = x * x

ax.scatter(x,y,z) # 画出(x,y,z)的散点图。
- 1
- 2
- 3
- 4
- 5
- 6
- 7
- 8
- 9
- 10
- 11
- 12
- 13
- 14
- 15
- 16
- 17
- 18
- 19
运行结果:
<mpl_toolkits.mplot3d.art3d.Path3DCollection at 0x2e7d13350d0>
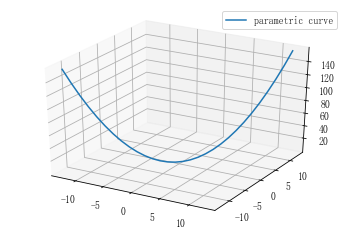
# 不含噪声曲线图
import matplotlib as mpl
from mpl_toolkits.mplot3d import Axes3D
import numpy as np
import matplotlib.pyplot as plt

# 设置图例字号
mpl.rcParams['legend.fontsize'] = 10

# 方式2:设置三维图形模式
fig = plt.figure()
ax = fig.gca(projection='3d')

# 测试数据
x = np.linspace(-4 * np.pi, 4 * np.pi, 30)
y = x
z = x * x

# 绘制图形
ax.plot(x, y, z, label='parametric curve')

# 显示图例
ax.legend()

# 显示图形
plt.show()
- 1
- 2
- 3
- 4
- 5
- 6
- 7
- 8
- 9
- 10
- 11
- 12
- 13
- 14
- 15
- 16
- 17
- 18
- 19
- 20
- 21
- 22
- 23
- 24
- 25
- 26
# 含噪声散点图
import matplotlib as mpl
from mpl_toolkits.mplot3d import Axes3D
import numpy as np
import matplotlib.pyplot as plt

# 设置图例字号
mpl.rcParams['legend.fontsize'] = 10

# 方式2:设置三维图形模式
fig = plt.figure()
ax = fig.gca(projection='3d')

# 测试数据
x = np.linspace(-4 * np.pi, 4 * np.pi, 30)
y = x + np.random.randn(y.shape[-1]) * 2.5
z = x * x

ax.scatter(x,y,z) # 画出(x,y,z)的散点图。
- 1
- 2
- 3
- 4
- 5
- 6
- 7
- 8
- 9
- 10
- 11
- 12
- 13
- 14
- 15
- 16
- 17
- 18
- 19
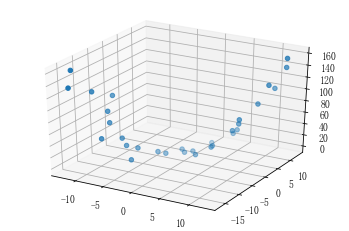
运行结果:
<mpl_toolkits.mplot3d.art3d.Path3DCollection at 0x2e7cf46fbe0>
# 含噪声曲线图
import matplotlib as mpl
from mpl_toolkits.mplot3d import Axes3D
import numpy as np
import matplotlib.pyplot as plt

# 设置图例字号
mpl.rcParams['legend.fontsize'] = 10

# 方式2:设置三维图形模式
fig = plt.figure()
ax = fig.gca(projection='3d')

# 测试数据
x = np.linspace(-4 * np.pi, 4 * np.pi, 30)
y = x + np.random.randn(x.shape[-1]) * 2.5
z = x * x

# 绘制图形
ax.plot(x, y, z, label='parametric curve')

# 显示图例
ax.legend()

# 显示图形
plt.show()
- 1
- 2
- 3
- 4
- 5
- 6
- 7
- 8
- 9
- 10
- 11
- 12
- 13
- 14
- 15
- 16
- 17
- 18
- 19
- 20
- 21
- 22
- 23
- 24
- 25
- 26

# 含噪声曲线拟合图
import matplotlib as mpl
from mpl_toolkits.mplot3d import Axes3D
import numpy as np
import matplotlib.pyplot as plt


# 设置图例字号
mpl.rcParams['legend.fontsize'] = 10

# 方式2:设置三维图形模式
fig = plt.figure()
ax = fig.gca(projection='3d')

# 测试数据
x = np.linspace(-4 * np.pi, 4 * np.pi, 30)
y = x + np.random.randn(x.shape[-1]) * 0.7
z = x * x

# 绘制图形
ax.plot(x, y, z, label='parametric1 curve')

p_yx = np.polyfit(y,x,2);
x_out = np.polyval(p_yx, y);
p_yz = np.polyfit(y,z,2);
z_out = np.polyval(p_yz, y);
ax.plot(x_out, y, z_out, label='parametric2 curve')

# 显示图例
ax.legend()

# 显示图形
plt.show()

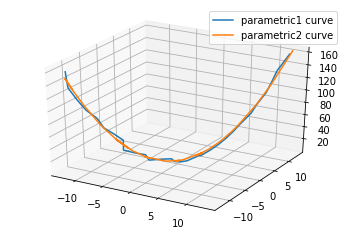
# 拟合是拟合出一个误差小的曲线,这里并不包括光滑,当噪音大时,拟合的曲线不光滑。
- 1
- 2
- 3
- 4
- 5
- 6
- 7
- 8
- 9
- 10
- 11
- 12
- 13
- 14
- 15
- 16
- 17
- 18
- 19
- 20
- 21
- 22
- 23
- 24
- 25
- 26
- 27
- 28
- 29
- 30
- 31
- 32
- 33
- 34
- 35
3D曲面
import matplotlib as mpl
from mpl_toolkits.mplot3d import Axes3D
import numpy as np
import matplotlib.pyplot as plt

fig = plt.figure()
ax3 = plt.axes(projection='3d')

plt.rcParams['font.sans-serif']=['FangSong'] # 用来正常显示中文标签
plt.rcParams['axes.unicode_minus']=False # 用来正常显示负号

#定义三维数据
xx = np.arange(-5,5,0.5)
yy = np.arange(-5,5,0.5)
X, Y = np.meshgrid(xx, yy)
Z = np.sin(X)+np.cos(Y)

#作图
ax3.plot_surface(X,Y,Z,cmap='rainbow')
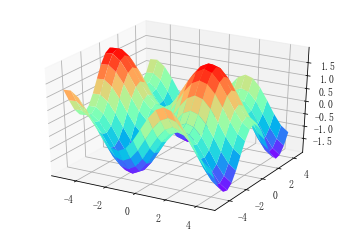
# 改变cmap参数可以控制三维曲面的颜色组合, 一般我们见到的三维曲面就是 rainbow 的

plt.show()
- 1
- 2
- 3
- 4
- 5
- 6
- 7
- 8
- 9
- 10
- 11
- 12
- 13
- 14
- 15
- 16
- 17
- 18
- 19
- 20
- 21
- 22
曲面颜色
import matplotlib as mpl
from mpl_toolkits.mplot3d import Axes3D
import numpy as np
import matplotlib.pyplot as plt

'''使用figure对象'''
fig = plt.figure()
'''创建3D轴对象'''
ax = Axes3D(fig)
'''X坐标数据'''
X = np.arange(-2,2,0.1)
'''Y坐标数据'''
Y = np.arange(-2,2,0.1)
'''计算3维曲面分格线坐标'''
X,Y = np.meshgrid(X,Y)
'''用于计算X/Y对应的Z值'''
def f(x,y):
    return (1-y**5+x**5)*np.exp(-x**2-y**2)
'''plot_surface函数可绘制对应的曲面'''
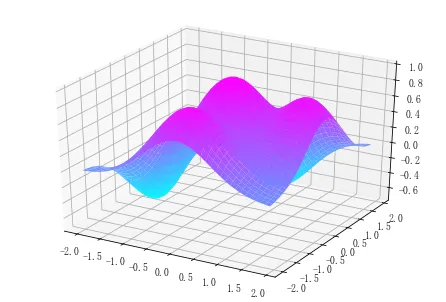
ax.plot_surface(X,Y,f(X,Y),rstride=1,cstride=1,cmap=plt.cm.cool) # 通过修改camp修改曲面颜色
'''显示'''
plt.show()
- 1
- 2
- 3
- 4
- 5
- 6
- 7
- 8
- 9
- 10
- 11
- 12
- 13
- 14
- 15
- 16
- 17
- 18
- 19
- 20
- 21
- 22
曲面旋转
import matplotlib as mpl
from mpl_toolkits.mplot3d import Axes3D
import numpy as np
import matplotlib.pyplot as plt

'''使用figure对象'''
fig = plt.figure()
'''创建3D轴对象'''
ax = Axes3D(fig)
'''X坐标数据'''
X = np.arange(-2,2,0.1)
'''Y坐标数据'''
Y = np.arange(-2,2,0.1)
'''计算3维曲面分格线坐标'''
X,Y = np.meshgrid(X,Y)
'''用于计算X/Y对应的Z值'''
def f(x,y):
    return (1-y**5+x**5)*np.exp(-x**2-y**2)
'''plot_surface函数可绘制对应的曲面'''
ax.plot_surface(X,Y,f(X,Y),rstride=1,cstride=1,cmap=plt.cm.hot)
'''旋转'''
ax.view_init(elev=30,azim=125)
'''显示'''
plt.show()
- 1
- 2
- 3
- 4
- 5
- 6
- 7
- 8
- 9
- 10
- 11
- 12
- 13
- 14
- 15
- 16
- 17
- 18
- 19
- 20
- 21
- 22
- 23
- 24

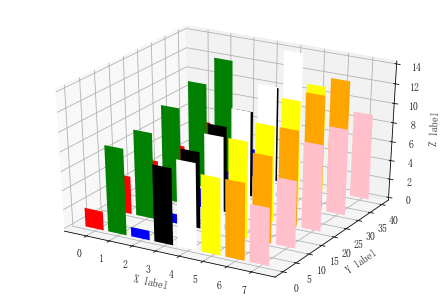
3D条形图
import matplotlib as mpl
from mpl_toolkits.mplot3d import Axes3D
import numpy as np
import matplotlib.pyplot as plt

x = np.arange(8)
y = np.random.randint(0,10,8)

y2 = y + np.random.randint(0,3,8)
y3 = y2 + np.random.randint(0,3,8)
y4 = y3 + np.random.randint(0,3,8)
y5 = y4 + np.random.randint(0,3,8)

clr = ['red','green','blue','black','white','yellow','orange','pink']

fig = plt.figure()
ax = Axes3D(fig)

ax.bar(x,y,0,zdir='y',color=clr)
ax.bar(x,y2,10,zdir='y',color=clr)
ax.bar(x,y3,20,zdir='y',color=clr)
ax.bar(x,y4,30,zdir='y',color=clr)
ax.bar(x,y5,40,zdir='y',color=clr)

ax.set_xlabel('X label')
ax.set_ylabel('Y label')
ax.set_zlabel('Z label')

plt.show()
- 1
- 2
- 3
- 4
- 5
- 6
- 7
- 8
- 9
- 10
- 11
- 12
- 13
- 14
- 15
- 16
- 17
- 18
- 19
- 20
- 21
- 22
- 23
- 24
- 25
- 26
- 27
- 28
- 29
附录01:三维绘图函数Axes3D
① mpl_toolkits.mplot3d是Matplotlib里面专门用来画三维图的工具包。
② Axes3D是mpl_toolkits.mplot3d中的一个绘图函数。
③ 创建 Axes3D主要有两种方式,一种是利用关键字projection='3d’来实现,另一种则是通过从mpl_toolkits.mplot3d导入对象Axes3D来实现,目的都是生成具有三维格式的对象Axes3D。
附录02:.view_init(elev,azim)
① elev为仰角,azim为方位角。
关于Python技术储备
学好 Python 不论是就业还是做副业赚钱都不错,但要学会 Python 还是要有一个学习规划。最后大家分享一份全套的 Python 学习资料,给那些想学习 Python 的小伙伴们一点帮助!
一、Python所有方向的学习路线
Python所有方向的技术点做的整理,形成各个领域的知识点汇总,它的用处就在于,你可以按照上面的知识点去找对应的学习资源,保证自己学得较为全面。

二、Python必备开发工具

三、Python视频合集
观看零基础学习视频,看视频学习是最快捷也是最有效果的方式,跟着视频中老师的思路,从基础到深入,还是很容易入门的。

四、实战案例
光学理论是没用的,要学会跟着一起敲,要动手实操,才能将自己的所学运用到实际当中去,这时候可以搞点实战案例来学习。

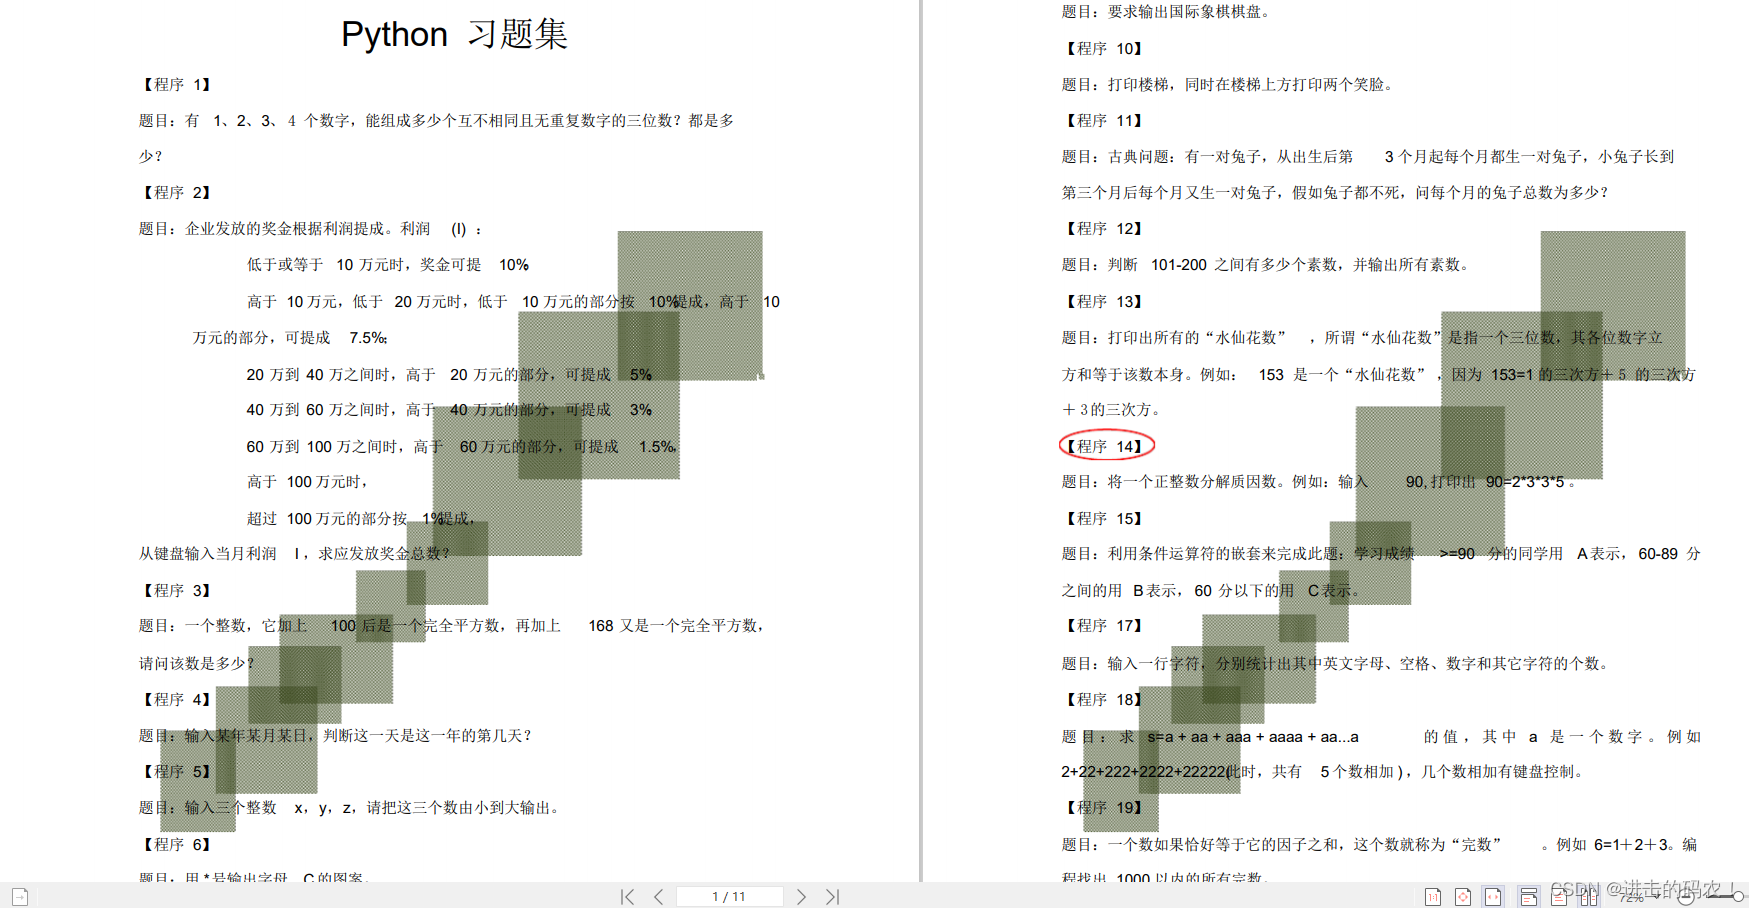
五、Python练习题
检查学习结果。
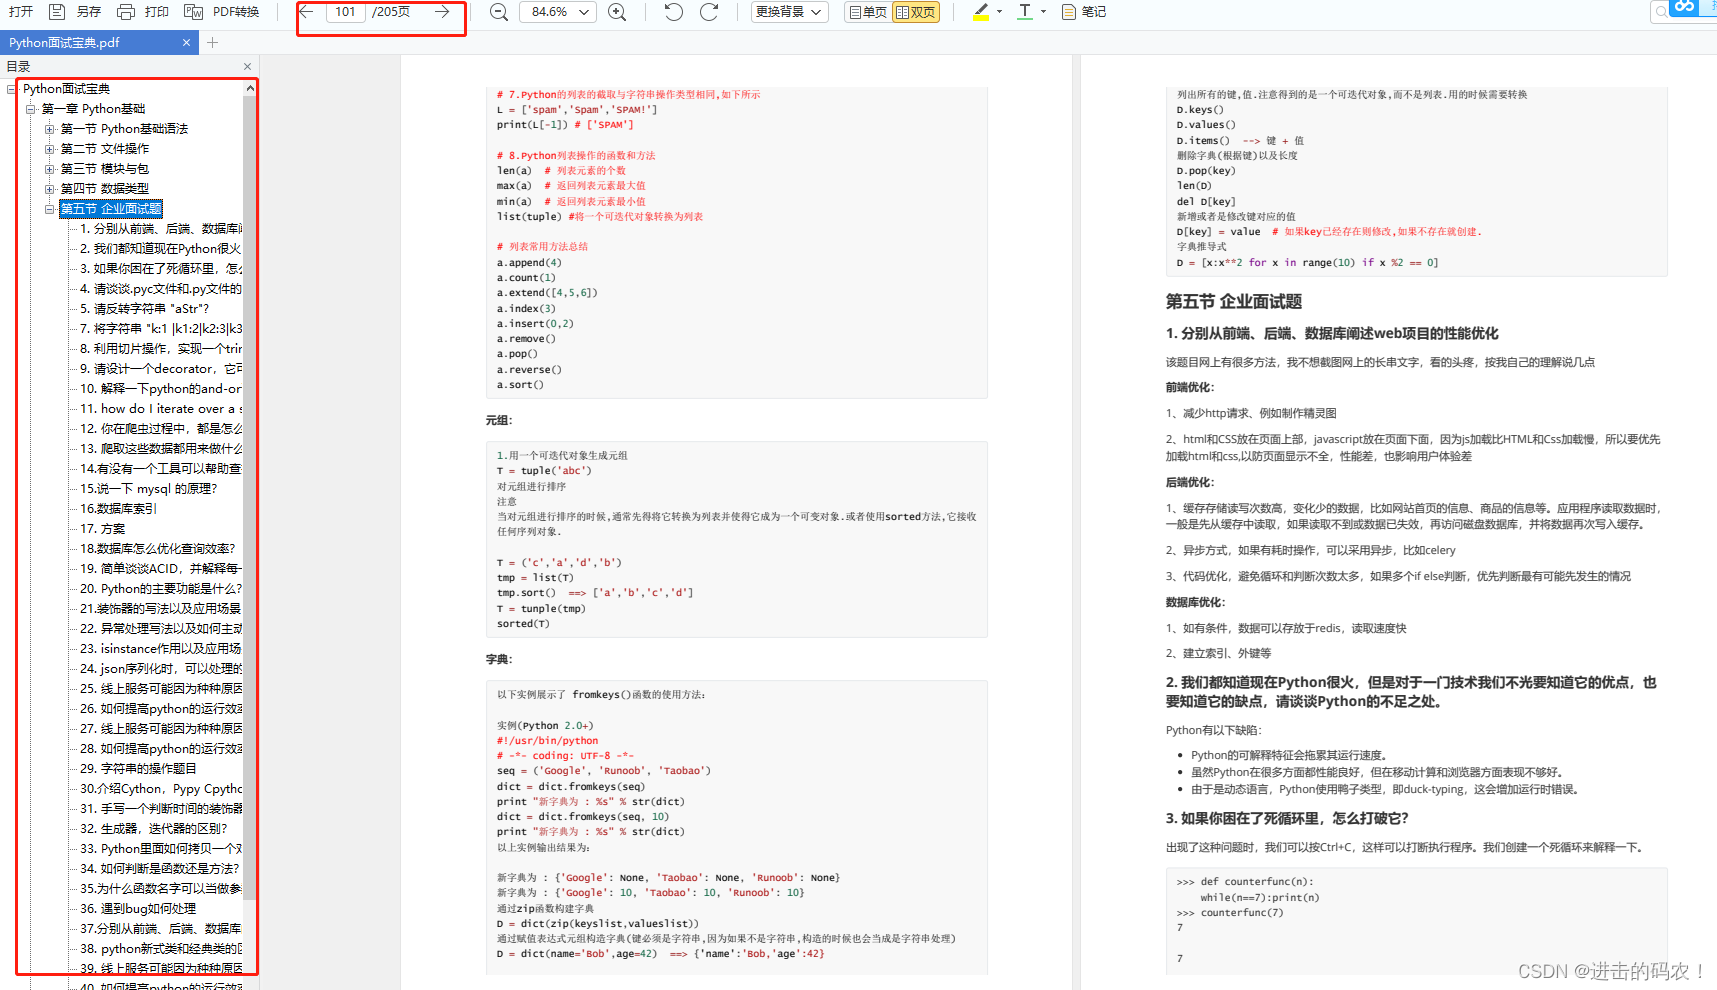
六、面试资料
我们学习Python必然是为了找到高薪的工作,下面这些面试题是来自阿里、腾讯、字节等一线互联网大厂最新的面试资料,并且有阿里大佬给出了权威的解答,刷完这一套面试资料相信大家都能找到满意的工作。

上述这份完整版的Python全套学习资料已经上传CSDN官方,如果需要可以微信扫描下方CSDN官方认证二维码 即可领取
声明:本文内容由网友自发贡献,不代表【wpsshop博客】立场,版权归原作者所有,本站不承担相应法律责任。如您发现有侵权的内容,请联系我们。转载请注明出处:https://www.wpsshop.cn/w/Monodyee/article/detail/102084
Copyright © 2003-2013 www.wpsshop.cn 版权所有,并保留所有权利。


