- 1【Linux】Shell运行原理和Linux权限_linux怎么删除有写保护的普通文件csdn
- 2陪诊小程序:温暖您的就医之路,让关怀触手可及
- 3无胁科技-TVD每日漏洞情报-2022-7-31_漏洞 /workrelate/plan/util/uploaderoperate.jsp
- 4CocosCreator中快速实现HTTP_cocos 3.0 httppost
- 5Python数据挖掘——文本分析_python文本分析案例
- 6eclipse中在maven工程 的pom.xml文件中增加依赖的方法_pom.xml怎么载入依赖
- 7敏感词过滤算法对比,顺便开源了个工具库_有哪些过滤语句的开源模型
- 8前端uniapp自定义tabbar,在iPoneX上,tabbar有个盒子用了绝对定位position: absolute被遮住问题,env(safe-area-inset-bottom)无效_uniapp苹果absolute失效
- 9微服务间服务(接口)调用关系你还在手工记录吗
- 10Unity 预定义标签_unity script define symbols
echarts5 没有map(实现中国地图+按需引入)_echarts5地图
赞
踩
目录
vue 项目通过 npm install echarts --save 安装的是最新版,在echarts4.9以后的版本中移除了map地图

由于我的项目是按需引入,地图是其他图表组件开发完成之后说要加进来的,将当前版本卸载,去下载 4.9.0 这种方法容易出bug。
npm uninstall echarts
npm install echarts@4.9.0 --save
一、解决新版本没有map的情况
1.1、方案一:两个版本同时存在并使用
地图组件中使用Echarts4,其余组件均使用Echarts5
npm install echarts@5.3.0
npm install echarts4@npm:echarts@^4.9.0
第二步:在main.js中或者页面内注册
- import * as echarts from 'echarts'
- import * as echarts4 from 'echarts4'
-
- // 中国地图的json https://geo.datav.aliyun.com/areas_v3/bound/100000_full.json
- import chinaMap from '@/assets/china.json'
- // 加载echarts4版本总的china.js
- import 'echarts4/map/js/china.js'
- // 注册地图
- echarts4.registerMap('china', chinaMap)
单独下载中国地图json数据的地址:https://geo.datav.aliyun.com/areas_v3/bound/100000_full.json
第三步:使用
- <div id="map" style="width:500px;height:500px"></div>
-
- methods:{
- init(){
- const myChart = this.$echarts4.init(document.getElementById('map'));
- // 配置
- }
- },
- created(){
- this.init();
- }
1.2、方案二:引入map文件
!!!echarts插件中没有map文件夹 - 简书在安装echarts,导入插件后发现没有map文件夹。本意是想导入中国地图 echarts现在已经不提供地图map包的下载了,但在HTML上是可以直接引用的,vue[http...https://www.jianshu.com/p/d92123be8b3d 新版本 V5 将 map 去掉了,那需要的地图的时候我们自己把 map 文件加到 echarts 插件中。
第一步:将 map 文件夹放到 node_modules 中的 echarts 文件里。
(1)获取 map 文件:链接: https://pan.baidu.com/s/1Vxv6mUgeT0qI_-CECkS3EA 密码: a6kn;
(2)获取 map 文件:安装 echarts@4.9.0,找到 node_modules/echarts,将 echarts 文件夹下的 map 文件夹复制出来。

第二步:页面内使用
- import china from 'echarts/map/json/china.json'
-
- created(){
- echarts.registerMap('china', china);
- this.initMap();
- }
二、按需引入
在项目中引入 ECharts - 入门篇 - Handbook - Apache ECharts https://echarts.apache.org/handbook/zh/basics/import/#%E6%8C%89%E9%9C%80%E5%BC%95%E5%85%A5-echarts-%E5%9B%BE%E8%A1%A8%E5%92%8C%E7%BB%84%E4%BB%B6 由于 echarts 只在一个页面中用到,按照官网链接上给的代码复制之后,我开了一个新 js 页面,专门存放 按需引入的 echarts 代码。
第一步:新建一个 js 文件,输入自己需要的组件 @/utils/echarts/index.js
- // 引入 echarts 核心模块,核心模块提供了 echarts 使用必须要的接口。
- import * as echarts from "echarts/core";
-
- /** 引入柱状图and折线图图表,图表后缀都为 Chart */
- import { BarChart, LineChart,PieChart,MapChart } from "echarts/charts";
-
- // 引入提示框,标题,直角坐标系,数据集,内置数据转换器组件,组件后缀都为 Component
- import {
- TitleComponent,
- TooltipComponent,
- GridComponent,
- DatasetComponent,
- TransformComponent,
- LegendComponent,
- GeoComponent,
- VisualMapComponent
- } from "echarts/components";
-
- // 标签自动布局,全局过渡动画等特性
- import { LabelLayout, UniversalTransition } from "echarts/features";
-
- // 引入 Canvas 渲染器,注意引入 CanvasRenderer 或者 SVGRenderer 是必须的一步
- import { CanvasRenderer } from "echarts/renderers";
-
- // 注册必须的组件
- echarts.use([
- TitleComponent,
- TooltipComponent,
- GridComponent,
- DatasetComponent,
- TransformComponent,
- LegendComponent,
- GeoComponent,
- VisualMapComponent,
-
- BarChart,
- LabelLayout,
- UniversalTransition,
- CanvasRenderer,
- LineChart,
- PieChart,
- MapChart
- ]);
-
- // 导出
- export default echarts;

第二步:在页面中引入:import echarts from "@/utils/echarts";
这样写出来可能不太明白自己需要的组件变量名称,可以按照下面方法去快速查找:
(1)找图表:


(2)找组件:

三、实现中国地图

因为我这里只用到了 中国地图,所有值引入了 china.json,没有像 1.2 里面那样引入整个 map。
- <div id="chinaMap" style='width:100%;height:622px'> </div>
-
- <script>
- import echarts from "@/utils/echarts";
- import china from '@/utils/echarts/china.json'
-
- export default {
- mounted(){
- this.initChinaMap();
- },
- methods:{
- // 中国地图
- initChinaMap(){
- echarts.registerMap('china', china); //注册地图数据
- const mychart = echarts.init(document.getElementById("chinaMap"));
- const option = {
- //浮动提示框
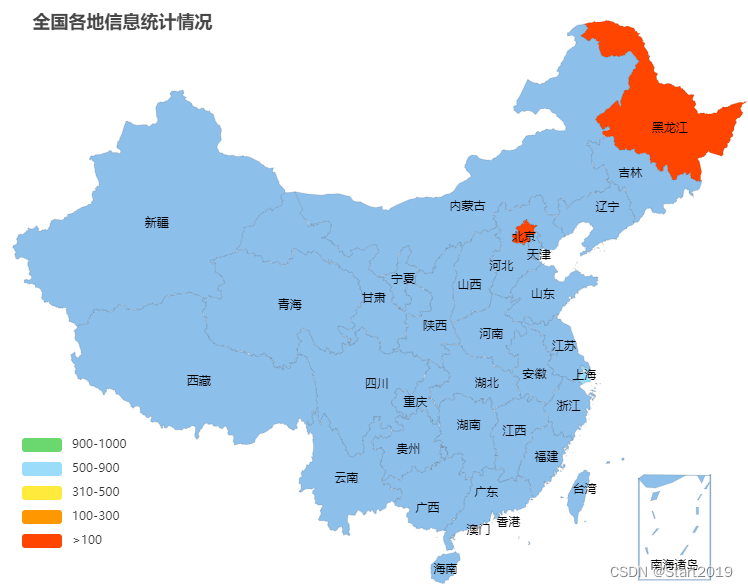
- title: { text: '全国各地信息统计情况',left: "4%",top: "3%"},
- tooltip:{
- backgroundColor:"rgba(50,50,50,0.7)",
- textStyle:{color:"#fff"},
- formatter(params, ticket, callback){
- // params.data 就是series配置项中的data数据遍历
- let value=0,rukuNum=0,chukuNum=0;
- if(params.data){
- value = params.data.value;
- rukuNum = params.data.rukuNum;
- chukuNum = params.data.chukuNum;
- }
- let html = `<div>入库数量:${rukuNum}</div>
- <div>出库数量:${chukuNum}</div>`
- return html;
- }
- },
- visualMap: {
- type: "piecewise",
- min:0,
- max:5000,
- itemWidth: 40,
- bottom:60,left:20,
- pieces: [ // 自定义『分段式视觉映射组件(visualMapPiecewise)』的每一段的范围,以及每一段的文字,以及每一段的特别的样式
- {gt: 900, lt: 1000, label: '900-1000', color: '#6ad86e'}, // (900, 1000]
- {gt: 500, lt: 900, label: '500-900', color: '#9adcfa'}, // (500, 900]
- {gt: 310, lt: 500, label: '310-500', color: '#ffeb3b'}, // (310, 500]
- {gt: 100, lt: 300, label: '100-300', color: '#ff9800'}, // (200, 300]
- {gt: 0, lt: 100, label: '>100', color: 'orangered'} // (10, 200]
- ]
- },
- geo:{
- map: "china",
- zoom:1.2,
- label:{show:true},
- itemStyle:{
- borderColor: 'rgba(0, 0, 0, 0.2)',
- // areaColor: '#8DBFEB', //地图的背景色
- emphasis: { // 高亮状态下的多边形和标签样式
- shadowBlur: 20,
- shadowColor: 'rgba(0, 0, 0, 0.5)'
- }
- }
- },
- series: [
- {name:"",type:"map",geoIndex:0,label:{show:true},data:[
- {"name": "北京", "value": 42, "rukuNum":42,"chukuNum":8},
- {"name": "上海", "value": 688, "rukuNum":688,"chukuNum":299},
- {"name": "黑龙江", "value": 7, "rukuNum":7,"chukuNum":0}
- ]}
- ]
-
- }
- mychart.setOption(option);
- window.addEventListener("resize", function () { mychart.resize(); });
- },
- }
- }
- </script>
注意点:
- 记住要使用 registerMap 注册地图数据。【官方文档地址链接】
- 悬浮框提示框 formatter文档:【文档地址】
- 地图背景色:解除 “areaColor: '#8DBFEB', //地图的背景色” 的注释,就能使地图变色。