
热门标签
热门文章
- 1python数据分析师工资待遇_预测python数据分析师的工资
- 2最全HIVE SQL字符串运算(字符串拼接、补足、拆分、截取、反转、trim修剪、ascii码、json解析、位置查找等)_sql 截断补位
- 3(代码详解)绘制箱线图+找离群点的具体位置+同时绘制多组数据的箱线图_用python绘制箱线图代码
- 4python HTML页面转jpg图片,可实现长截图保存_python html to jpg
- 5Pandas DataFrames筛选数据的方法_datafram 数据过滤
- 6FPGA车牌数字识别系统设计Verilog实现 ── 嵌入式_数字信号处理车牌识别
- 7宏(预编译)详解
- 8批量修改Ms SqlServer 的default(默认值)_sqlserver default
- 9iOS常用框架总结
- 10【共识系列.02】PBFT : 实用拜占庭容错算法
当前位置: article > 正文
【Python时序预测系列】基于多层LSTM实现多变量时间序列预测(案例+源码)_lstm 分类 python 代码
作者:小丑西瓜9 | 2024-05-23 13:20:36
赞
踩
lstm 分类 python 代码
这是我的第260篇原创文章。
一、引言
单站点多变量单步预测问题----基于多层LSTM实现多变量时间序列预测股票价格。
二、实现过程
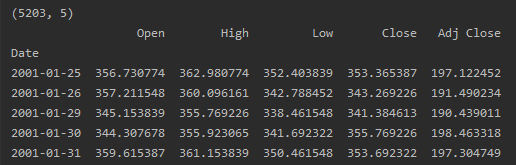
2.1 读取数据集
- df=pd.read_csv("data.csv", parse_dates=["Date"], index_col=[0])
- print(df.shape)
- print(df.head())
- fea_num = len(df.columns)
df:
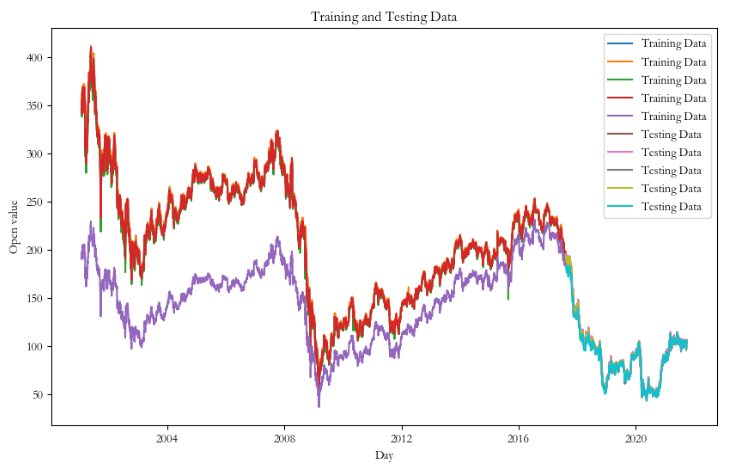
2.2 划分数据集
- # 拆分数据集为训练集和测试集
- test_split=round(len(df)*0.20)
- df_for_training=df[:-test_split]
- df_for_testing=df[-test_split:]
-
- # 绘制训练集和测试集的折线图
- plt.figure(figsize=(10, 6))
- plt.plot(train_data, label='Training Data')
- plt.plot(test_data, label='Testing Data')
- plt.xlabel('Year')
- plt.ylabel('Passenger Count')
- plt.title('International Airline Passengers - Training and Testing Data')
- plt.legend()
- plt.show()
共5203条数据,8:2划分:训练集4162,测试集1041。
训练集和测试集:
2.3 归一化
- # 将数据归一化到 0~1 范围
- scaler = MinMaxScaler(feature_range=(0,1))
- df_for_training_scaled = scaler.fit_transform(df_for_training)
- df_for_testing_scaled=scaler.transform(df_for_testing)
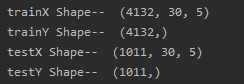
2.4 构造LSTM数据集(时序-->监督学习)
- def createXY(dataset,n_past):
- pass
-
- window_size = 30
- trainX,trainY=createXY(df_for_training_scaled,window_size)
- testX,testY=createXY(df_for_testing_scaled,window_size)
-
- # 将数据集转换为 LSTM 模型所需的形状(样本数,时间步长,特征数)
- trainX = np.reshape(trainX, (trainX.shape[0], window_size, 5))
- testX = np.reshape(testX, (testX.shape[0], window_size, 5))
-
- print("trainX Shape-- ",trainX.shape)
- print("trainY Shape-- ",trainY.shape)
- print("testX Shape-- ",testX.shape)
- print("testY Shape-- ",testY.shape)
滑动窗口设置为30:
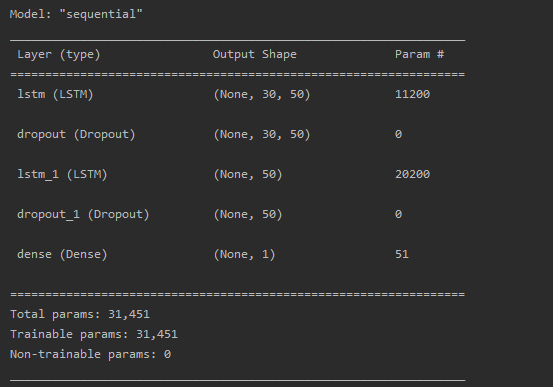
2.5 建立模拟合模型
- my_model = Sequential()
- my_model.add(Input(shape=(window_size, fea_num)))
- my_model.add(LSTM(50, return_sequences=True))
- my_model.add(Dropout(0.2))
- my_model.add(LSTM(50))
- my_model.add(Dropout(0.2))
- my_model.add(Dense(1))
-
- my_model.compile(loss='mse', optimizer='adam', metrics=['accuracy'])
- my_model.summary()
- my_model.fit(trainX, trainY)
2.6 进行预测
- prediction_test=my_model.predict(testX)
- prediction_train=my_model.predict(trainX)
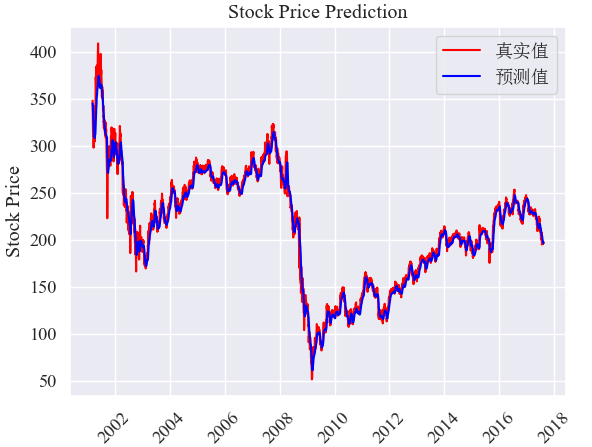
2.7 预测效果展示
- plt.plot(df_for_training.index[window_size:,], original_train, color = 'red', label = '真实值')
- plt.plot(df_for_training.index[window_size:,], pred_train, color = 'blue', label = '预测值')
- plt.title('Stock Price Prediction')
- plt.xlabel('Time')
- plt.xticks(rotation=45)
- plt.ylabel('Stock Price')
- plt.legend()
- plt.show()
训练集真实值与预测值:
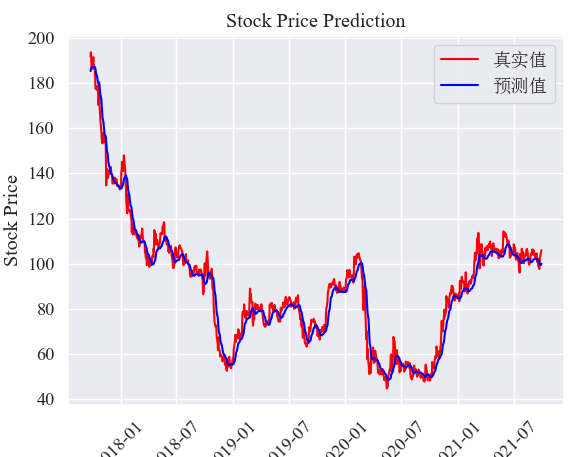
- plt.plot(df_for_testing.index[window_size:,], original_test, color = 'red', label = '真实值')
- plt.plot(df_for_testing.index[window_size:,], pred_test, color = 'blue', label = '预测值')
- plt.title('Stock Price Prediction')
- plt.xlabel('Time')
- plt.xticks(rotation=45)
- plt.ylabel('Stock Price')
- plt.legend()
- plt.show()
测试集真实值与预测值:
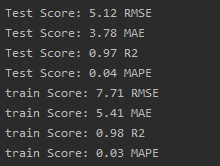
2.8 评估指标
作者简介:
读研期间发表6篇SCI数据挖掘相关论文,现在某研究院从事数据算法相关科研工作,结合自身科研实践经历不定期分享关于Python、机器学习、深度学习、人工智能系列基础知识与应用案例。致力于只做原创,以最简单的方式理解和学习,关注我一起交流成长。需要数据集和源码的小伙伴可以关注底部公众号添加作者微信。
声明:本文内容由网友自发贡献,不代表【wpsshop博客】立场,版权归原作者所有,本站不承担相应法律责任。如您发现有侵权的内容,请联系我们。转载请注明出处:https://www.wpsshop.cn/w/小丑西瓜9/article/detail/612993
推荐阅读
相关标签

