
热门标签
热门文章
- 1创建React Native项目_react native project 'path/to/project.xcodeproj
- 2pytorch的显存机制torch.cuda.empty_cache()_orch.cuda.empty_cache() cpu
- 3Angular学习笔记一之项目构建与模块创建_angular 创建项目
- 4Training language models to follow instructions with human feedback
- 5caffe之(五)loss层_caffe layer type loss定义
- 6vue3中引入文件ts报红色波浪线问题_vue3 ts新建项目报红
- 7spring-boot-maven-plugin爆错所有最全解决方法_
org.springfram - 8【开源】JAVA+Vue.js实现城市桥梁道路管理系统
- 9datax参数设置_datax 优化设置
- 10永磁同步电机矢量控制(九)——三闭环位置控制系统_三闭环控制系统
当前位置: article > 正文
Python Flask定时调度疫情大数据爬取全栈项目实战使用-14中国地图ajax动态获取数据_python flask读取省份,监测点,测量时间,测量值北京奥林匹克森林公园站2020-07-2
作者:我家自动化 | 2024-02-26 02:34:49
赞
踩
python flask读取省份,监测点,测量时间,测量值北京奥林匹克森林公园站2020-07-2
中国地图
一、复制中国地图option,导入china.js
ec_center.js定义了option,复制到项目的js文件夹中
//初始化echarts实例
var ec_center = echarts.init(document.getElementById("c2"),"dark");
var mydata = []
var optionMap = {
		title: {
			text: '',
			subtext: '',
			x: 'left'
		},
		tooltip: {
			trigger: 'item'
		},
		//左侧小导航图标
		visualMap: {
			show: true,
			x: 'left',
			y: 'bottom',
			textStyle: {
				fontSize: 8
			},
			splitList: [{
					start: 1,
					end: 9
				},
				{
					start: 10,
					end: 99
				},
				{
					start: 100,
					end: 999
				},
				{
					start: 1000,
					end: 9999
				},
				{
					start: 10000
				}
			],
			color: ['#8A3310','#C64918', '#E55B25','#F2AD92', '#F9DCD1']
		},

			//配置属性
			series: [{
				name: '累积确诊人数',
				type: 'map',
				mapType: 'china',
				roam: false,
				itemStyle: {
					normal: {
						borderWidth: .5,
						borderColor: '#009fe8',
						areaColor: '#ffefd5'
					},
					emphasis: {
						borderWidth: .5,
						borderColor: '#4b0082',
						areaColor: '#fff'
					}
				},
				label: {
					normal: {
						show: true, //省份名称
						fontSize: 8
					},
					emphasis: {
						show: true,
						fontSize: 8
					}
				},
				data: mydata //数据
			}]
		};

		//使用制定的配置项和数据显示图表
		ec_center.setOption(optionMap);

- 1
- 2
- 3
- 4
- 5
- 6
- 7
- 8
- 9
- 10
- 11
- 12
- 13
- 14
- 15
- 16
- 17
- 18
- 19
- 20
- 21
- 22
- 23
- 24
- 25
- 26
- 27
- 28
- 29
- 30
- 31
- 32
- 33
- 34
- 35
- 36
- 37
- 38
- 39
- 40
- 41
- 42
- 43
- 44
- 45
- 46
- 47
- 48
- 49
- 50
- 51
- 52
- 53
- 54
- 55
- 56
- 57
- 58
- 59
- 60
- 61
- 62
- 63
- 64
- 65
- 66
- 67
- 68
- 69
- 70
- 71
- 72
- 73
- 74
- 75
- 76
- 77
- 78
main.html引入echarts.min.js china.js
<!DOCTYPE html>
<html>
	<head>
		<meta charset="utf-8">
		<title>疫情监控</title>
		<script src="../static/js/jquery.js"></script>
		<script src="../static/js/echarts.min.js"></script>
		<script src="../static/js/china.js"></script>
- 1
- 2
- 3
- 4
- 5
- 6
- 7
- 8
body中 把ec_center.js引入进来
		<div id="r1">我是右1</div>
		<div id="r2">我是右2</div>
		<script src="../static/js/ec_center.js"></script>
- 1
- 2
- 3
优化main.html代码 把js抽取出来
新建一个controller.js
			function gettime(){
				$.ajax({
					url:"/time",
					timeout:10000,//超时时间设置为10秒;
					success:function(data){
						$("#time").html(data)
					},
					error:function(xhr,type,errorThrown){

					}
				});
			}

			function get_c1_data(){
			    $.ajax({
                        url:"c1",
                        success:function(data){
						    $(".num h1").eq(0).text(data.confirm);
						    $(".num h1").eq(1).text(data.suspect);
						    $(".num h1").eq(2).text(data.heal);
						    $(".num h1").eq(3).text(data.dead);
                        },
                        error:function(xhr,type,errorThrown){

                        }
                })
            }
			//setInterval(get_c1_data, 1000)
			// setInterval(gettime, 1000)
- 1
- 2
- 3
- 4
- 5
- 6
- 7
- 8
- 9
- 10
- 11
- 12
- 13
- 14
- 15
- 16
- 17
- 18
- 19
- 20
- 21
- 22
- 23
- 24
- 25
- 26
- 27
- 28
- 29
main.html 引入controller.js
		<div id="c2">我是中2</div>
		<div id="r1">我是右1</div>
		<div id="r2">我是右2</div>
		<script src="../static/js/ec_center.js"></script>
		<script src="../static/js/controller.js"></script>
- 1
- 2
- 3
- 4
- 5
添加controllers.js获取后台数据
function get_c2_data(){
	$.ajax({
			url:"c2",
			success:function(data){
				optionMap.series[0].data = data.data
				ec_center.setOption(optionMap)
			},
			error:function(xhr,type,errorThrown){

			}
	})
}
- 1
- 2
- 3
- 4
- 5
- 6
- 7
- 8
- 9
- 10
- 11
- 12
二、 前后台数据交流
utils.py添加数据库获取函数
def get_c2_data():
    """
    :return 返回各省数据
    """
    sql= "select province,sum(confirm) from details" \
            " where update_time=(select update_time from  details order by update_time desc limit 1)" \
            " group by province"
    res = query(sql)
    return  res
- 1
- 2
- 3
- 4
- 5
- 6
- 7
- 8
- 9
app.py 添加c2接口路由:
@app.route('/c2')
def get_c2_data():
    res = []
    for tup in utils.get_c2_data():
        print(tup)
        res.append({"name":tup[0],"value":int(tup[1])})
    return jsonify({"data": res})
- 1
- 2
- 3
- 4
- 5
- 6
- 7
更改前端调用方式 只是调用1次:
function get_c2_data(){
	$.ajax({
			url:"c2",
			success:function(data){
				optionMap.series[0].data = data.data
				ec_center.setOption(optionMap)
			},
			error:function(xhr,type,errorThrown){

			}
	})
}
gettime()
get_c1_data()
get_c2_data()
- 1
- 2
- 3
- 4
- 5
- 6
- 7
- 8
- 9
- 10
- 11
- 12
- 13
- 14
- 15
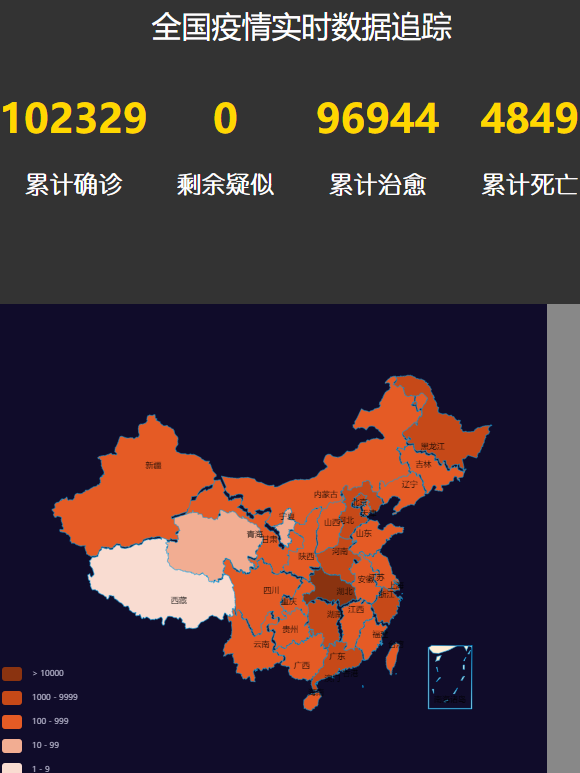
最后的运行结果:
声明:本文内容由网友自发贡献,不代表【wpsshop博客】立场,版权归原作者所有,本站不承担相应法律责任。如您发现有侵权的内容,请联系我们。转载请注明出处:https://www.wpsshop.cn/w/我家自动化/article/detail/143355
推荐阅读
相关标签

