热门标签
热门文章
- 1Git: 仓库clone和用户配置_git clone 配置账号密码
- 2Unity开发日志1:#4对话系统_unity 对话系统
- 3《统计学》笔记:第11章 一元线性回归_一元线性回归修正偏差
- 4A*算法(二):8方向_ai寻路 8方向
- 5【Unity 3D】元宇宙概念、应用前景、价值链等概述_unity 元宇宙
- 6Unity---表面着色器_#pragma surface surf lambert
- 7程序员视角体验快速搭建智能客服中心
- 8Unity实现自己的简易游戏窗口管理器_unity addcomponent
() - 9使用PerfView诊断.Net GC的问题
- 10UE4小地图制作 (使用蓝图制作小地图)_ue小地图怎么做
当前位置: article > 正文
Echarts各类图例的一些常见api用法以及踩坑_echarts api
作者:盐析白兔 | 2024-02-18 06:09:03
赞
踩
echarts api
用法:关于组件传值
父子组件传值
通过接口获取渲染Echarts的数据
但是由于同异步的问题 可能接口还没渲染出来 就已经给子组件传值了
在父组件请求接口然后传值给echarts封装的子组件
给父组件加一个判断 确认有值了 再给子组件传值
<lineChart v-if="flag" :lineoption="lineoption"></lineChart>
- 1
这样可以避免父页面还没获取到值 就已经传到子组件了
子父组件传值
子组件的watch监听
在子组件上加一个监听 确认有值之后再调用我们的方法
监听这里有改进 慎用箭头函数
 props: {
    lineoption: {
      typeof: Object,
      default: () => {
        return {};
      }
    }
  },
  watch: {
    lineoption: function (newVal) {
    //监听从父组件传递过来的值 如果有更新就调用我们渲染的方法
      this.lineoption = newVal;
      this. initChart();
    }
  }
- 1
- 2
- 3
- 4
- 5
- 6
- 7
- 8
- 9
- 10
- 11
- 12
- 13
- 14
- 15
子组件的emit传值
以及子组件触发图表的点击事件 向父组件传值
按照以往的子父组件传值 肯定会报错
this.$emit is not a function 这是因为this指向的问题
问题大么 问题不大 只需要 that = this 即可
 methods: {
    initCharts() {
      var myChart = echarts.init(document.getElementById('pie'));
      myChart.setOption(this.option);
      window.addEventListener('resize', () => {
        myChart.resize();
      });
      let that = this; //把this赋给变量that
      myChart.on('click', function (params) {
        if (params.componentType === 'series') {
          console.log(params.data);
          this.$emit('pieDate', params.data);
        }
      });
    }
  },
- 1
- 2
- 3
- 4
- 5
- 6
- 7
- 8
- 9
- 10
- 11
- 12
- 13
- 14
- 15
- 16
经过后期实验 这里用子父传值很费劲 还是用兄弟组件传值吧 Bus.$emit(‘事件名’, 传递的值);
图表划过显示信息
饼图示例

划过显示信息
  tooltip: {
       trigger: 'item',
       formatter: '{a}{b} : {c} ({d}%)'
   },
- 1
- 2
- 3
- 4
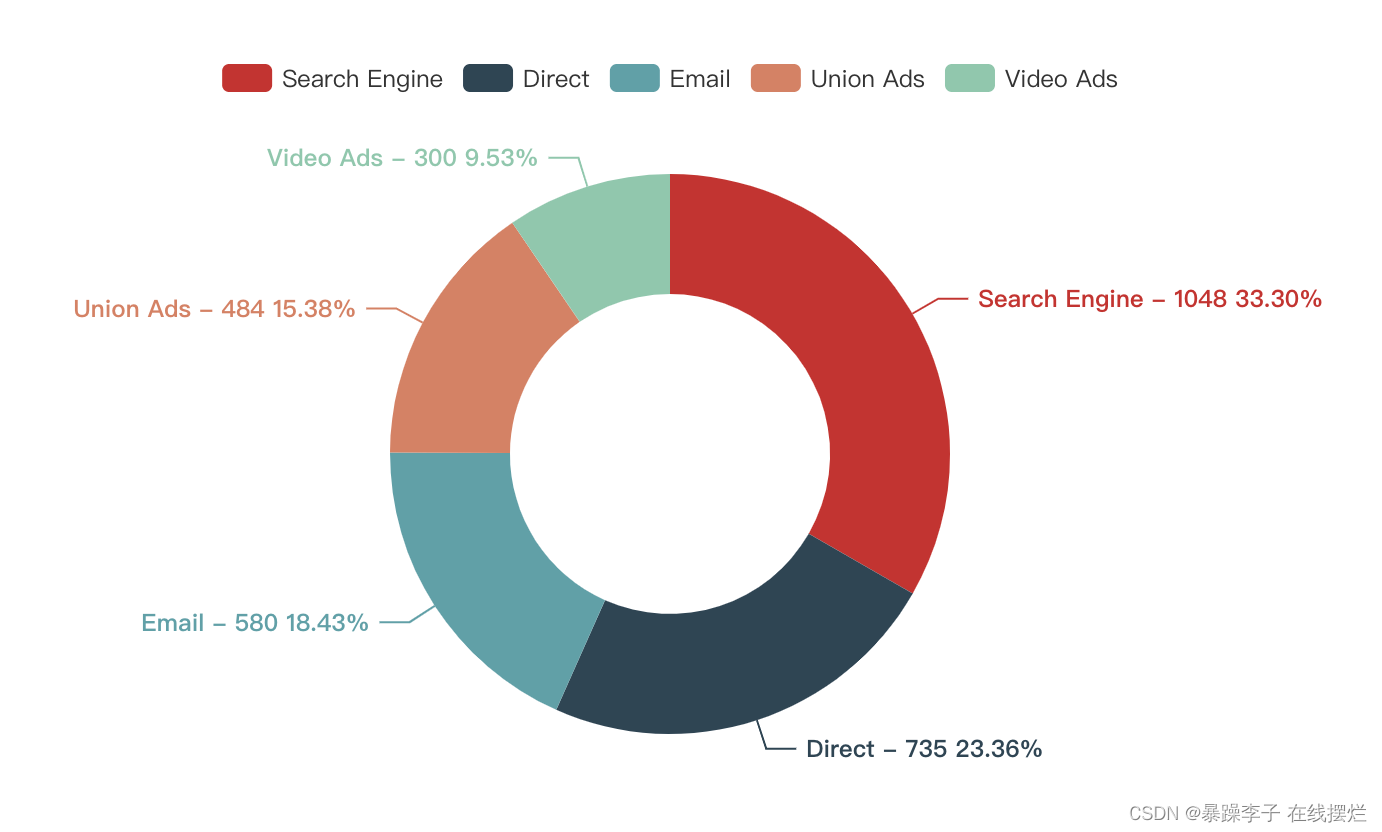
去掉环形图中间的文字说明

series:[{label:{}}] 的api说明
饼图的label始终显示
在label中的position属性中(说明文字为“outer”,百分比为“inner”)
   label: { // 饼图中间文字设置
          normal: {
             show: true,
             position: 'outer',
             fontSize: 12,
             fontWeight: 'bold',
             align: 'left',
             formatter: function (p) { // 指示线对应文字,说明文字
                    return `${p.data.name} - ${p.data.value} ${p.percent.toFixed(2) + '%'}`;
                }
              },
            },
- 1
- 2
- 3
- 4
- 5
- 6
- 7
- 8
- 9
- 10
- 11
- 12
- 13
- 14
用到了 JavaScript toFixed() 方法
把数字转换为字符串,结果的小数点后有指定位数的数字
饼图划过 label不消失
label:{},
emphasis: {
    label: {
        show: true
      }
},
- 1
- 2
- 3
- 4
- 5
- 6
折线图示例
 tooltip : {
      trigger: 'axis',
         axisPointer: {
           type: 'cross',
           label: {
             backgroundColor: '#6a7985'
           }
         }
       },
- 1
- 2
- 3
- 4
- 5
- 6
- 7
- 8
- 9
点击折线图的legend触发的事件
myChart.on('legendselectchanged', function (params) {
    console.log(params);
});
- 1
- 2
- 3
!!!点击legend 其他数据消失 再次点击 恢复全部数据
这个坑也多 后续可能会乱序吧 有缘再写
 var triggerAction = function (action, selected) {
        let legend = [];
        for (name in selected) {
          if (selected.hasOwnProperty(name)) {
            legend.push({ name: name });
          }
        }
        myChart.dispatchAction({
          type: action,
          batch: legend
        });
      };
      var isFirstUnSelect = function (selected) {
        var unSelectedCount = 0;
        for (name in selected) {
          if (!selected.hasOwnProperty(name)) {
            continue;
          }

          if (selected[name] == false) {
            ++unSelectedCount;
          }
        }
        return unSelectedCount == 1;
      };

      var isAllUnSelected = function (selected) {
        var selectedCount = 0;
        for (name in selected) {
          if (!selected.hasOwnProperty(name)) {
            continue;
          }
          // 所有 selected Object 里面 true 代表 selected, false 代表 unselected
          if (selected[name] == true) {
            ++selectedCount;
          }
        }
        return selectedCount == 0;
      };

      myChart.on('legendselectchanged', function (obj) {
        var selected = obj.selected;
        var legend = obj.name;
        // 使用 legendToggleSelect Action 会重新触发 legendselectchanged Event,导致本函数重复运行
        // 使得 无 selected 对象
        if (selected != undefined) {
          if (isFirstUnSelect(selected)) {
            triggerAction('legendToggleSelect', selected);
          } else if (isAllUnSelected(selected)) {
            triggerAction('legendSelect', selected);
          }
        }
      });
- 1
- 2
- 3
- 4
- 5
- 6
- 7
- 8
- 9
- 10
- 11
- 12
- 13
- 14
- 15
- 16
- 17
- 18
- 19
- 20
- 21
- 22
- 23
- 24
- 25
- 26
- 27
- 28
- 29
- 30
- 31
- 32
- 33
- 34
- 35
- 36
- 37
- 38
- 39
- 40
- 41
- 42
- 43
- 44
- 45
- 46
- 47
- 48
- 49
- 50
- 51
- 52
- 53
- 54
柱状图示例
显示legend以及划过显示信息

legend: {
    data: ['2011', '2012']
},
tooltip: {
     trigger: 'axis',
      axisPointer: { // 坐标轴指示器,坐标轴触发有效
          type: '' // 默认为直线,可选为:'line' | 'shadow'
      },
      formatter: '{b}: {c}'
},
- 1
- 2
- 3
- 4
- 5
- 6
- 7
- 8
- 9
- 10
- 11
- 12
选择shadow的话 划过时候有阴影 如图

纵轴如何加单位
yAxis: {
   type: 'value',
   axisLabel: {
      formatter: '¥{value}'
   }
 },
- 1
- 2
- 3
- 4
- 5
- 6
- 7
- 8
setOption第二个参数的坑
害我新增对象的时候 筛选一直出错 最后才找到这个配置
myChart.setOption(this.option, true);
- 1
第二参数为true时,表示不合并。为false时,表示合并
声明:本文内容由网友自发贡献,不代表【wpsshop博客】立场,版权归原作者所有,本站不承担相应法律责任。如您发现有侵权的内容,请联系我们。转载请注明出处:https://www.wpsshop.cn/w/盐析白兔/article/detail/105509
推荐阅读
Copyright © 2003-2013 www.wpsshop.cn 版权所有,并保留所有权利。


