热门标签
热门文章
- 1若依系列框架RuoYi-Vue(117集)、RuoYi-Cloud(134集)最新完整视频_若依框架(ruoyi)系列视频教程 ruoyi-vue前后端分离版本 118集
- 2802.11局域网的 MAC 层协议、CSMA/CA
- 3在Windows上搭建OpenVINO™ Java开发环境
- 451单片机-WIFI模块_51 与wifi模组
- 5【AIGC大模型】跑通wonder3D (windows)
- 6SpringBoot中开启logback日志 (一)_logback开启某个包debug日志
- 7Chrome插件精选_video downloader professional chrome
- 8Zabbix监控华为交换机
- 9九、【python计算机视觉编程】图像分割_python graph cut
- 10使用MIB Builder 生成MIB文件_mlbb creator base
当前位置: article > 正文
KITTI数据集可视化_kitti目标检测数据集 pcl c++可视化
作者:笔触狂放9 | 2024-02-19 20:01:22
赞
踩
kitti目标检测数据集 pcl c++可视化
1 lidar点云数据可视化
KITTI 中的lidar数据是以二进制文件.bin存储的。每个点包含4个值: x,y,z坐标值和反射强度值。
1.1 方式1: 通过matplotlib画图
import numpy as np  # 用来处理数据
import matplotlib.pyplot as plt

res = np.fromfile("/000001.bin", dtype=np.float32).reshape(-1, 4)
x, y, z = res[:, 0], res[:,1], res[:,2]
ax = plt.subplot(projection='3d')  # 创建一个三维的绘图工程
ax.set_title('3d_image_show')  # 设置本图名称
ax.scatter(x, y, z, c=z, # height data for color
               cmap='rainbow',
               marker="x")  # 绘制数据点 c: 'r'红色,'y'黄色,等颜色

ax.set_xlabel('X')  # 设置x坐标轴
ax.set_ylabel('Y')  # 设置y坐标轴
ax.set_zlabel('Z')  # 设置z坐标轴

plt.show()
- 1
- 2
- 3
- 4
- 5
- 6
- 7
- 8
- 9
- 10
- 11
- 12
- 13
- 14
- 15
- 16
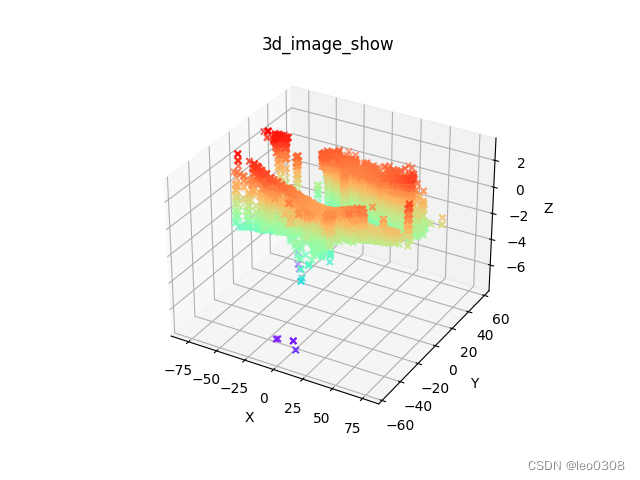
可视化的效果是下图的样子, 其实不是很直观。

1.2 用点云可视化工具打开
这里我用到的是MeshLab和CloudCompare。
大多数的工具都不支持直接打开二进制文件, 所以需要先预处理一下。 txt格式比较简单,因此把二进制文件转成txt。txt中的每一行表示一个点。
简单的转换代码:
res = np.fromfile("000001.bin", dtype=np.float32).reshape(-1, 4)
with open('000001.txt','w') as fp:
    [fp.write(str(item[0])+','+str(item[1]) +',' +str(item[2]) +'\n') for  item in res]
- 1
- 2
- 3
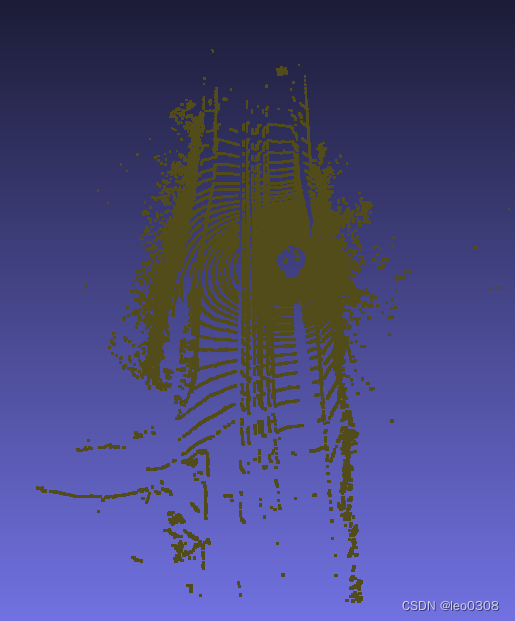
这个可视化的效果就还可以了。

CloudCompare软件, 如果直接从file里面去选择打开文件的话, 会发现没有对txt格式的支持。 后来发现, 直接把txt文件拖入这个软件的界面就可以打开 了。
打开的效果如下:

这个效果要更好一些。
2 点云数据投影到图像上
点云数据和图像数据是有对应关系的, 把点云数据和图像展现在同一个图像上, 可以更直观的看到数据之间的对应关系。
由于点云数据和相机的图像数据不是在同一个坐标系下, 因此要想画在一个图上, 必须把点云数据对应到图像上。 主要有3次转换, 分别是: 激光雷达坐标系–>参考相机坐标系–>图像. 详细原理可参见:KITTI数据集激光雷达点云3D-Box可视化Matlab代码
代码中注释写的比较清楚了, 具体实现可参考下面的代码:
import numpy as np
import matplotlib.pyplot as plt
import cv2
import copy

img_file = "000008.png"
lidar_file = "000008.bin"
calib_file = "000008.txt"


def show_lidar(lidar_file):
    points = np.fromfile(lidar_file, dtype=np.float32).reshape(-1,4)
    x, y, z = points[:, 0], points[:, 1], points[:, 2]
    ax = plt.subplot(projection='3d')
    ax.set_title('lidar_image')
    ax.scatter(x, y, z, c=z,  # height data for color
               cmap='rainbow',
               marker="x")

    ax.set_xlabel('X')  # set axes
    ax.set_ylabel('Y')
    ax.set_zlabel('Z')

    plt.show()


def save_lidar_txt(lidar_file):
    points = np.fromfile(lidar_file, dtype=np.float32).reshape(-1, 4)
    with open('000008.txt', 'w') as fp:
        [fp.write(str(item[0]) + ',' + str(item[1]) + ',' + str(item[2]) + '\n') for item in points]


def show_image(img_file):
    img = cv2.imread(img_file)
    img = img[:, :, ::-1]  # convert BGR to RGB
    plt.imshow(img)
    # plt.show()


def get_calib_from_file(calib_file):
    """Read the calib txt"""
    with open(calib_file) as f:
        lines = f.readlines()

    obj = lines[2].strip().split(' ')[1:]
    P2 = np.array(obj, dtype=np.float32)
    obj = lines[3].strip().split(' ')[1:]
    P3 = np.array(obj, dtype=np.float32)
    obj = lines[4].strip().split(' ')[1:]
    R0 = np.array(obj, dtype=np.float32)
    obj = lines[5].strip().split(' ')[1:]
    Tr_velo_to_cam = np.array(obj, dtype=np.float32)
    return {'P2': P2.reshape(3, 4),
            'P3': P3.reshape(3, 4),
            'R0': R0.reshape(3, 3),
            'Tr_velo2cam': Tr_velo_to_cam.reshape(3, 4)}


def _3d_matmul(mat1, mat2):
    return np.einsum("ijk, ikn ->ijn", mat1, mat2)

def project_lidar_to_img(calib_file, lidar_file):
    """convert the lidar point from lidar coordinate system to camera coordinate system."""
    points = np.fromfile(lidar_file, dtype=np.float32).reshape(-1, 4)
    valid_idx = (points[:,0]>5).nonzero()  # the area of x<5 is the blind spot of camera
    points = points[valid_idx]
    points = points[::5]   # sample every 5 points so the image will be clear
    points[:, 3] = 1
    points = np.expand_dims(points, axis=2)
    points_num = len(points)
    calib = get_calib_from_file(calib_file)
    P2 = calib["P2"]
    P2_batch = np.expand_dims(P2, axis=0).repeat(points_num, axis=0) # [3,4]->[points_num, 3, 4]
    R0 = calib["R0"]
    R0_pad = np.eye(4)
    R0_pad[0:3, 0:3] = R0
    R0_pad_batch = np.expand_dims(R0_pad, axis=0).repeat(points_num, axis=0) # [4,4]->[points_num, 4, 4]
    Tr_velo2cam = calib["Tr_velo2cam"]
    Tr_velo2cam_pad = np.eye(4)
    Tr_velo2cam_pad[0:3, :] = Tr_velo2cam
    Tr_velo2cam_pad_batch = np.expand_dims(Tr_velo2cam_pad, axis=0).repeat(points_num, axis=0)

    # proj = P2 @ (R0_pad @ (Tr_velo2cam_pad @ point))  for single point

    proj = _3d_matmul(Tr_velo2cam_pad_batch, points)
    proj = _3d_matmul(R0_pad_batch, proj)
    proj = _3d_matmul(P2_batch, proj) #shape is [batch, 3,1]
    proj = proj[:, :, 0] # shape is [batch, 3]
    norm = copy.deepcopy(proj)
    depth = proj[:,2]
    norm[:, 0] = depth
    norm[:, 1] = depth
    proj = proj/norm

    return proj, depth


if __name__ == "__main__":
    show_lidar(lidar_file)
    save_lidar_txt(lidar_file)
    show_image(img_file)


    # proj the lidar to camera and plot them together
    proj, _ = project_lidar_to_img(calib_file, lidar_file)
    X = np.clip(proj[:, 0], 0, 1242) #the image size is [375, 1242]
    Y = np.clip(proj[:, 1], 0, 375)
    col_idx = np.round(64*5/X)
    plt.scatter(X, Y, c=col_idx, cmap='rainbow',marker="x")
    plt.show()
- 1
- 2
- 3
- 4
- 5
- 6
- 7
- 8
- 9
- 10
- 11
- 12
- 13
- 14
- 15
- 16
- 17
- 18
- 19
- 20
- 21
- 22
- 23
- 24
- 25
- 26
- 27
- 28
- 29
- 30
- 31
- 32
- 33
- 34
- 35
- 36
- 37
- 38
- 39
- 40
- 41
- 42
- 43
- 44
- 45
- 46
- 47
- 48
- 49
- 50
- 51
- 52
- 53
- 54
- 55
- 56
- 57
- 58
- 59
- 60
- 61
- 62
- 63
- 64
- 65
- 66
- 67
- 68
- 69
- 70
- 71
- 72
- 73
- 74
- 75
- 76
- 77
- 78
- 79
- 80
- 81
- 82
- 83
- 84
- 85
- 86
- 87
- 88
- 89
- 90
- 91
- 92
- 93
- 94
- 95
- 96
- 97
- 98
- 99
- 100
- 101
- 102
- 103
- 104
- 105
- 106
- 107
- 108
- 109
- 110
- 111
- 112
- 113
最终的效果是:
声明:本文内容由网友自发贡献,不代表【wpsshop博客】立场,版权归原作者所有,本站不承担相应法律责任。如您发现有侵权的内容,请联系我们。转载请注明出处:https://www.wpsshop.cn/w/笔触狂放9/article/detail/116580
推荐阅读
相关标签


