
热门标签
热门文章
- 1Android 换肤方案详解(一)
- 2mac vbox 共享文件夹_mac下virtualbox设置共享文件夹
- 3(附源码)计算机毕业设计ssm电影网上购票系统_电影在线购票系统代码
- 4CSS主题切换方案说明
- 5鸿蒙系统学习 框架概述(一)_鸿蒙学习
- 6Opencv图像拼接_cv::mat 拼接
- 7深度学习案例之基于 CNN 的 MNIST 手写数字识别_mnist手写数字集可视化
- 8【vite】vite打包优化:_vitecompression
- 9HUAWEI DevEco Studio 3.1版本发布,配套ArkTS声明式开发全面升级_deveco是开发harmonyos应用的一站式集成开发环境
- 1023. Opencv——图像拼接项目_cv2.surf_create()
当前位置: article > 正文
matlab画图基础_matlab绘图如何加入x=0的直线
作者:AllinToyou | 2024-02-16 21:31:08
赞
踩
matlab绘图如何加入x=0的直线
matlab画图(primary)
x=0:.1:10;
y=x.^2-10*x+10;
plot(x,y);
- 1
- 2
- 3

x=0:.1:5;
y=x.^2-10*x+10;
plot(x,y);
- 1
- 2
- 3

根据设定的自变量的区间不同,所展示的图形区间不同
设置title、x坐标、y坐标、背景网格线
x=0:.1:10;
y=x.^2-10*x+10;
plot(x,y);
xlabel('x');
ylabel('y');
title('Plot of y=x.^2-10*x+10');
grid on;

% python中设置需要用import matplotlib as plt
% plt.title()
% plt.xlabel();
% plt.ylabel();
- 1
- 2
- 3
- 4
- 5
- 6
- 7
- 8
- 9
- 10
- 11
- 12

打印图片——print<选项><文件名>
print -dtiff my_image.tif
在PC、MAC、UNIX平台上的文字处理软件都支持TIFF格式
联合作图
将两个函数的图形展示在一个图中
% 联合图像
x=0:pi/100:2*pi;
y1=sin(x);
y2=cos(x);
plot(x,y1,x,y2);
grid on;
- 1
- 2
- 3
- 4
- 5
- 6

线的形状、形式、符号形式、图例
颜色:          标记类型:							线型
m   品红			.        点					-  		实线
c    青绿			o        圆				:		虚线
b    黑色			x        x号			-.		画点线
						s		正方形		--		虚线
						d		菱形			<none>	无
						v		倒三角
						^		正三角
						>		三角(向右)
						<		三角(向左)
						p		五角星
						h		六线形
						<none>		无
- 1
- 2
- 3
- 4
- 5
- 6
- 7
- 8
- 9
- 10
- 11
- 12
- 13
实现一下:
x=0:0.1*pi:2*pi;
y=cos(x);
plot(x,y,'b-d');
- 1
- 2
- 3

图例
legend(‘name1’,‘name2’,…,pos)
name1,name2,。。。都是线的对应的意思
pos的值:

对于y=sin(x),图例:
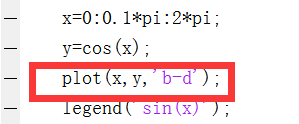
x=0:0.1*pi:2*pi;
y=cos(x);
plot(x,y,'b-d');
legend('sin(x)');
- 1
- 2
- 3
- 4

四种不同坐标系
plot():函数的x、y均用线性尺度
semilog():函数的x用对数尺度、y用线性尺度
semiloge():函数的x用线性尺度、y用对数尺度
loglog():函数的x、y均用对数尺度


声明:本文内容由网友自发贡献,不代表【wpsshop博客】立场,版权归原作者所有,本站不承担相应法律责任。如您发现有侵权的内容,请联系我们。转载请注明出处:https://www.wpsshop.cn/w/AllinToyou/article/detail/96856
推荐阅读
相关标签

